EVALUATION OF SELECTED FEATURES FOR CAR DETECTION IN AERIAL IMAGES
Sebastian Tuermera*, Jens Leitloffa, Peter Reinartza, Uwe Stillab
a
Remote Sensing Technology Institute (IMF), German Aerospace Center (DLR) 82234 Oberpfaffenhofen, Germany
sebastian.tuermer@dlr.de, jens.leitloff@dlr.de, peter.reinartz@dlr.de,
b
Photogrammetry and Remote Sensing (PRS), Technische Universitaet Muenchen (TUM) Arcisstrasse 21, 80333 Munich, Germany
stilla@tum.de
Commission III/4
KEY WORDS:vehicle detection, aerial images, Haar-like features, HoG features, Boosting, 3K camera system
ABSTRACT:
The extraction of vehicles from aerial images provides a wide area traffic situation within a short time. Applications for the gathered data are various and reach from smart routing in the case of congestions to usability validation of roads in the case of disasters. The challenge of the vehicle detection task is finding adequate features which are capable to separate cars from other objects; especially those that look similar. We present an experiment where selected features show their ability of car detection. Precisely, Haar-like and HoG features are utilized and passed to the AdaBoost algorithm for calculating the final detector. Afterwards the classifying power of the features is accurately analyzed and evaluated. The tests a carried out on aerial data from the inner city of Munich, Germany and include small inner city roads with rooftops close by which raise the complexity factor.
1 INTRODUCTION
The improvements of advanced driver assistance systems achieved in the last decades are impressive; individual mobility has never been more comfortable as today. Modern cars are littered with helpful gadgets. Just think on systems like parking sensors, rain sensor, adaptive light control or active speed control, to name a few of the latest operational inventions. And of course not to for-get navigation systems which are capable of routing you directly to your destination without the necessity of reading a map. No doubt all of these assistant systems make life remarkable easier. However all of these technical accomplishments are not worth anything if the roads are congested and driving is not possible.
Due to this aspect a lot of research is done developing traffic surveillance systems (Meffert et al., 2005) which should indicate traffic jams and provide alternative routing in addition. Ground-work of all the routing attempts is the detection of the cars. Nowa-days the information about the position of the cars is mainly re-ceived by induction loops, car to car communication, floating car solutions or stationary video cameras. A novel approach which is in its infancy takes the position of the navigation system (GPS co-ordinates) and sends the information to a data acquisition center. Current research is carried out by Tomtom a Dutch manufacture of navigation systems. They do not want to introduce a new trans-mitting module but take the driver’s mobile phone. That takes us to another innovative method, Observed Time Difference of Arrival (OTDOA) which is only working in UMTS environment and delivers positioning data with an accuracy ranging from 50 to 100 meters. However all of the methods mentioned are not able to satisfy our needs completely.
The acquisition method that fits best to our prerequisites is aerial imaging. The most important advantages are rapid availability, high positional accuracy and the capability of covering large areas within less time. The system is mainly developed to get real-time traffic information in the case of mass events or catastrophes. But by far this is not the only application, also traffic analysts could benefit by using the data weeks later for validating their
road planning including traffic signals and speed limits. And not to forget a further advantage, the by-product real-time mapping which could show broken or blocked roads after natural disasters.
Finally, to obtain the traffic data automatically a wide variety of methods for car extraction from aerial imagery can be consulted. Some are explicit trying to find a predefined model in the search image whereas others use implicit methods where the model is created by example images. But all of them have a similar chal-lenge which is finding features that describe the object optimally.
We contribute to the workshop a detailed testing and evaluation of selected features for car detection. These features are Haar-like and HoG features. All of these features run through the same machine learning process. This should ensure the comparability of returned results. The AdaBoost algorithm calculates the final classifier for each feature set. Afterwards, the classification ca-pability of each detector is determined. We take prominent key figures like recall or precision rate for the comparison process. But also facts like computation time or expandability come into account. The test dataset consists of aerial images with a reso-lution of approximately 15 cm from a professional off the shelf digital frame camera. Test area is the inner city of Munich with its small roads and high buildings.
2 RELATED WORK
multi dimensional color histograms. A combination of Haar and HoG features which are formed to a strong cascading classifier by Boosting presents (Negri et al., 2008). In (Kasturi et al., 2009) a simple background subtraction is done which is only working for video data. An overview on the work for stationary cameras can be found in (Sun et al., 2006).
The next group considers satellite imagery which provide a re-duced spatial resolution (highest resolution is often max 0.5 m) and mainly use single images, not time series. An approach which uses simple features based on shape and intensity presents (Eikvil et al., 2009). Using segmented images and apply a max-imum likelihood classification can be observed in (Larsen et al., 2009). Promising results have also been achieved by (Leitloff et al., 2010). They use Haar-like features in combination with Ad-aBoost.
The last group of approaches deals with airborne images. At this step we first suggest a further separation in explicit or implicit models. Approaches based on explicit models are for example given in (Moon et al., 2002) with a convolution of a rectangular mask and the original image. Also (Zhao and Nevatia, 2003) of-fer an interesting method by creating a wire-frame model and try to match it with extracted edges at the end of a Bayesian network. A similar way is suggested by (Hinz, 2003a) (Hinz, 2003b), the author makes the approach more mature and added additional pa-rameters like the position of the sun. Another proposed method of (Lenhart et al., 2008) uses a sophisticated blob detection. Color information is used as well as previous knowledge of the travel direction. (Kozempel and Reulke, 2009) provide a very fast solu-tion which takes four special shaped edge filters trying to repre-sent an average car. Finally implicit modeling is used by (Grabner et al., 2008), they take Haar-like features, HoG features and LBP (local binary patterns). All these features are passed to an on-line AdaBoost training algorithm which creates a strong classifier.
A comprehensive overview and evaluation of airborne sensors for traffic estimation can be found in (Hinz et al., 2006) and (Stilla et al., 2004).
3 THEORETICAL BACKGROUND
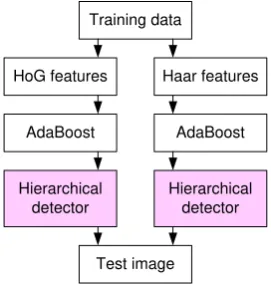
The following section enlightens briefly the utilized methods or algorithms for this experiment. The experimental setting is shown in Fig. 1. Main focus is on evaluating the effectiveness of the dif-ferent composed detectors.
Training data
HoG features Haar features
AdaBoost
Hierarchical detector
Test image
AdaBoost
Hierarchical detector
Figure 1: Experimental setting
3.1 Boosting
Boosting is the training method to obtain our vehicle detector. The general idea of boosting is the creation of a strong classifier by combining several weak classifiers. Where weak classifiers are classifiers that are better than chance. At first this has been done by (Schapire, 1990) (Freund, 1990) but the method was not adaptive at this time. Due to this missing characteristic, variants like AdaBoost have been developed (Freund and Schapire, 1997).
3.2 Haar-like features
Haar wavelets are functions calculating the difference of intensi-ties. A first approach using this features was presented by (Papa-georgiou et al., 1998). Soon, a short time later (Viola and Jones, 2001) took up this idea and proposed the so called Haar-like fea-tures. The functions are applied on different sized regions and different positions in the detection window. We utilize the re-duced original feature set represented in Fig. 2. Where the white field is subtracted of the black one. One of the most important
ad-(1) (2) (3)
(4)
(5)
Figure 2: Haar-like features
vantages over a lot of competitive features is the rapid processing time due to integral images. The integral image has to be cal-culated just once and enables a fast computation of all Haar-like features.
3.3 HoG features
Originally, HoG features were introduced by (Dalal and Triggs, 2005). We decide to chose this kind of feature due to its proven ability of describing objects simply and efficiently (Zhu et al., 2006). To speed up the calculation process integral histograms can be used (Porikli, 2005), similar to integral images in Subsec-tion 3.2 Haar-like features. The creaSubsec-tion process starts by sliding a window over a gradient image. Every window contains cer-tain sub-windows which are slided over the whole area of the window. Now the features are created by quantize gradient mag-nitudes from every sub-window to a histogram. The particular bin is chosen according to the gradient orientation. The schema in Fig. 3 shows the process of origin. A detailed explanation of these features and how the feature extraction works can be found in (Tuermer et al., 2010).
3.4 Multi-detection suppression
Gradient Image
Figure 3: Steps of creating a HoG feature
a technique which uses the confidence value returned by the ap-plication of the detector and the distance of the single detections. Inertial point is that cars must have a certain space between each other. The idea is realized by shifting a rectangle having the aver-age size of a car over the confidence imaver-age. Only the detection of the highest value remains. The technique is illustrated in Fig. 4.
0 0
Figure 4: Suppression of multi detection
4 RESULTS AND DISCUSSION
The aerial image used for this test has been taken by the DLR 3K camera system and has 15 cm spatial resolution. More infor-mation about the sensor can be found in (Tuermer et al., 2010). The road in the image is located close to the Technical University of Munich which is surrounded by high buildings with a lot of dormers. Especially dormers are often miss-classified due to its car-like shape.
4.1 Results
The three different detectors are applied to every pixel position of the test image. Usually road databases would be used to exclude areas where cars appear unlikely. But common road databases (e.g. Navteq) have a poor accuracy and therefore applying the de-tector on the roofs beside the road is not an unrealistic scenario. Hence we do not use additional ways of limiting the search space. Further remark is that only cars in the north-south direction and vice versa are the aim of the detection. A reason is the reduced training database of positive vehicles and the method itself which is not rotation invariant up to now.
The experimental results are partitioned in the following schema. The image we present first of each utilized feature set has no fur-ther processing steps. It shows a lot of false and multi detections. Whereas the second image is treated with the multi detection sup-pression procedure and a certain threshold.
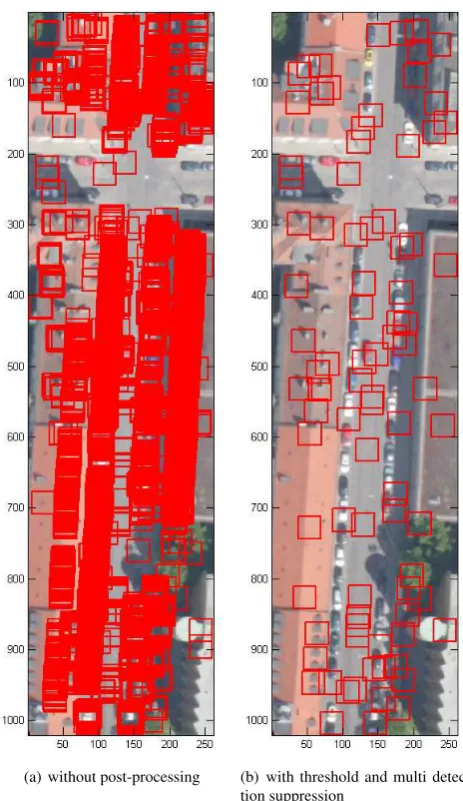
The cascading detector composed of the Haar-like features has seven hierarchical levels. Generally it can be assumed that a higher level implicates a higher amount of features. As depicted in Tab. 1, the first level uses three features whereas the last level consists of 13 linearly weighted features. The features are chosen from a pool of 11960 different ones. They are of size 1x1, 2x2, 4x4 and 8x8 pixels (for the features (1), (2), (3) in Fig. 2). The feature (4) is used with size 1x2, 2x4, 4x8 and 8x16; inversely ar-ranged in the case of feature (5). Applying the detector to the test image results in Fig. 5 (a) and after the post-processing Fig. 5 (b).
hierarchical level 1 2 3 4 5 6 7
Haar-like features 3 4 5 6 8 10 13
Table 1: Distribution of features used in the hierarchical detector with Haar-like features
(a) without post-processing (b) with threshold and multi detec-tion suppression
Figure 5: Result Haar-like features
hierarchical level 1 2 3 4 5
HoG features 3 4 5 6 7
Table 2: Distribution of features used in the hierarchical detector with HoG features
(a) without post-processing (b) with threshold and multi detec-tion suppression
Figure 6: Result HoG features
Finally the combination of Haar-like and HoG features leads to the results in Fig. 7. The cascading detector has 10 hierarchi-cal levels wherein the two steps at the beginning are composed of HoG features only. In general, the amount of used Haar-like features rises while reaching higher hierarchical levels. The dis-tribution of the features is shown detailed in Fig. 3.
At last prominent statistical measures of the performance of the binary classification can be found in Tab. 4. Where correctness (also known as precision rate) is defined in Eq. 1, completeness (also recall rate) in Eq. 2 and the definition of quality (accuracy)
is expressed in Eq. 3. With abbreviationT P as number of true
positives,F Pas number of false positives andF Nas number of false negatives.
correctness= T P
T P+F P (1)
completeness= T P
T P+F N (2)
hierarchical
level 1 2 3 4 5 6 7 8 9 10
features
Haar-like 0 0 2 3 4 6 6 10 13 16
HoG 3 4 3 3 4 4 7 6 6 8
total 3 4 5 6 8 10 13 16 19 24
Table 3: Distribution of features used in the hierarchical detector with Haar-like and HoG features mixed
(a) without post-processing (b) with threshold and multi detec-tion suppression
Figure 7: Result Haar-like and HoG features
quality= T P
T P+F P+F N (3)
4.2 Discussion
outper-Haar HoG Haar & HoG
Detections 7395 1231 1716
(before post-processing)
Detections 87 78 61
(after post-processing)
True positives 14 39 40
False positives 73 39 21
False negatives 31 8 7
Correctness 16 % 50 % 66 %
Completeness 31 % 83 % 85 %
Quality 12 % 45 % 59 %
Table 4: Statistics of detection
form the rival clearly. The primary visual impression can be vali-dated by the figures in Tab. 4 where we juxtapose the correctness, the completeness and the quality rates of the different detectors.
One reasonable explanation for this outcome can be the lack of multifaceted Haar-like features. We ran the tests with the stan-dard feature set (Fig. 2) but there is also an extended version available (published by (Lienhart and Maydt, 2002)) which could enhance the performance. A second assumption is that vehicles which are almost exclusively rectangular could fit better to HoG features in general.
Further interesting fact is that HoG features are used more often in lower hierarchical levels (shown in Tab. 3) whereas Haar-like features appear more often in higher detector levels. This means HoG features prevalently do the coarse classification and Haar-like features are used more often to distinguish between very sim-ilar objects.
Finally it is always appreciated to create a fast classifier for real time applications. Usually, a fast detector consists of features which are quickly processed and thereof as less as possible. Haar-like features can be calculated four times faster than four-bin-HoG features but a lot more Haar-like features are necessary to built a vehicle detector. Additionally, a good deal more detec-tion candidates reach higher detector levels (just look at the final overall detections in Tab. 4 before post-processing). This leads to a three times slower Haar-like based detector than the pure HoG based one.
Also the mixed detector which takes use of both features is slower, but after all the detection quality increases.
5 CONCLUSIONS AND FUTURE WORK
After finishing the experimental testing of the three different ve-hicle detectors, we have four concluding fundamental statements.
• A mixture of Haar-like and HoG features increases the
ve-hicle detection quality but takes more calculation time.
• A reduced Haar-like feature set and only AdaBoost is not
sufficient for a vehicle detection of high quality.
• HoG features need more calculation time for each single
feature (depends on the number of bins) but the detector per-forms faster due to less features utilized in the detector.
• HoG features show an robust rejection of false positives in early hierarchical levels of the detector; this saves time be-cause remaining detector levels can be skipped.
Our future plan is clearing questions which partly appeared while running the tests for this work. One point is the impact of an ex-tended Haar-like feature set. Our set is just composed of the five
most classical features but there are dozens of extensions. Another point is the introduction of new feature types which could help to make detection more accurate. Also improvements con-cerning the calculation time are imaginable.
And finally we would like to introduce an optimized post-processing chain which takes all the hypothetical car detections and achieves a deeper examination. The plan is using more information like color or the temporal component. Afterwards another interesting idea could be realized which moves towards a complex proba-bilistic framework.
REFERENCES
Dalal, N. and Triggs, B., 2005. Histograms of oriented gradi-ents for human detection. In: Conference on Computer Vision and Pattern Recognition (CVPR) 2005, Vol. 1, IEEE Computer Society, San Diego, CA, USA, pp. 886 – 893.
Eikvil, L., Aurdal, L. and Koren, H., 2009. Classification-based vehicle detection in high-resolution satellite images. ISPRS Jour-nal of Photogrammetry and Remote Sensing 64, pp. 65–72.
Freund, Y., 1990. Boosting a weak learning algorithm by ma-jority. In: Third Annual Workshop on Computational Learning Theory, COLT ’90, Morgan Kaufmann Publishers Inc, pp. 202– 216.
Freund, Y. and Schapire, R. E., 1997. A decision-theoretic gener-alization of on-line learning and an application to boosting. Jour-nal of Computer and System Sciences 55(1), pp. 119–139.
Grabner, H., Nguyen, T. T., Gruber, B. and Bischof, H., 2008. On-line boosting-based car detection from aerial images. ISPRS Journal of Photogrammetry and Remote Sensing 63(3), pp. 382 – 396.
Hinz, S., 2003a. Detection and counting of cars in aerial images. In: Proc. International Conference on Image Processing (ICIP), Vol. 2(III), pp. 997–1000.
Hinz, S., 2003b. Integrating local and global features for vehicle detection in high resolution aerial imagery. In: Photogrammetric Image Analysis (PIA), Vol. 34(3), International Archives of Pho-togrammetry, Remote Sensing and Spatial Information Sciences, pp. 119–124.
Hinz, S., Bamler, R. and Stilla, U., 2006. Editorial theme issue: Airborne und spaceborne traffic monitoring. ISPRS Journal of Photogrammetry and Remote Sensing 61(3-4), pp. 135–136.
Kasturi, R., Goldgof, D., Soundararajan, P., Manohar, V., Garo-folo, J., Bowers, R., Boonstra, M., Korzhova, V. and Zhang, J., 2009. Framework for performance evaluation of face, text, and vehicle detection and tracking in video: Data, metrics, and proto-col. IEEE Transactions on Pattern Analysis and Machine Intelli-gence 31(2), pp. 319–336.
Knauer, U., Reulke, R. and Meffert, B., 2005. Fahrzeugdetektion und -erkennung mittels mehrdimensionaler farbhistogrammanal-yse. In: Farbbildverarbeitung 2005, Berlin, pp. 93–100.
Kozempel, K. and Reulke, R., 2009. Fast vehicle detection and tracking in aerial image bursts. In: CMRT09, Vol. 38(3/W4), pp. 175–180.
Larsen, S. O., Koren, H. and Solberg, R., 2009. Traffic monitor-ing usmonitor-ing very high resolution satellite imagery. Photogrammetric Engineering and Remote Sensing 75(7), pp. 859–869.
Lenhart, D., Hinz, S., Leitloff, J. and U., S., 2008. Automatic traf-fic monitoring based on aerial image sequences. Pattern Recog-nition and Image Analysis 18(3), pp. 400 – 405.
Lienhart, R. and Maydt, J., 2002. An extended set of haar-like features for rapid object detection. In: IEEE ICIP 2002, pp. 900– 903.
Meffert, B., Blaschek, R., Knauer, U., Reulke, R., Schis-chmanow, A. and Winkler, F., 2005. Monitoring traffic by optical sensors. In: 2nd International Conference on Intelligent Comput-ing and Information Systems (ICICIS 2005), Cairo, Egypt, pp. 9– 14.
Moon, H., Chellappa, R. and Rosenfeld, A., 2002. Performance analysis of a simple vehicle detection algorithm. Image and Vi-sion Computing 20(1), pp. 1–13.
Negri, P., Clady, X., Hanif, S. M. and Prevost, L., 2008. A cas-cade of boosted generative and discriminative classifiers for vehi-cle detection. EURASIP Journal on Advances in Signal Process-ing 2008, pp. 1–12.
Papageorgiou, C. P., Oren, M. and Poggio, T., 1998. A general framework for object detection. In: Int Computer Vision Conf, pp. 555–562.
Porikli, F., 2005. Integral histogram: a fast way to extract his-tograms in cartesian spaces. In: Computer Society Conference on Computer Vision and Pattern Recognition (CVPR) 2005, Vol. 1, IEEE Computer Society, San Diego, CA, USA, pp. 829–836.
Schapire, R., 1990. Strength of weak learnability. Machine
Learning 5(2), pp. 197–227.
Schneiderman, H. and Kanade, T., 2000. A statistical method for 3d object detection applied to faces and cars. In: Conference on Computer Vision and Pattern Recognition (CVPR) 2000, Vol. 1, IEEE Computer Society, pp. 746–751.
She, K., Bebis, G., Gu, H. and Miller, R., 2004. Vehicle tracking using on-line fusion of color and shape features. In: International IEEE Conference on Intelligent Transportation Systems, pp. 731– 736.
Stilla, U., Michaelsen, E., Soergel, U., Hinz, S. and Ender, J., 2004. Airborne monitoring of vehicle activity in urban areas. In: M. Altan (ed.), International Archives of Photogrammetry, Remote Sensing and Spatial Information Sciences, Vol. 34(B3), pp. 973–979.
Sun, Z., Bebis, G. and Miller, R., 2006. On-road vehicle de-tection: A review. IEEE Transactions on Pattern Analysis and Machine Intelligence 28(5), pp. 694–711.
Tuermer, S., Leitloff, J., Reinartz, P. and Stilla, U., 2010. Au-tomatic vehicle detection in aerial image sequences of urban ar-eas using 3d hog features. In: International Archives of Pho-togrammetry, Remote Sensing and the Spatial Information Sci-ences, Vol. XXXVIII(3B), Paris, France, pp. 50–54.
Viola, P. and Jones, M., 2001. Rapid object detection using a boosted cascade of simple features. In: Conference on Computer Vision and Pattern Recognition (CVPR) 2001, Vol. 1, IEEE Com-puter Society, pp. 511–518.
Zhao, T. and Nevatia, R., 2003. Car detection in low resolution aerial image. Image and Vision Computing 21(8), pp. 693–703.