NATIONWIDE HYBRID CHANGE DETECTION OF BUILDINGS
V. Hron a, *, L. Halounova a
aDepartment of Geomatics, Faculty of Civil Engineering, Czech Technical University in Prague, Thákurova 7, 166 29 Prague 6, Czech Republic - (vojtech.hron, lena.halounova)@fsv.cvut.cz
Commission VII, WG VII/5
KEY WORDS: Buildings, Change Detection, Pixel-based, Object-based, Aerial Photographs, Open-source
ABSTRACT:
The Fundamental Base of Geographic Data of the Czech Republic (hereinafter FBGD) is a national 2D geodatabase at a 1:10,000 scale with more than 100 geographic objects. This paper describes the design of the permanent updating mechanism of buildings in FBGD. The proposed procedure belongs to the category of hybrid change detection (HCD) techniques which combine pixel-based and object-based evaluation. The main sources of information for HCD are cadastral information and bi-temporal vertical digital aerial photographs. These photographs have great information potential because they contain multispectral, position and also elevation information. Elevation information represents a digital surface model (DSM) which can be obtained using the image matching technique. Pixel-based evaluation of bi-temporal DSMs enables fast localization of places with potential building changes. These coarse results are subsequently classified through the object-based image analysis (OBIA) using spectral, textural and contextual features and GIS tools. The advantage of the two-stage evaluation is the pre-selection of locations where image segmentation (a computationally demanding part of OBIA) is performed. It is not necessary to apply image segmentation to the entire scene, but only to the surroundings of detected changes, which contributes to significantly faster processing and lower hardware requirements. The created technology is based on open-source software solutions that allow easy portability on multiple computers and parallelization of processing. This leads to significant savings of financial resources which can be expended on the further development of FBGD.
* Corresponding author
1. INTRODUCTION
1.1 Motivation
Many countries have national spatial datasets which operate in 2D or even already in 3D/4D form. These datasets are used by municipalities, universities, public utilities and private sector entities for various tasks (e.g. design and planning purposes, environmental monitoring, risk management, etc.). The importance of such geoinformation is therefore considerable. Administrators of national spatial databases are responsible for their future development. The Czech Office for Surveying, Mapping and Cadastre (COSMC), which administers FBGD, decided to increase the accuracy of selected FBGD objects to a scale of 1:5,000. This refinement will allow the use of FBGD for new high-precision applications (generation of 3D building models, infrastructure planning, etc.). Of crucial importance for these new applications are accurate outlines of buildings, which represent one category of updated objects. The increase of positional accuracy also brings greater demands on the update procedures. Only consistent and up-to-date datasets have a real value for geospatial users. Update procedure can no longer be solved using current technologies based mainly on visual interpretation of biennial digital aerial photographs (DAP). Manual work is extremely time-consuming and therefore expensive. Now we are facing the problem that we can capture DAP faster (every two years) than we can analyze them (3-5 years). The interpretation of information from DAP comes with a delay while the reality may already be altered.
1.2 Cooperation
COSMC decided to solve this issue in cooperation with the Czech Technical University in Prague, Faculty of Civil Engineering, Department of Geomatics. This paper is the preliminary result of their cooperation and represents the design of permanent updating mechanism of buildings in FBGD. The presented solution is a real application that has been already tested on several big datasets with the total area of about 20 km2. Obtained experimental results proved a great potential of this approach for the nationwide use.
1.3 Organization of this Contribution
This paper is organized as follows. Section 2 gives a short review of some building change detection methods using high-resolution images. Biennial DAP and another used data are introduced in Section 3. Section 4 is an essential part of this contribution and describes the proposed bi-temporal hybrid change detection (HCD) method which combines pixel-based and object-based evaluation techniques. Experimental results and their analysis are discussed in Section 5. Section 6 concludes this paper.
2. PREVIOUS STUDIES
2.1 Change Detection
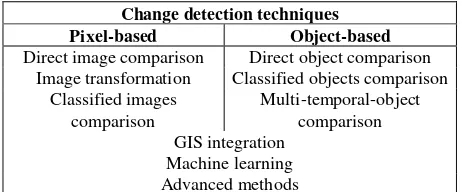
phenomenon by observing it at different times” (Singh, 1989). In the available literature, sources can be found with infinite number of CD techniques and strategies. The first overview in this field was probably created by Singh (1989) and the last one by Hussain et al. (2013). The latter (Hussain et al., 2013) cited 224 previous publications related to this topic. According to this comprehensive overview of available studies, three main CD techniques exist: pixel-based, object-based and spatial data mining. The first two traditional strategies can be further divided into many sub-classes (Tab. 1). It is interesting that some of the approaches utilized in pixel-based techniques are also applicable in object-based techniques. Therefore, they are listed as common for both techniques.
Change detection techniques Pixel-based Object-based Direct image comparison Direct object comparison
Image transformation Classified objects comparison two and more techniques (mostly pixel-based and object-based approaches) to maximize their advantages and at the same time minimize their disadvantages. HCD can be categorized as a procedure-based or result-based process. Procedure-based approach uses different CD methods in different detection phases. The final CD procedure is composed from many methods which were combined together. On the other side, result-based approach uses different CD methods separately and then analyses their results. The final CD procedure is composed of many parallel methods and only their results are combined.
2.2.1 Hybrid Change Detection Using Satellite Images: The following studies use a combination of different CD methods and can be designated as HCD techniques. The combination of direct image comparison and image transformation (principal component analysis) methods using high-resolution Ikonos images was used in (Al-Khudhairy et al., 2005). Pixel-based CD results were then analysed through an object-oriented post-classification in the eCognition software (Trimble). HCD combines pixel-based and object-based (Definiens Professional software) analysis of Landsat TM/ETM+ images which was introduced in (McDermid et al., 2008). The aim of this study was the forest thematic map-update which was tested on three 13x13 km2 sub-areas in Canada. Other authors (Niemeyer et al., 2008) proposed an unsupervised CD and classification procedure based on object features extracted from QuickBird images. They applied multivariate alteration detection, accompanied by the maximum autocorrelation factor transformation to detect changes. The changed objects were then classified using the fuzzy maximum likelihood estimation. Another use of QuickBird images is demonstrated in (Hofmann et al., 2008). The authors presented the detection of informal settlements from QuickBird images using an object-based approach. They introduced simple (a fuzzy-logic rule base evaluation) and iterative (a knowledge based region growing) methods to classify generated segments. This study is based on (Hofmann, 2001) which is dedicated to
the same topic, but uses the IKONOS images. The hierarchical image segmentation approach of multitemporal Landsat TM and ETM images was adopted by (Gamanya et al., 2009). The aim of this study is to perform CD by using fuzzy logic classification implemented in Definiens Professional software. The analysed area is approximately 900 km2. The classification method used in this research was developed and applied to their earlier work by the same authors (Gamanya et al., 2007). Automatic change detection of buildings in urban environment from VHSR satellite images using existing geodatabase was presented in (Bouziani et al., 2010). The proposed solution is based on the segmentation of Ikonos and QuickBird images. Generated segments are subsequently analyzed using a knowledge base which was created by using the GIS database and prior knowledge. The test area of unknown size is composed from two sub-areas covering parts of different cities (Canada, Sherbrooke and Morocco, Rabat). The determination of segmentation parameters, classification thresholds and object relations were obtained by use of geodatabases. This study builds on previous preliminary work of the same authors (Bouziani et al., 2007). The other group of authors (Huang et al., 2014) presented the urban building change detection from multitemporal QuickBird images based on the morphological building index (MBI). MBI describes a relationship between the spectral-spatial characteristics of buildings and the morphological operators. MBI is therefore able to automatically detect buildings from high-resolution images. This work builds on the previous works (Huang and Zhang, 2011; Huang and Zhang, 2012) which were dealing with the usage of MBI as well.
The above-mentioned scientific papers use satellite images of various type and resolution as a source of new information for the update process. Using satellite images has its justification for extensive and distant areas. However, national map agencies in many countries regularly collect DAP which usually offer a much better spatial resolution than satellite images. Especially these organizations should be the main potential users of modern HCD techniques for the purpose of updating their databases. DAP are a great source of information to monitor the state of small and detailed objects (such as buildings or even building parts). Subsequent studies are therefore devoted to the use of DAP for the updates of buildings in national databases/maps in Denmark, Germany, Finland, Taiwan and Switzerland.
2.2.2 Hybrid Change Detection Using Aerial Images: One of the early works, which can be considered as a HCD application using DAP, dedicated to the building update is (Knudsen and Olsen, 2003). In this study, a mono-image CD method based on a supervised Mahalanobis classification using existing vector objects for the determination of training areas in the specification of spectral characteristics of the building class was designed. RGB and CIR aerial photos were used as sources of information to update buildings in the Danish National Topographic Map Database (TOP10DK). Four test areas cover in total 0.3 km2. Building detection is based primarily on the spectral characteristics of building roofs without the use of DSM. The result is a binary raster change map which distinguishes only between no change and change indications.
and 9.1 km2). The classification approach of supervised maximum likelihood with training areas derived automatically from ATKIS was used. The approach subdivided all objects into four land-use classes: forest, settlement, green areas and water.
The detection of buildings and changes in buildings by (Matikainen et al., 2010) is based on use of airborne laser scanner (ALS) data and multispectral DAP. The involved method detects buildings from new RS data and compares the results to existing building vectors of the Topographic Database which should be updated. The study area is about 5 km2 (Finland, Espoo). The building detection method consists of segmentation of DSM (created from ALS data) by the Definiens software. The created segments are further classified in Matlab using the following features: NDVI, mean slope, Haralic’s GLCM homogeneity calculated from the maximum DSM and GLCM homogeneity calculated from the NIR band of DAP. The change detection method simply uses the overlap analysis (approach). The solution presented in this article is an improved version of those presented in (Matikainen et al., 2003; Matikainen et al., 2004).
Multi-type change detection of buildings using ALS data, multispectral DAP and existing building models was presented in (Chen et al., 2012). The described method detects buildings from new RS data and compares the results to existing 3D building models (non-specified database) which should be updated. The test area in this study is 2 km2 (Taiwan, Hsinchu). HCD in this work is based on evaluation of four attributes: height, percentage of changed points, changed area and NDVI. Four different methods for the generation of new building regions were compared side by side. The TIN method was determined as the best solution to generate building regions from ALS data in comparison to: angle, TIN-constrained angle and maximum & minimum methods.
Object based three-dimensional building change detection framework was introduced in (Qin et al., 2015). Objects with homogenous spectrum and height are generated through synergic mean-shift segmentation method using orthophoto and DSM. The generated segments are subsequently classified as buildings with a hybrid decision tree analysis and SVM approach (supervised classification). CD is performed by the evaluation of overlapping building segments using adaptive change indicator strategy. This work used scanned aerial stereo images provided by SWISSTOPO. SWISSTOPO is the official name for the Swiss Federal Office of Topography. Stereo aerial images with GSD of 38 cm from 3 time periods (1994, 2002 perhaps the majority of studies) can be designated as using the HCD technique. It is logical. The use of sophisticated solutions combining several CD methods is necessary to achieve a high rate of success. Furthermore, most of the presented studies are based on HCD with the procedure-based approach. Studies combine different CD methods in different detection phases in order to achieve the best solutions. On the other hand, HCD in combination with the result-based approach is not very suitable from the viewpoint of processing efficiency. Multiple
processing of huge amount of RS data is time consuming and therefore uneconomical.
Studies using satellite images (Al-Khudhairy et al., 2005; McDermid et al., 2008; Niemeyer et al., 2008; Hofmann et al., 2008; Gamanya et al., 2009; Bouziani et al., 2010; Huang et al., 2014) did not use DSM for CD. CD was based solely on the analysis of image data. Spectral information containing red and near-infrared bands is easy to use to distinguish vegetation areas from man-made objects (Chen et al., 2012). In the case of buildings, this approach is not sufficient. Spectral values of building roofs are very similar to other man-made objects (e.g. roads). This problem can be solved by using an object-oriented approach and geometric and contextual features. Small-sized parking lots and courtyards adjacent to houses have similar spectral but also geometric and even contextual features as buildings (Bouziani et al., 2010). Object-oriented approach does not provide a satisfactory solution in these cases and leads to false detection of changes. Other evaluation problems can be caused by different lighting conditions. Buildings with spatially complex roof shapes are exactly such cases. Shadow formation and differences in seasonal, sensor and solar conditions at the moments of their acquisition can cause false signals or make detection of real changes impossible (Al-Khudhairy et al., 2005). Most of these issues can be eliminated by using elevation information. Two epoch’s elevation information can be used for the generation of the height difference map. Change detection through height difference is easier than analysing 2D shape difference (Chen et al., 2012). Moreover, as a prior information source of changes, the height differences enable the reduction of false indication of changes (Qin et al., 2015).
A combination of image and elevation data can be used as the best source of information for building change detection. Currently, the following image and elevation data combinations are possible: satellite image and satellite DSM, satellite image and ALS, aerial image and ALS, aerial image and aerial DSM. Combination of image (satellite or aerial) and ALS data brings specific problems that correspond to the essence of both technologies. ALS data is usually acquired during the dormancy period when the laser beam can penetrate through the vegetation to the earth's surface. However, the image data are acquired mainly during the summer season when shadows are short (the Sun is high above the horizon) and the vegetation is easily distinguishable from man-made objects (the difference in reflectance of red and infrared channel by chlorophyll). In the case of parallel data acquisition, the advantage of one type of data is reduced in favor of the other type of data. Furthermore, not all air carriers allow the installation of an aerial camera and a laser scanner at the same time (in case of combination of aerial image and ALS). On the other hand, acquisition of data at different times (Matikainen et al., 2010) leads to another problem. The acquired data captures different reality because the Earth's surface is constantly changing. Furthermore, double data acquisition is more expensive because it is necessary to perform two separate flights (in case of combination of aerial image and ALS).
national mapping agencies). DAP provide the same unique source of RS information as satellite images but are more suitable for detailed building change identification (e.g. building reconstructions) because they have higher spatial resolution than satellite images. Unfortunately, the true potential of DAP is not usually fully exploited. Therefore, this study focuses on the use of DAP and DSM (derived from DAP) for updating buildings in the Czech national geodatabase FBGD.
3. DATA
3.1 Study Area
Study area is composed of four different locations which correspond to 4 map sheets of the State map at 1:5000. Each map sheet has an area of 5 km2. The total area is 20 km2 and can be divided into two types of land cover (suburb and village). Suburb areas cover an area of 10 km2 and contain about 4000 buildings. Villages cover an area of 10 km2 and contain about 1400 buildings.
3.2 Digital Aerial Photographs
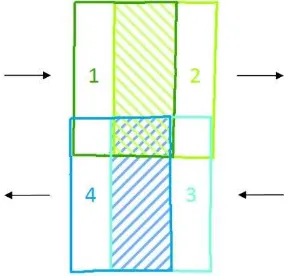
Aerial photography belongs to the traditional RS methods. The current acquisition of DAP within Czech Republic is performed every two years. Data collection has been performed by digital aerial cameras since 2010. These cameras from Microsoft acquire images by the central projection in the panchromatic (PAN), visible (R, G, B) and near-infrared (NIR) bands. Acquisition parameters are selected with regard to the main purpose of DAP. DAP are used for creating a seamless orthophoto mosaic with the pixel size of 0.25 meters (GSD is approx. 20 cm) and for the possibility to perform stereo-photogrammetric evaluation of any place in the Czech Republic (for any location at least one stereo-pair of DAP is available). DAP are taken with approximately 60% forward overlaps (overlap in the flight line) and 25% side overlaps (overlap between flight lines). The situation is shown in Fig. 1.
Figure 1. Forward and side overlaps of DAP
For this study we used DAP from 2012 and 2014. DAP were collected by Microsoft UltraCam XP camera. The average flight height above the ground was 3.5 km with the resulting GSD of about 20 cm/pix (f = 100.5 mm).
3.3 Map Data
3.3.1 Buildings: The new physical-geographic building layer of FBGD is based on the revised cadastral map. Revision of cadastral map consisted in verification and potential manual modification and completion using the latest remote sensing
data (DAP and also ALS). The aim was to catch the reality captured in DAP. The maximum permitted positional deviation of building outlines from the reality captured in DAPs is 2 m for visible building external walls (3 m for the building roof edges). The new minimum size of buildings in FBGD is 16 m2.
3.3.2 Additional used types of objects: FBGD contains more than 100 types of geographic objects. Many types of these objects can be used to reach a better understanding of the analysed area. A better understanding leads to fewer false indications and a higher correctness of HCD. The additional used types of objects from FBGD are: road network, railway network, parking lots, railway yards and industrial areas (e.g. wood processing, warehouse, hangar). These objects represent the means of transport or other objects that change its position in time and can therefore be identified as changes. These non-building changes are hard to distinguish from non-building changes using height, spectral and textural features. Contextual information contained in the geodatabase provides principal knowledge to identify these changes. Unfortunately, the selected types of objects are not of the same geometric type (e.g. road network - lines, parking lots - polygons). For the purposes of simplification, it is also appropriate to unify geometric types. Line objects have been converted to polygon objects using a buffer (spatial extent) with the size corresponding to the route importance. Furthermore, the height extent (threshold) was introduced to avoid incorrect filtration indications belonging to multi-floor buildings. The maximum threshold 5 meters enables the detection of buildings of two-storeys and higher. A complete overview of the additional used types of objects is shown in Tab. 2.
Object name Geometric type
Spatial extent
Height extent
Highway line 3.5 m 4.5 m
Road line 3 m 4.5 m
Street line 2.5 m 4.5 m
Railway line line 1.5 m 5 m
Railway spur line 1.5 m 5 m
Parking lot polygon 0 m 4.5 m
Railway yard polygon 0 m 5 m
Industrial area polygon 0 m 5 m
Table 2. Additional used types of objects from FBGD
4. METHOD
4.1 New Update Model
FBGD buildings are currently updated with the use of cadastral map (twice a year) and DAP (every 3-5 years). Cadastral map (CM) provides valuable information about new and demolished buildings. Unfortunately, the buildings registered beyond the content of CM or those which have been significantly modified (subchapter 3.3.1) can be updated only on the basis of aerial images (RS data in general). Update on the basis of aerial images is carried out every 3-5 years due to considerable time demands.
aerial images. This validation allows us to use the new update model where the comparison of old images (DAPepoch1) and new images (DAPepoch2) is used instead of the comparison of outdated database (GDBepoch1) with new images (DAPepoch2). In our case, aerial images from two epochs are analyzed using HCD and detected differences are used to update the geodatabase (GDBepoch2). This model is marked by the gray background color in Fig. 2.
Figure 2. Permanent update model
The main advantage of this approach is that it prevents many problems connected with CD between outdated geodatabases and RS data. The building footprints in the geodatabase are typically generalized (less details, slight misalignment) and do not conform to the reality captured in DAP. Besides, buildings identified from remotely sensed data usually seem to be larger than they are registered in the geodatabase (roof overlaps, adjacent porches, etc.). These problems were mentioned in (Matikainen et al., 2010; Chen et al., 2012).
4.2 Hybrid Change Detection
The method presented in this paper is an improved version of that presented in (Hron and Halounova, 2015). The previous version of this method distinguished only between new and demolished buildings. The improved version distinguishes between new and demolished buildings and also two types of reconstructions (extension or reduction of the number of floors). The new method recognizes in total four types of changes.
Another significant change is the division of CD into two processing stages. The first processing stage consists in the pixel-based analysis, which is fast and efficient. This analysis leads to the identification of potential building changes. The second processing stage is a detailed analysis of found potential building changes using an object-oriented approach in order to filter out false indications. The following description of the designed HCD technique is divided into two parts corresponding to each stage evaluation. In fact, both changes present in detail gray colored cells from the previous Fig. 2.
4.3 First Stage Evaluation
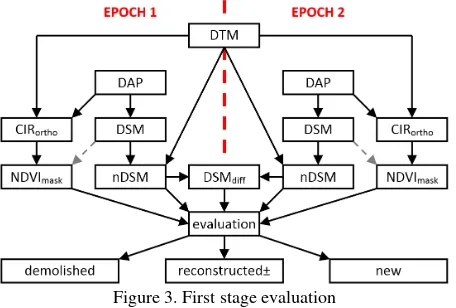
The detailed diagram below (Fig. 3) shows the first stage processing. The first stage processing consists of the following steps.
Figure 3. First stage evaluation
4.3.1 Input data: Input data for the first stage evaluation are multispectral DAP from two epochs and DTM. In this study we used the Digital Terrain Model of the Czech Republic of the 4th generation (DTM 4G) as DTM which was created from ALS data. DTM 4G is provided in a digital form as heights of discrete points in a regular grid (5 x 5 m) with a total standard error of height 0.3 m in bare terrain and 1 m in forested terrain.
4.3.2 Generation of digital surface model (DSM): DAP are used for the generation of point clouds through the image matching technique. The density of generated point clouds (DSM) is 4 points/m2. In the previous version of processing, MATCH-T software from Trimble was used for the generation of DSM. The new version of processing uses non-commercial French software MicMac (Multi Images Correspondances par Méthodes Automatiques de Corrélation).
4.3.3 Normalization of digital surface model (nDSM): Normalized DSM is DSM after deduction of DTM. DSM shows the relative height above the ground for all objects on the Earth's surface. DTM 4G was used for the normalization of DSM.
4.3.4 Calculation of the differential digital surface model (DSMdiff): Calculation of the differential digital surface model
is a process in which nDSMs (alternatively DSMs) from two different times (epoch 1 and 2) are subtracted from each other.
4.3.5 Calculation of the normalized differential vegetation index mask (NDVImask): There are two possible ways how to
obtain the NDVI mask. One solution is to create color-infrared othophotomap (CIRortho) from multispectral DAP (combination of NIR, red and green bands) and DTM. Subsequently, the NDVI mask can be calculated from CIR orthophotomap. This method was used in our case. The other solution is to use color-infrared DAP for the generation of DSM. Afterwards, the NDVI mask can be calculated from colored point clouds. This solution is possible only in the case that the used image matching software supports colorization of point clouds.
values (unchanged, demolished, reconstructedminus, reconstructedplus, new).
EPOCH 1 DSMdiff EPOCH 2 BUILDING
nDSM ≥ 2 m - nDSM ≥ 0 m demolished nDSM ≥ 2 m ≤ -2 m nDSM ≈ 0 m demolished nDSM ≥ 4 m ≤ -2 m nDSM ≥ 2 m reconstructedminus nDSM ≥ 2 m ≥ +2 m nDSM ≥ 4 m reconstructedplus nDSM ≈ 0 m ≥ +2 m nDSM ≥ 2 m new
nDSM ≥ 0 m - nDSM ≥ 2 m new
comment: positive NDVI, negative NDVI Table 3. Decision table for the first stage evaluation
4.3.7 Post-processing: Each class is exported to a separate raster file. This procedure creates binary images. Binary images are then simplified through processing. The post-processing is performed through binary morphological operations of closing and opening using a circular mask with a diameter of 2 m (closing) and 3 m (opening).
4.4 Second Stage Evaluation
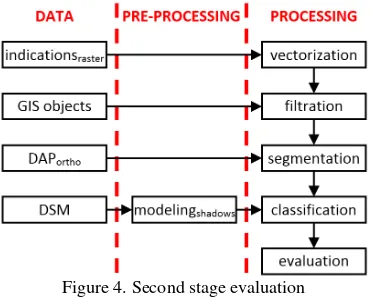
The following diagram represents the second stage evaluation. The second stage processing is object-oriented and develops the processing presented in the previous chapter 4.3. All processing sub-steps are described below. GRASS GIS was used to solve the majority of tasks.
Figure 4. Second stage evaluation
4.4.1 Input data: Input data for the second stage evaluation consist of indications in raster form (indicationsraster), GIS objects, orthorectified DAP (DAPortho) and DSM.
4.4.2 Vectorization: Indications in raster form represent all potential building changes from step 4.3.7. Indications are converted into vector form by using GIS. Further, we work with converted indications as with planar objects.
4.4.3 Filtration: Filtration is performed in three steps. First, objects are filtered according to their area. Objects smaller than 16 m2 are excluded from the subsequent processing. The determined value corresponds to the minimum size of buildings registered in FBGD. The second filtration step removes all objects which are located within the specific spatial and height extent corresponding to additional used types of FBGD objects. The spatial extent is defined in subchapter 3.3.2. The third filtration step is related to the existence of buildings in FBGD. Objects (indications) are used to update buildings in FBGD. In the case that some indication represents a potential new building but the building already exists in the database, it is appropriate to filter out such indication. The same approach is
applied to the indication of a demolished building that doesn't exist in FBGD. These situations can happen because FBGD is updated using the cadastral map twice per year. Prior to the comparison of indications with the database objects, indications are clipped (negative buffer) by about 1.49 m. This value corresponds to the morphological mask of opening of 3 meter size. Clipped indications are then compared to database objects. For filtering out, new building indications must 100% overlap with database buildings and demolished or reconstructed building indications must not overlap with database buildings.
4.4.4 Segmentation: Minimum bounding boxes (MBB) are created around filtered objects (indications). Each MBB corresponds to the size of the indication and it is multiplied by 1.5 times the shadow length. The shadow length is calculated from the knowledge of the highest point in the indication (DSM) and the acquisition time of DAP. This ensures that MBB contains the indication and the closest surroundings with the adjacent shadow. MBB is used to define part of DAP which will be subsequently segmented. Image segmentation does not aim to create objects (groups of pixels) that perfectly represent real objects (houses, roads, etc.). The aim is to merge pixels with similar spectral characteristics. The region growing and merging algorithms implemented in the i.segment (GRASS GIS) module is used for image segmentation
4.4.5 Classification: DSM calculated from DAP is not sufficiently precise in order to be used as the only source of information for HCD. Indication based on DSM analysis must be verified. Elevated objects (such as buildings) should cast shadows in the direction of sunshine. These shadows can be identified by OBIA as contextual information and help us to verify the DSM based indications. However, classification of shadows from DAP can be complicated. Spectral characteristic of shadows depends on the overshadowed objects (asphalt, pavement, grass, etc.). Therefore, we try to identify adjacent shadows by using additional information. The modelled shadow from DSM (GRASS GIS) represents additional information for us. For the modelling we need to know the Sun position at the moment of the photograph acquisition. The model of shadows is used to classify image objects. It may happen that the shadow cannot be identified because there is another elevated object in the direction of sunshine (obstacle). In that case, spectral features in both epochs are analyzed. The evaluation is described in the following subsection.
change (new or demolished building). Demolished building should not cast a shadow in the epoch 2, while a new building should. All indications evaluated as FALSE are excluded. All other indications (TRUE and undetermined) represent the final vector change map.
The change of shadows and spectral features is small in case of reconstructed buildings. These indications do not enter into the final evaluation. All reconstructed buildings that have passed through the previous filtration (subchapter 4.4.3) are intended for manual control and are also part of the final vector change map.
Figure 5. Evaluation of new and demolished buildings
5. EXPERIMENT
5.1 Results
The created HCD technique was tested on a large scale area (chapter 3.1). The time difference between epoch 1 and 2 is only two years and therefore the amount of identified changes is not that significant. This was confirmed despite the fact that the suburbs and villages belong to the fastest growing settlement types in the Czech Republic. The following Tab. 4 and Tab. 5 show the detection results for new (New) and demolished (Dem.) buildings. Evaluation was carried out in comparison with the human visual inspection of changes (Real). All identified changes (SUM) were analysed and divided into correct (True) and incorrect (False). Subsequently, correctness (Correct.) and completeness (Complet.) were calculated. Correctness describes the ratio between the true and all indications. Completeness shows the ratio between true indications and real changes. Evaluation of reconstructed buildings was not performed. The visual identification of reconstructions is extremely demanding and there is no other available source of information which can be used for the evaluation.
Suburbs
Type Real True False SUM Correct. Complet.
New 39 34 4 38 89 % 87 %
Dem. 28 24 1 25 96 % 86 %
Table 4. Change detection results for suburbs
Villages
Type Real True False SUM Correct. Complet.
New 54 50 3 53 94 % 94 %
Dem. 11 10 0 10 100 % 91 %
Table 5. Change detection results for villages
The created method achieved very good final values for suburbs and excellent values for villages. The average completeness is 89.5 % and average correctness reaches almost 95 %.
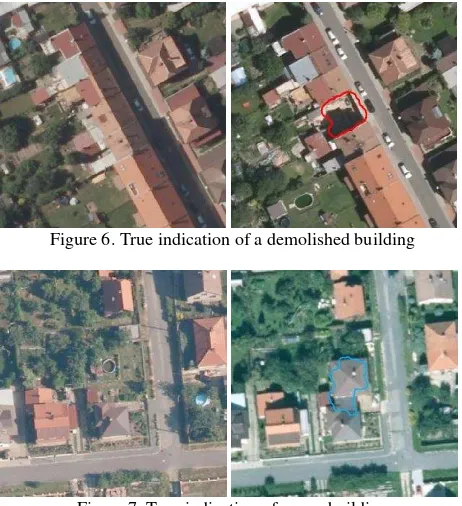
Figure 6. True indication of a demolished building
Figure 7. True indication of a new building
5.2 Evaluation and Discussion
In comparison with the previous work (Hron and Halounová, 2015), similar completeness rate and slightly higher correctness rate was identified for villages. In a general perspective, the introduced solution can be described as a safe solution with a very low number of false indications due to the sophisticated filtration. During the visual inspection, it was found that the majority of unidentified changes (which are the cause of the lower rate of completeness) are located in industrial areas. Unidentified changes in these areas are related to single storey buildings and sheds that were removed in the filtration process (subchapter 4.4.3). These low and usually small buildings have often only temporary existence and therefore have a low priority for the updating process. Filtration in these areas is complicated and acceptable information loss cannot be considered as the reason for change of the evaluation strategy.
6. CONCLUSION
ACKNOWLEDGEMENTS
This contribution was supported by the International Visegrad Fund through the Visegrad–Taiwan Scholarship number: 51590013.
REFERENCES
Al-Khudhairy, D.H.A., Caravaggi, I., Giada, S., 2005. Structural damage assessments from Ikonos data using change detection, object-oriented segmentation, and classification techniques. Photogrammetric Engineering & Remote Sensing, Vol. 71(7), pp. 825–837.
Bouziani, M., Goïta, K., He, D.C., 2007. Change detection of buildings in urban environment from high spatial resolution satellite images using existing cartographic data and prior knowledge. In: IEEE International Geoscience and Remote
Sensing Symposium, Barcelona, Spain, pp. 2581-2584.
Bouziani, M., Goïta, K., He, D.C., 2010. Automatic change detection of buildings in urban environment from very high spatial resolution images using existing geodatabase and prior knowledge. ISPRS Journal of Photogrammetry and Remote
Sensing, 65, pp. 143-153.
Chen, L.C., Huang, C.Y., Teo, T.A., 2012. Multi-type change detection of building models by integrating spatial and spectral information. International Journal of Remote Sensing, Vol. 33(6), pp. 1655–1681.
Gamanya, R., De Maeyer, P., De Dapper, M., 2007. An automated satellite image classification design using object-oriented segmentation algorithms: A move towards standardization. Expert Systems with Applications, 32, pp. 616-624.
Gamanya, R., De Maeyer, P., De Dapper, M., 2009. Object-oriented change detection for the city of Harare, Zimbabwe.
Expert Systems with Applications, 36, pp. 571–588.
Hofmann P., 2001. Detecting Informal Settlements from IKONOS Image Data Using Methods of Object Oriented Image Analysis – An Example from Cape Town (South Africa). In: Jürgens, C. (Ed.), Remote Sensing of Urban Areas / Fernerkundung in urbanen Räumen. Regensburg: University Regensburg, Germany, 2001, pp. 107-118.
Hofmann, P., Strobl, J., Blaschke, T., Kux, H., 2008. Detecting informal settlements from QuickBird data in Rio de Janeiro using an object-based approach. In: Blaschke, T., Lang, S., Hay, G.J. (Eds.), Object-Based Image Analysis: Spatial Concepts for Knowledge-Driven Remote Sensing Applications. Springer-Verlag, Berlin Heidelberg, pp. 531–553.
Hron, V., Halounova, L., 2015. Use of aerial images for regular updates of buildings in the Fundamental Base of Geographic Data of the Czech Republic. In: The ISPRS Archives of Photogrammetry, Remote Sensing and Spatial Information
Sciences, Munich, Germany, Vol. XL-3/W2, pp. 73-79.
Huang, X., Zhang, L., 2011. A multidirectional and multiscale morphological index for automatic building extraction from multispectral GeoEye-1 imagery. Photogrammetric Engineering
& Remote Sensing, 77(7), pp. 721-732.
Huang, X., Zhang, L., 2012. Morphological building/shadow index for building extraction from high-resolution imagery over urban areas. IEEE Journal of Selected Topics in Applied Earth
Observations and Remote Sensing, 5(1), pp. 161–172.
Huang, X., Zhang, L., Zhu, T., 2014. Building Change Detection From Multitemporal High-Resolution Remotely Sensed Images Based on a Morphological Building Index. IEEE Journal of Selected Topics in Applied Earth Observations and
Remote Sensing, 7(1), pp. 105-115.
Hussain, M., Chen, D., Cheng, A., Wei, H., Stanley, D., 2013. Change detection from remotely sensed images: From pixel-based to object-pixel-based approaches. ISPRS Journal of
Photogrammetry and Remote Sensing, 80, pp. 91-106.
Knudsen, T., Olsen, B.P., 2003. Automated change detection for updates of digital map databases. Photogrammetric
Engineering & Remote Sensing, 69(11), pp. 1289-1296.
Niemeyer, I., Marpu, P.R., Nussbaum, S., 2008. Change detection using object features. In: Blaschke, T., Lang, S., Hay, G.J. (Eds.), Object-Based Image Analysis: Spatial Concepts for Knowledge-Driven Remote Sensing Applications. Springer-Verlag, Berlin Heidelberg, pp. 185–201.
Matikainen, L., Hyyppä, J., Hyyppä, H., 2003. Automatic detection of buildings from laser scanner data for map updating.
In: The ISPRS Archives of Photogrammetry, Remote Sensing
and Spatial Information Sciences, Dresden, Germany, Vol.
XXXIV, Part 3/W13, pp. 218-224.
Matikainen, L., Hyyppä, J., Kaartinen, H., 2004. Automatic detection of changes from laser scanner and aerial image data for updating building maps. In: The ISPRS Archives of Photogrammetry, Remote Sensing and Spatial Information
Sciences, Istanbul, Turkey, Vol. XXXV, Part B2, pp. 434-439.
Matikainen, L., Hyyppä, J., Ahokas, E., Markelin, L., Kaartinen, H., 2010. Automatic Detection of Buildings and Changes in Buildings for Updating of Maps. Remote Sensing, 2(5), pp. 1217-1248.
McDermid, G.J., Linke, J., Pape, A.D., Laskin, D.N., McLane, A.J., Franklin, S.E., 2008. Object-based approaches to change analysis and thematic map update: challenges and limitations.
Canadian Journal of Remote Sensing, 34(5), pp. 462-466.
Qin, R., Huang, X., Gruen, A., Schmitt, G., 2015. Object-Based 3-D Building Change Detection on Multitemporal Stereo Images. IEEE Journal of Selected Topics in Applied Earth
Observations and Remote Sensing, 8(5), pp. 2125-2137.
Singh, A., 1989. Review Article Digital change detection techniques using remotely-sensed data. International Journal of
Remote Sensing, 10(6), pp. 989-1003.
Walter, V., 2004. Object-based classification of remote sensing data for change detection. ISPRS Journal of Photogrammetry