OBJECT-BASED FOREST COVER MONITORING USING GAOFEN-2 HIGH
RESOLUTION SATELLITE IMAGES
S.M. Lia, *, Z.Y. Lia, E.X. Chena, Q.W. Liua a
Institute of Forest Resources Information Techniques, Chinese Academy of Forestry Beijing, China (lism,lizy,chenerx,liuqw)@caf.ac.cn
Commission VIII, WG VIII/
KEY WORDS: Forest Cover Monitoring, Segmentation, Classification, Gaofen-2, High Resolution Satellite Images
ABSTRACT:
Forest cover monitoring is an important part of forest management in local or regional area. The structure and tones of forest can be identified in high spatial remote sensing images. When forests cover change, the spectral characteristics of forests is also changed. In this paper a method on object-based forest cover monitoring with data transformation from time series of high resolution images is put forward. First the NDVI difference image and the composite of PC3,PC4, PC5 of the stacked 8 layers of time series of high resolution satellites are segmented into homogeneous objects. With development of the object-based ruleset classification system, the spatial extent of deforestation and afforestation can be identified over time across the landscape. Finally the change accuracy is achieved with reference data.
* Corresponding author
1. INTRODUCTION
Forests provide important resources and ecosystem services that are essential for human well-being, including timber and non-timber forest product provision, watershed protection, habitat for biodiversity, and recreational amenities. Due to the recognized importance of forest ecosystem services, forest cover monitoring is important to studies concerning habitat and biodiversity, management of forest resources, human livelihoods and biogeochemical and climatic cycles. Because the forest resource is renewable, it is always in a dynamic change for a long time. Traditional field-based measures for assessing forest recovery and habitat quality can be labour intensive and costly. As we know, remote sensing technology seems to be a powerful tool to monitor the change of forest cover for its large areas’ cover, synthetic views and frequent revisit (Li et al, 2011). Previously, coarse or middle resolution satellite images were used for regional forest cover monitoring and forest clearing of large area could be identified by using MODIS or Landsat data (Huang et al, 2008; Hammer et al, 2014). For the limitation of optical sensor techniques, small block cutting or thinning is not easily found, especially for the fast growing tree species in tropical or subtropical areas. Because high spatial resolution satellite sensors have only been in commercial operation since 1999, change detection using high spatial resolution imagery has been constrained to the use of aerial photographs.
Since last decade, more and more high spatial resolution satellite sensors are available, and small scale forest cover changes could be detected. But the acquisition of satellite-based high spatial resolution images in a temporal sequence has been unavailable due to limited image archiving, difficulties in acquiring cloud-free imagery, and prohibitive costs. Other issues, such as viewing geometry and illumination conditions also complicate the use of high spatial resolution satellite imagery for change detection. Fortunately, Gaofen-2 Satellite, the first sub-meter resolution civil satellite of China which, was launched in August 19, 2014 (Gaofen-2, 2015), and provide the
potential capability for monitoring forest cover change with less financial costs. In tropical/subtropical area, fast growing forests could be restored in few years and to be dense forests after harvesting. Studies about forest cover changes and quantifying tropical/subtropical deforestation and afforestation using time-series high spatial resolution satellite datasets within one or two years are helpful for local plan of forest management and social economic development.
The objective of the study is to monitor the forest cover change in tropical/subtropical areas and identify the area and location of deforestation and afforestation by integrating the pixel-based and object-based change detection methods with consecutive time series high spatial resolution Gaofen-2 satellite images.
2. STUDY SITE AND DATA 2.1 Study Site
According to the 8th Chinese National Forest Inventory (CNFI) report (2009-2013), forest area in Guangxi autonomous region ranks 6th in China. The area of forests in Guangxi is about 13.427 million ha, and plantation forest is 6.3452 million ha. Guangxi is the important southern fast-growing and high yielding production forest base. Eucalyptus grandis×E. urophylla, Pinus massoniana, Chinese Fir Plantation are three fast-growing and high yielding production forests in Guangxi (Ye et al., 2006). The periods of Eucalyptus harvest cutting is about 4-6 years.
This research focused on the eastern part area of Shangsi County which is in the southern part of the Guangxi Zhuang Autonomous Region, and the coordinates are 21°40 3 - 22°22 38 N and 107°29 37 - 108°16 40 . The study site covers 6.8km * 5.5km of land which are the common part of time series high spatial resolution Gaofen-2 satellite images that are available.
The International Archives of the Photogrammetry, Remote Sensing and Spatial Information Sciences, Volume XLI-B8 2016 XXIII ISPRS Congress, 12–19 July 2016, Prague, Czech Republic
This contribution has been peer-reviewed.
2.2 Data
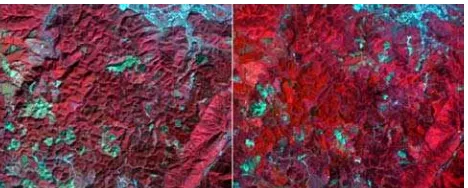
Two Gaofen-2 images were acquired on 14 January and 24 August in 2015 (Fig.1a and 1b). Gaofen-2 Satellite is the first sub-meter resolution civil satellite of China which was launched in August 19, 2014. It is an optical satellite equipped with 2 PAN/MSS cameras with combined swath of 45 km which can be applied to many fields, such as land and resources survey, mapping survey, disaster estimation, ecosystem protection and the correction of 1:10000 topographic map (Wenyong Yu et al, 2015). Gaofen-2 imagery contains four multi-spectral bands with a 3.24 m spatial resolution: 450–520nm (blue); 520–590 nm (green); 630–690 nm (red); 770–890 nm (near-infrared); and a panchromatic band (450–900nm), with a 0.81 m spatial resolution. The common parts of the two Gaofen-2 multispectral images are used for forest cover monitoring.
Fig.1a image of 14 Jan.,2015 Fig.1b image of 24 Aug.,2015
3. METHODOLOGY
In order to monitor the forest cover change, we integrate the pixel-based and object-based methods with consecutive time series high spatial resolution Gaofen-2 satellite images The proposed method includes three parts: (1) data preprocessing, includes radiometric, atmosphere, and geometric correction. (2) data transformation: includes Normalized Difference Vegetation Index (NDVI) differencing and principle component analysis. (3) object-based change detection with ruleset classification-system.
3.1 Data Preprocessing
3.1.1 Radiometric Calibration
The radiometric calibration coefficient of remote sensor is quantitative transformation between DN value and observed physical quantities. The TOA reflectance of the earth surface detected by Gaofen-2 satellite was computed according to the equation (1):
L=A*DN +N (1) Where L= Spectral Radiance [W/(m2 sr μm)]
A = Gains. [unitless] N= Bias. [unitless]
The values of A and N for different bands of sensors are shown in Table 1.
Pan B1 B2 B3 B4
PMS1 C 0.1630 0.1585 0.1883 0.1740 0.1897 N -0.6077 -0.8765 -0.9742 -0.7652 -0.7233 PMS2 C 0.1823 0.1748 0.1817 0.1741 0.1975
N 0.1654 -0.5930 -0.2717 -0.2879 -0.2773 Table 1. A and N parameters for Gaofen-2 sensors
3.1.2 Atmospheric Correction
QUAC was used for atmospheric correction of time series of Gaofen-2 data. QUAC is a visible-near infrared through shortwave infrared (VNIR-SWIR) atmospheric correction method for multispectral and hyperspectral imagery. Unlike other first-principles atmospheric correction methods, it determines atmospheric compensation parameters directly from the information contained within the scene (observed pixel spectra), without ancillary information.
3.1.3 Geometric Correction
Geometrical corrections were performed using Ground Control Points (GCP), determined with a differential GPS, for the Gaofen-2 satellite image acquired in 14 January, 2015, and the projection is UTM Zone 48N (WGS 84). With the reference image of the corrected image acquired in 14 January, 2015, geometric correction was carried out to the image acquired in 24 August, 2015 by the AutoSync toolbox of ERDAS Imagine software.
3.2 Data Transformation
For high spatial resolution satellite images, the variability in viewing and illumination geometries can have an impact on studies of vegetation structure, shadow fraction and characteristics of other land surface; significant changes in scene reflectance characteristics can result solely from different observation geometry (Wulder et al, 2008). To reduce these effects, data transformation was carried out, including NDVI differencing and principle component analysis.
3.2.1 NDVI differencing
The normalized difference vegetation index (NDVI) is one of the most appropriate indices for identifying the presence or absence of living vegetation. NDVI is derived using the NIR and red bands from the imagery where the difference between the two is divided by the sum of the two bands. The NDVI was derived using equation (2).
NDVI = (NIR – RED) / (NIR + RED) (2) Among all change detection methods the NDVI differencing method is most widely applied (Cheng et al., 2004). The pre- and post-NDVI images were derived using Eq. (2) and the NDVI difference image (NDVIdiff) was created using equation (3). Fig.2a shows the NDVI difference image.
NDVIdiff = NDVIpost –NDVIpre (3)
Fig.2a NDVI difference image Fig. 2b the composite image of PC3, PC4, PC5 3.2.2 Principle Component Analysis
Principle Component Analysis (PCA), mathematically based on ‘‘Principal Axis Transformation’’, is a transformation of the multivariate data to a new set of components, reducing data redundancy (Lillesand et al., 2008). PCA uses either the covariance matrix or the correlation matrix to transfer data to an The International Archives of the Photogrammetry, Remote Sensing and Spatial Information Sciences, Volume XLI-B8 2016
XXIII ISPRS Congress, 12–19 July 2016, Prague, Czech Republic
This contribution has been peer-reviewed.
uncorrelated set (Hussain, et al., 2013). The eigenvectors of the resulting matrices are sorted in decreasing order where first principal component (PC) expresses most of the data variation. The succeeding component defines the next largest amount of variation and is independent (orthogonal) of the preceding principal component. In PCA the assumption is that the areas of no change are highly correlated while areas of change are not. In multi-temporal image analysis, the PC1 and PC2 tend to represent the unchanged areas, whereas PC3 and later PCs contain the change information (Byrne et al., 1980; Ingebritsen and Lyon, 1985; Richards, 1984). Bi-temporal images are merged into one set and PC is applied. The PCs having negative correlation to bi-temporal data correspond to change. The composite image of PC3, PC4 and PC5 is useful for forest cover change detection (Fig.2b).
3.3 Object-based Ruleset Classification System
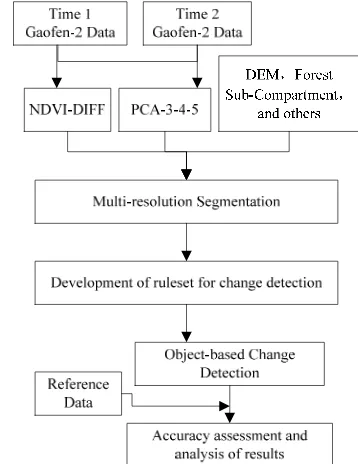
For the integrated analysis of the NDVI difference image and the composite of PC3, PC4, PC5 from time series Goafen-2 high spatial resolution satellite images, we choose the object-based ruleset classification system to monitor forest cover change. Object-based approach provides a better means for change detection than a pixel based method because it provides an effective way to incorporate spatial information and expert knowledge into the change detection process (Zhou et al., 2008). The first step of object-based classification is to segment an image into multipixel object primitives according to both spatial and spectral features. These objects are defined to maximize between-object variability and minimize within-object variability for user-chosen inputs. The segmentation algorithm first identifies a set of starting points (seed points) of a segmentation process and then joins contiguous pixels to the seed points if they fulfill the homogeneity criteria until certain thresholds are reached(Elmqvist et al, 2008). Scale, Shape and Compactness are parameters for image segmentation. Scale parameter is one of the important criteria in segmentation process and determines the average size of segmented objects. When the size of a growing region exceeds the threshold defined by the scale parameter, the merging process stops. By trial and error, we give the scale parameter the value of 20, and shape parameter value of 0.1 and compact parameter value of 0.5. Rule-based decisions are applied to the parcels of deforestation and afforestation. The procedure of object-based ruleset system for forest cover change detection is as Fig.3.
4. RESULTS AND ANALYSIS 4.1 Results
For monitoring the forest cover change, three classes are identified: deforestation, afforestation and no change. With the object-based ruleset classification system, forest cover change map from 14 January, 2015 to 24 August, 2014 in the eastern part of Shangsi county, Guangxi Zhuang Autonomous Region was produced. The results are shown in Fig. 4.
4.2 Analysis
We used the stratified random sampling accuracy assessment with 77 random selected points to validate the classification results (in ERDAS software) and time series spatial resolution merged Gaofen-2 satellite images and Google Earth were used for visual interpretation. The overall accuracy of our OBIA
classification results achieved 94.81% (Table 2), and Overall Kappa Statistics = 0.9155.
Fig.3 The procedure of object-based ruleset classification system for forest cover monitoring
Fig.4 Forest cover change map
defores
tation
affores tation
no
change Total
Users Accuracy
Defores-tation 17.000 0.000 0.000 17.000 1.000
Affores-tation 0.000 18.000 2.000 20.000 0.900 no change 1.000 1.000 38.000 40.000 0.950
Total 18.000 19.000 40.000 77.000
Producers
Accuracy 0.944 0.947 0.950 0.948
Table 2. Confusion Matrix for object-based forest cover monitoring
The International Archives of the Photogrammetry, Remote Sensing and Spatial Information Sciences, Volume XLI-B8 2016 XXIII ISPRS Congress, 12–19 July 2016, Prague, Czech Republic
This contribution has been peer-reviewed.
According to the statistics of the result map, deforestation rate is about the 2.182% of the total areas, the afforestation rate is about 2.377% of the total area, and the forests are in stable dynamic state.
5. CONCLUSIONS
With the pixel-based NDVI difference image and the composite image of PC3, PC4, PC5, we can get the general information of deforestation and afforestation on the spectral features and training samples. Then Object-based ruleset classification could be used to get the detailed change information and reduce the “salt and pepper” effects of the pixel-based classification results. Our result shows that consecutive time series high resolution Gaofen-2 images are suitable for forest cover monitoring in tropical/subtropical fast growing and high yielding plantation forests at local scales.
ACKNOWLEDGEMENTS
This paper is financially supported by the National Natural Science Foundation of China (31370635) and the project National Science and Technology Major Projects of China (21-Y30B05-9001-13/15). GF-2 Satellite images are provided by the CRESDA. The authors wish to thank the anonymous reviewers for the comments and suggestions on this paper.
REFERENCES
Byrne, G.F., Crapper, P.F., Mayo, K.K., 1980. Monitoring land-cover change by principal component analysis of multitemporal landsat data. Remote Sensing of Environment, 10, pp.175–184. Cheng, K.S., Wei, C., Chang, S.C. 2004. Locating landslides using multi- temporal satellite images. Adv. Space Res. 33,pp. 296–301,.
Elmqvist, B.; Ardo, J.; Olsson, L. 2008. Land use studies in drylands: An evaluation of object-oriented classification of very high resolution panchromatic imagery. Int. J. Remote Sens., 29, pp.7129–7140.
Gaofen-2, 2015. http://www.cresda.cn/CN/Satellite/3128.shtml (19 April 2016)
Li S. , Li Z. , Chen E., Wang Z.. 2011, Vegetation cover mapping using multi-temporal HJ satellite data. In:Proceedings of the 34th International Symposium on Remote Sensing of Environment, Sydney, Australia
Hansen, M. C., et al. 2008. A method for integrating MODIS and Landsat data for systematic monitoring of forest cover and change in the Congo Basin. Remote Sensing of Environment 112(5), pp. 2495-2513.
Hammer, D., et al. (2014). Alerts of forest disturbance from MODIS imagery. International Journal of Applied Earth Observation and Geoinformation, 33(0), pp.1-9.
Huang, C., et al. 2008. Use of a dark object concept and support vector machines to automate forest cover change analysis. Remote Sensing of Environment 112(3), pp.970-985.
Hussain, M., et al. 2013. Change detection from remotely sensed images: From pixel-based to object-based approaches. ISPRS Journal of Photogrammetry and Remote Sensing, 80, pp. 91-106.
Ingebritsen, S.E., Lyon, R.J.P., 1985. Principal components analysis of multitemporal image pairs. International Journal of Remote Sensing. 6, pp.687–696
Lillesand, T.M., Kiefer, R.W., Chipman, J.W., 2008. Remote Sensing and Image Interpretation, sixth ed. John Wiley & Sons, Hoboken, NJ.
Ye Shaoming, Zheng Xiaoxian, Jin Dagang, 2006.Study on Current Situation and Management Strategy of Eucalyptus Plantation in Guangxi, Forest Resources Management, 6, pp.23-26
MA Jiangming, LIANG Shichu, YANG Donglin, WU Meng, YE Quanqing, JIANG Shaofeng. 2013. Characteristics of content and density of soil organic carbon in Eucalptus grandis×E. urophylla forest and the other three forest types in northern Guangxi. Ecology and Environmental Sciences, 22(8), pp.1282-1287.
Richards, J.A., 1984. Thematic mapping from multitemporal image data using the principal components transformation. Remote Sensing of Environment. 16, pp.35–46.
Zhou Weiqi, et al. 2008. Object-based Land Cover Classification and Change Analysis in the Baltimore Metropolitan Area Using Multitemporal High Resolution Remote Sensing Data. Sensors (Basel): pp.1613 - 1636. Wenyong Yu, Xiaojin Li, Xiaoxiang You, Haibo Wang, 2015. Research on Gaofen-2 Satellite Dual Camera Mosaic Based on SOC Technology, Spacecraft Engineering, 24, Supp.150-155 Wulder, M. A., et al. (2008). Multi-temporal analysis of high spatial resolution imagery for disturbance monitoring. Remote Sensing of Environment, ,112(6), pp.2729-2740
The International Archives of the Photogrammetry, Remote Sensing and Spatial Information Sciences, Volume XLI-B8 2016 XXIII ISPRS Congress, 12–19 July 2016, Prague, Czech Republic
This contribution has been peer-reviewed.