OBJECT-BASED GREENHOUSE CLASSIFICATION FROM HIGH RESOLUTION
SATELLITE IMAGERY: A CASE STUDY ANTALYA-TURKEY
M. Coslua,b, N. K. Sonmeza,b*, D. Koc-Sana,b
a
Akdeniz University, Department of Space Sciences and Technologies, 07058, Antalya, Turkey bAkdeniz University, Remote Sensing Research and Application Centre ,07058, Antalya, Turkey
([email protected], [email protected], [email protected])
Commission VII, WG VII/4
KEY WORDS: Greenhouse, Object-Based, Classification, High Resolution Imagery, Worldview-2
ABSTRACT:
Pixel-based classification method is widely used with the purpose of detecting land use and land cover with remote sensing technology. Recently, object-based classification methods have begun to be used as well as pixel-based classification method on high resolution satellite imagery. In the studies conducted, it is indicated that object-based classification method has more successful results than other classification methods. While pixel-based classification method is performed according to the grey value of pixels, object-based classification process is executed by generating imagery segmentation and updatable rule sets. In this study, it was aimed to detect and map the greenhouses from object-based classification method by using high resolution satellite imagery. The study was carried out in the Antalya province which includes greenhouse intensively. The study consists of three main stages including segmentation, classification and accuracy assessment. At the first stage, which was segmentation, the most important part of the object-based imagery analysis; imagery segmentation was generated by using basic spectral bands of high resolution Worldview-2 satellite imagery. At the second stage, applying the nearest neighbour classifier to these generated segments classification process was executed, and a result map of the study area was generated. Finally, accuracy assessments were performed using land studies and digital data of the area. According to the research results, object-based greenhouse classification using high resolution satellite imagery had over 80% accuracy.
* Corresponding author
1. INTRODUCTION
In Turkey, greenhouse cultivation started with the foundation of greenhouses in Antalya in 1940. Between the years of 1940-1960 the development of greenhouses was very slow. Greenhouse cultivation expanded particularly around Antalya and İzmir. After these years, with the use of plastic cover material there was a significant increase in greenhouse area. (Sevgican et al., 2000).
Turkey's total greenhouse presence is 599,000 da. and 317,000 da. (53%) of which consist of high systems. In terms of the presence of greenhouse, Turkey is located in between the first four countries in the world, in the first row with Spain in Europe. In Turkey over the last 10 years the average size of the greenhouse management increased from 2 da. to 4 da. 95% of vegetable, 4% fruit, 1% ornamental plants of our greenhouse fields are cultivated. The greenhouse production value of Turkey is approximately $ 3.6 billion. Antalya ranks first with 51% (3.2 million tons) in greenhouse production (Republic of Turkey Ministry of Food, Agriculture and Livestock, 2016).
It was determined that in the study executed by Canakci et al., (2004) in Antalya the greenhouse fields were 45.5% glass, % 33.9 plastic greenhouse. Products commonly grown in greenhouses were tomato, pepper, eggplant, cucumber, beans and melons. In addition to the greenhouse vegetable growing, greenhouse managements also carried out fruit and vegetable farming in the open field.
Classification in remote sensing is the process of determining meaningful patterns groups in the image that forms the thematic information. Pixel-based classification methods are widely used in remote sensing studies. However rich information content of high-resolution data can’t be exactly depicted in pixel-based approach. This case encourages the use of object-based classification method as an alternative. Indeed, in addition to spectral information in the image pixels the object-based classification is a method that uses the texture and context information. The basic element classified is not pixels but the objects consisting of pixels group. (Sunar et al., 2013).
The development of robust object-oriented classification methods suitable for medium to high resolution satellite imagery provides a valid alternative to ‘traditional’ pixel-based methods (Whiteside et al., 2005).
The first stage of the object-based classification is the segmentation process. The use of satellite image and appropriate vector information facilitates the automatic object extraction and increases accuracy. The use of vector information is superior to the case in which the vector information is not used. (Karakis et al., 2005).
The nearest neighbour classification algorithm based on samples received from the class hierarchy through the segments is basically similar to the supervised classification algorithm. Sample segments are selected in object based classification as well, such as sampling areas received in pixel-based classification. At the classification stage instead of pixels the use of segments as a unit provides the fast progress of the process in the nearest neighbour algorithm. This process is performed faster and more accurately in the object-based method. Thus, by using the average value of the samples selected for each class, segments with common features on the all image are selected with the nearest neighbour method and the classification process is completed (Kalkan et al., 2016).
It is an imported step to test the accuracy of the processes in order to analyse the reliability of the results. The accuracy analysis which will be held in the classification result tests the conformation between the classified data and ground truth (Kalkan, 2011).
In the study executed by Karlson et al. (2014) it was indented to manage woodlands (parklands) of semi-arid West Africa and to map tree crown using WorldView-2 imagery and geographic object based image analysis, and the overall detection rate was 85.4%. However it was detected that this detection rate was lower in the areas where understory vegetation was dense.
Greenhouse detection using remote sensing technologies is a challenging task for urban and rural planning, agricultural yield estimation, natural resource management, and sustainable development. In the research performed by Koc-San (2013) it is aimed to compare the supervised classification techniques including maximum likelihood (ML), random forest (RF), and support vector machines (SVM) for land cover classification with emphasis on greenhouse detection, and to investigate the utility of WorldView-2 satellite imagery for detecting and discriminating plastic and glass greenhouses. Overall, the computed classification accuracies are quite high using all classification techniques. However, the most accurate classification result was obtained using SVM classifier, with overall accuracy of 93.88%. The performance of RF classification is slightly lower than SVM classification, with overall accuracy of 91.73%. (Koc-San, 2013).
Aguilar et al. (2014) used the object-based classification method to detect greenhouses from Geoeye-1 and Worldview-2 stereo satellite imageries. According to the obtained results, the best overall accuracy values were close to 90%. Moreover, horticultural crops growing in plastic greenhouses were identified using object-based classification, and the overall accuracy was 81.3% (Aguilar et al., 2015).
In the research performed by Chaofan et al. (2016) it is aimed to present a practical framework for extracting suburban greenhouses, integrating remote sensing data from Landsat-8 and object-oriented classification. The results demonstrated that object-based classification incorporating non-spectral features yielded a significant improvement compared with the
classification results obtained using only the spectral information in traditional per-pixel classification. Both the producer’s and user’s accuracy values were higher than 85% for greenhouse identification. Although it remained a challenge to completely distinguish greenhouses from sparse plants, the final greenhouse map indicated that the proposed object-based classification scheme, providing multiple feature selections and multi-scale analysis, yielded worthwhile information when applied to a continuous series of the freely available Landsat-8 imagery data.
As a result, the aim of this study is to determine and map the greenhouse areas with the object-based method using high resolution satellite data. To the best of our knowledge, it is the first study that uses the object based classification for greenhouse detection in Altinova, Antalya.
2. METHODS
2.1 Study Area and Data Sets
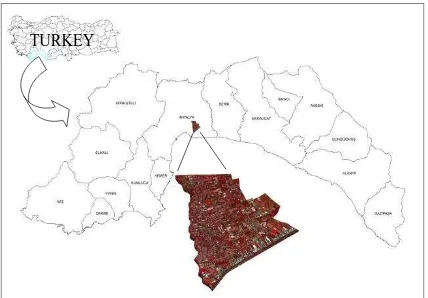
Antalya is in the southwest of Turkey and on the Mediterranean coast (Figure 1). Its area is 20,874 km. The study area is the Altinova district in Antalya (Figure 2). This district located in the western part of Antalya city center covers 1331 hectares. At the same time this district remains between the Duden Creek and the border of Aksu province. Although there are residential area on the parts near the road of the district, land use is mostly for agricultural purposes. From this perspective, a large part of agricultural activity almost consists of greenhouse areas. The number of glass and plastic covered greenhouses in the district is 1778.
Figure 1. The location of the study area. TURKEY
Figure 2. Study area.
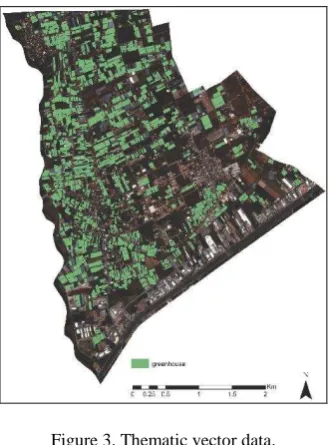
Worldview-2 (WV2) satellite data belonging to the study region, dated April 2012, was used .WV2 (0.46 m and 1.84 m GSD of PAN and MS modes, respectively) is the first commercial VHR satellite providing 8 bands in MS mode. These bands are the four classical bands (B: 450-510 nm, G: 510-580 nm, R: 630-690 nm NIR1: 760-895 nm), and four additional bands (C: 400-450 nm), Y: 585-625 nm, RE:705-745 nm and NIR2: 860-1,102 nm). In addition, in this study the thematic vector data layer that shows the greenhouse was used as the other data (Figure 3).
Figure 3. Thematic vector data.
The study consists of three stages (Figure 4). In the first stage, image segmentation process was performed to April 2012 dated Worldview-2 satellite image. In the second stage, the classification process was performed in the study area by applying the nearest neighbour classifier to the created segments. In the final stage of the study, the accuracy analysis was performed.
Figure 4. Flowchart of the object-based image analysis.
2.2 Image Segmentation
The most important stage of the study is the segmentation stage. The purpose in the segmentation process is to create meaningful objects through the image. At this stage, especially the scale parameters, shape and compactness criteria were identified close to the truth as possible. Parameters and criteria at this stage was reached at the 4th level. The thematic vector data layer used in the study also increased the quality of the segmentation (Figure 5a, b).
Figure 5. (a) The result of segmentation belonging to the study area. (b) The result of segmentation belonging to a zoomed
area.
2.3 Image Classification
The quality of the classification depends on the quality of the segmentation process and the appropriate geometric shapes of the obtained segments. After segmentation performed with the appropriate parameters to the study area, the classification stage was executed. At the classification stage of the study, non-parametric nearest neighbour classifier was used due to its simplicity and the flexibility. Nearest neighbour classifier is basically similar to the supervised classification algorithm. However at the classification stage, the use of the segments as a unit instead of pixels provides the fast progress of the process in the nearest neighbour algorithm.
(a) (b)
OBJECT-BASED IMAGE ANALYSIS
(OBIA)
Image Segmentation
Image Classification
Accuracy Assessment
In this study, 178 objects were used to perform the training stage. These 178 objects correspond to 10% of the 1778 the greenhouse data located in the thematic vector data layer. Moreover, Aguilar et al. (2013) reported that, in statistical terms, the most efficient choice dealing with urban areas classification from high resolution imagery would be about 10% of the training samples. As the main objective of the study is to identify the greenhouses areas, two classes were determined as the greenhouse class and the other class. Throughout the study, the classification stage was carried out through these two classes.
2.4 Accuracy Assessment
In this study, the classification process was carried out using the nearest neighbour algorithm. 178 training objects were used for the classification process. The remaining 1600 objects in the same thematic vector layer were used for testing accuracy assessment. The classification accuracy of the study is computed using the error matrix. For this purpose accuracy assessment as statistic type, error matrix based on samples was used. As a result of the error matrix based on samples carried out in the study the overall accuracy (OA) value and kappa statistics were calculated.
3. RESULTS AND DISCUSSION
The classification results obtained by using multiresolution algorithm at the segmentation stage and the nearest neighbour classifier at the classification stage of the study are shown in figure 6(a). At the last stage of the study, in the performed accuracy assessment the overall accuracy value (OA) was computed as 82% and kappa statistics value was computed as 0.65. In the study as well as the basic spectral data, thematic vector data layer showing greenhouses in the area was also used (Figure 6b). It was revealed that the use of this data had an impact on the quality of the segmentation and the accuracy of the classification.
Figure 6. (a) The result of the object-based classification (b)Thematic vector data.
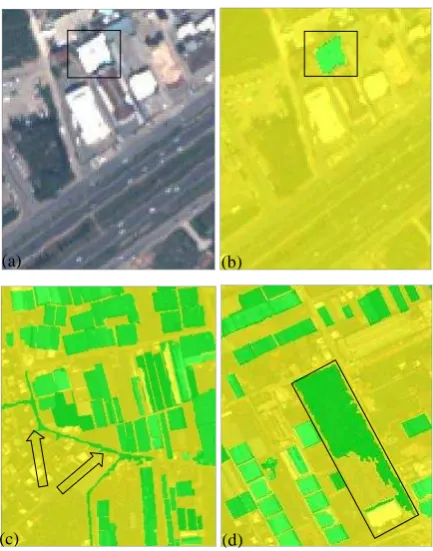
It was determined that in some parts of the study, as a result of the incorrect classification the white building, road and bare land were assigned to the wrong class. The white building located in the black rectangular area in figure 7(a) was
incorrectly located in the greenhouse class as seen in figure 7(b) It was determined that road in figure 7(c) and the bare land shown in the black rectangle in figure 7(d) were included in the greenhouse class.
Figure 7. (a) White building. (b) Inaccurately classified white building. (c) Inaccurately classified road. (d) Inaccurately
classified bare land.
4. CONCLUSIONS
In this study, the classification of greenhouses was performed by using object-based image analysis method with high-resolution satellite images. This study is significantly important because the image analysis method presents a novel approach to the classification studies executed in the district. The study was carried out in the Altinova district, in the province of Antalya, where greenhouse agriculture are applied intensively.
Worldview-2 satellite image was used in the segmentation process. At this stage, the thematic vector layer showing the greenhouses belonging to the district was also used. The most appropriate segmentation process was conducted in the 4th level with this thematic data used, the appropriate scale parameters, shape and compactness criteria. At the classification stage simple, flexible and non-parametric nearest neighbour classifier was used. The classification process was carried out using 178 training objects. When looking at the results of the classification, it can be stated that the greenhouse areas were detected quite accurately. However it was also seen that some objects (roads, white buildings and bare lands) weren’t assigned to the accurate class.
For the future we plan to classify the existing glass and plastic greenhouses using object based classification method, and also
(a) (b)
(a) (b)
(c) (d)
to identify the products in these existing greenhouses using the same method.
ACKNOWLEDGEMENTS (OPTIONAL)
We would like to thank Bahar COSLU for her contribution to the language editing the article.
REFERENCES
Aguilar, M. A., Bianconi, F., Aguilar, F. J., and Fernández, I., 2014. Object-Based Greenhouse Classification from GeoEye-1 and WorldView-2 Stereo Imagery. Remote Sensing. 2014, 6, 3554-3582.
Aguilar, M. A., Vallario, A., Aguilar, F. J., Lorca, A. G., and Parente, C., 2015. Object-Based Greenhouse Horticultural Crop Identification from Multi-Temporal Satellite Imagery: A Case Study in Almeria, Spain. Remote Sensing. 2015, 7, 7378-7401.
Chaofan, W., Jinsong, D., Ke, W., Ligang, M., Tahmassebi, A. R. S.,2016. Object-based classification approach for greenhouse mapping using Landsat-8 imagery. International Journal of Agricultural and Biological Engineering, Vol. 9 No.1 79.
Canakcı, M., Akinci, İ,. 2004. Agricultural Structure and Mechanization Properties of the Greenhouse Vegetable Farms in the Antalya Region. Akdeniz University Journal of the Faculty of Agriculture, 2004, 17(1), 101-108, Antalya.
Kalkan, K., 2011. Transferable Object Based Classification Rule Set for Detection of Potential Open Spaces for Urban Growth. Istanbul Technical University Graduate School of Science Engineering and Technology Master Thesis, Istanbul.
Kalkan, K., Maktav, D. Comparison of Pixel Based and Object Based Classification Methods (Ikonos Example). III.Remote Sensing and Geographic Information System Symposium. (Date accessed: 15 February 2016).
Karakis, S., Marangoz, A., M., Buyuksalih, G., 2005. Automatıc Object Extraction from Quıckbird Pan-Sharpened Image and Analysis of Convenience of Integration to Geographical Information Systems. Union of Chambers of Turkish Engineers and Architects Chamber of Survey and Cadastre Engineers 10th Turkey Map Scientific and Technical Assembly, Ankara.
Karlson, M., Reese, H., Ostwald, M., 2014. Tree Crown Mapping in Managed Woodlands (Parklands) of Semi-Arid West Africa Using WorldView-2 Imagery and Geographic Object Based Image Analysis. Sensors, 2014, 14, 22643-22669.
Koc-San, D., 2013. Evaluation of Different Classification Techniques for the Detection of Glass and Plastic Greenhouses from WorldView-2 Satellite Imagery. Journal of Applied Remote Sensing, 073553-1 Vol. 7, 2013.
Republic Of Turkey Ministry Of Food, Agriculture And Livestock,2016.http://www.tarim.gov.tr/Konular/BitkiselUretim /Tarla-Ve-Bahce-Bitkileri/Ortu-Alti Yetistiricilik. (Date accessed: 01.04.2016)
Sevgican, A., Tuzel, Y., Gul, A. ve Eltez, R.Z., 2000. Greenhouse Cultivation in Turkey. V. Turkey Agriculture Technical Congress 2. Vol., Union of Chambers of Turkish Engineers and Architects Chamber of Agricultural Engineers, S. 679-707, 17-21 January, Ankara.
Sunar, F., Ozkan, C., Osmanoglu, B., 2013. Remote Sensing (2.Press). Anadolu University, Edition Nu: 2320. Faculty of Open Education Edition Nu:1317, Eskişehir.
Whiteside, T., Ahmad, W., 2005. A Comparison Of Object-Oriented and Pixel-Based Classification Methods for Mapping Land Cover in Northern Australia. Proceedings of SSC2005 Spatial intelligence, innovation and praxis: The national biennial Conference of the Spatial Sciences Institute, September 2005, Melbourne, Spatial Sciences Institute. ISBN 0-9581366-2-9.