LATERAL FLOODING ASSOCIATED TO WAVE FLOOD GENERATION ON RIVER
SURFACE
C. Ramírez-Núñez a, J.-F. Parrot b *
a GIScience, Institute of Geography, Heidelberg University, Im Neuenheimer Feld 368, 69120, Heidelberg, Germany. b LAGE, Institute of Geography, National Autonomous University of Mexico, Ciudad Universitaria, 04510, Distrito Federal
Commission II, WG II/5
KEY WORDS: Floods, simulations, LiDAR, Digital Terrain Models.
ABSTRACT:
This research provides a wave flood simulation using a high resolution LiDAR Digital Terrain Model. The simulation is based on the generation of waves of different amplitudes that modify the river level in such a way that water invades the adjacent areas. The proposed algorithm firstly reconstitutes the original river surface of the studied river section and then defines the percentage of water loss when the wave floods move downstream. This procedure was applied to a gently slope area in the lower basin of Coatzacoalcos river, Veracruz (Mexico) defining the successive areas where lateral flooding occurs on its downstream movement.
* Corresponding author
1. INTRODUCTION
The use of simulation in geosciences has increased in recent years as users realized its potential to provide solutions and detect opportunities, mainly in the case of disasters (Bates et al., 2005; Parrot, 2009; Parrot and Collet, 2009; Delahaye and Douvinet, 2013). This increasing field of research is more used not only as high resolution data of the earth surface are available for public use, but also as open source algorithms are free downloaded in the net. From a critic point of view, one must say that the best answer to a problem does not necessarily depend on the application of existing tools; the programmer cannot provide a solution for specific cases when considering nature as a complex system (Albrecht, 2005; Douvinet et al., 2011). In the case of floods disasters, software has been developed in order to simulate this process at different scales (Bates and De Roo, 2000).
Not all the floods represent a risk (Halstead and O’Shea, 1989; Shorr, 2000). In the flood plain of Coatzacoalcos River (Mexico), floods were considered by inhabitants to provide resources that help them to survive during dry season (Cyphers et al., 2013). Nevertheless, since 1990, the flood plain has been modified by mining and road construction affecting primary activities of the population. In the context of a flat zone, even low hypsometric modifications modify the roughness degree and then its vulnerability.
From the hydrological point of view, a flood is a long, low-amplitude wave down in a bankfull of complex geometry with specific celerity attenuated by loss friction. The wave may surpass bankfull height, and adjacent plains will act as storage or as a route to continue the movement of the water (Bates et al., 2005). The maximum discharge level is recorded upstream; meanwhile, the effect of translation downstream flattens out the wave. Both effects are observed in the hydrographs of the upstream and downstream sections. The attenuation of the wave is not only related to friction loss but to the distribution or
storage of water in the basin, evapotranspiration, infiltration, etc. Depending on the level of study process, the flow is represented in one, two or three dimensions, but even if one considers detailed modelling, each drainage basin has a specific response associated to its particular geometry, slope and drainage network organization (Bates et al., 2000 and 2005). It has been shown that topography has a major control on the inundation process (Nicholas and Walling, 1997). This fact traduces the importance of three-dimensional or quasi-three dimensional approaches to modelling.
In this context, floodplain flow is thus approximated as a two dimensional diffusion wave; this wave flood can be modelled by using increasingly accurate Digital Terrain Model (DTM). A DTM corresponds to raster image that is a bi-dimensional representation of a three-dimensional space (Peet and Sahota, 1985); pixel values correspond to altitude. This space can be considered as a 2.5 dimension. The type of modelling will also consider boundary conditions, data source, coefficients of friction, validation and its errors (Stoesser et al., 2003). Wave flood modelling has been used by Akanbi and Katopodes (1988), Wurbs and ASCE (1987) and Liang et al. (2007).
The purpose of this research is to simulate a wave flood by using a Gaussian curve and associated upstream waves in a bankfull and their interaction with the flood plain by using a high resolution LiDAR DTM. The paper is separated in the following sections: 1) data used and method; 2) results and 3) conclusions.
2. DATA USED AND METHOD
2.1 Data used
The basic data used are the DTM and the image of the surface of the river and its skeleton. The data require pre-treatments in order to produce a simulation of quality.
The International Archives of the Photogrammetry, Remote Sensing and Spatial Information Sciences, Volume XLI-B2, 2016 XXIII ISPRS Congress, 12–19 July 2016, Prague, Czech Republic
This contribution has been peer-reviewed.
The basic information used is the filtered LiDAR point cloud from the bare earth surface provided by the Mexican Institute of Statistics and Geography (INEGI, 2013) and transformed to raster format (Parrot, 2013). As in the DTM (LiDAR Digital Terrain Model) the surface of the rivers represents the base on which the flood is simulated, high level of roughness and incoherent altitude values of the river surface produced by lidargrammetry are removed (Parrot and Ramírez-Núñez, 2015). The resulting DTM has a river surface with progressive altitude values so that we directly use the surface of the river without tracing the blue line to store values per cell in the rivers.
Even if LiDAR DTM has artifacts, the river surface is extracted from these data; this surface requires pre-treatments in order to engender a continuous altitude representation. First, river surface is binarized and then the skeleton of the rivers is obtained using a thinning procedure (O’Gorman, 1990).
2.2 Model development
c is the standard deviation d = 0 evaporation, infiltration, percolation and/or storage in the relief. The attenuation can also be reduced when the flood plain is dry and low channel velocity.
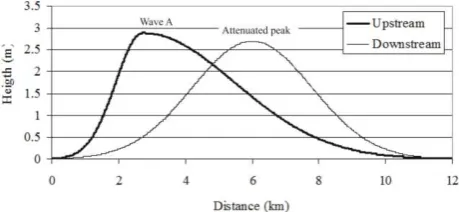
Figure 1 shows the basis of the calculation applied to the study area. The attenuated peak of the Gaussian curve has been located on the end point of the skeleton and the displacement of the associated upstream waves permits to follow local flooding when the wave is going down.
The algorithm is based on the fact that floodplain flow is approximated as a two dimensional diffusion wave; this implies the calculation of two spatial aspects of the flood process: the height achieved in the bankfull and the invaded adjacent plains. Thus, in a first step, the algorithm takes into account the inlet and outlet pixel coordinates (x, y and z) of the skeleton in order to calculate the slope of the river surface. In the flood plain used as test area, for a river section of 7.2 km, slope is 0.00003 %.
Figure 1. Example of wave flood calculation.
The maximum altitude of the wave, either theoretical or calculated from hydrographs, corresponds at least to a 2 m level increase of the river surface. Several tests were realized in order to know exactly the critical altitude limit for inundation triggering in the study zone. This limit corresponds to a 2.7 m wave height for the peak of the attenuated Gaussian curve. In a second step, the Gaussian curve and their associated upstream waves are calculated using the previous information following the entire skeleton. In this case the variation downstream of the factor will produce the attenuation of the wave as reported in Fig. 1. At this point, one can calculate the percentage of loss as water volume is displaced downstream.
3. RESULTS
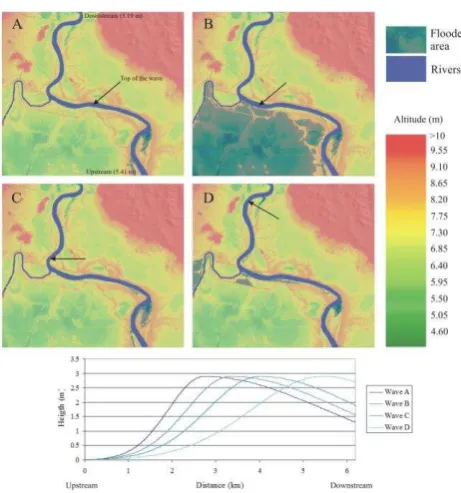
The loss percentage of water volume when passing from the upstream wave to the attenuated Gaussian curve has been fixed at 7% according to the length of the river section and the volume of the flooding (0.008695 km3) that invades the lower south-western area where maximum water depth is 3.20 m. The flooded surface is 5.054 km2 and covers 27.93% of the area. This 7% loss means that the maximum amplitude of the wave generates lateral flooding is 2.93 m. Anyway, 7% corresponds to a lower limit, because no flooding occurs in the southwest part of the study zone for lower loss percentages. In fact, the riverbanks are formed by old scroll-bars that generally prevent an overflowing of the river.
Results are reported in a raster image (Fig. 2) that shows how the areas are invaded according to the position of the top of the upstream waves. Flow depth is provided in a DTM with the corresponding altitudes.
4. CONCLUSIONS
This research provides a wave flood simulation taking into account its downstream movement. Flood depth and invaded areas are reported by means of a calculation that directly uses the surface of the river. Actually, an accurate simulation based on the wave flood movement requires a correct representation of the earth, mainly in the case of the river surfaces.
The proposed algorithm not only calculates the wave motion related to flood occurrence, but it is also able to generate the original river surface used as a referenced plan deformed inside the riverbanks by the flooding movement. Such a procedure allows to define precisely zones that can be affected by events of different magnitudes that can affect natural resources for human consumption.
The International Archives of the Photogrammetry, Remote Sensing and Spatial Information Sciences, Volume XLI-B2, 2016 XXIII ISPRS Congress, 12–19 July 2016, Prague, Czech Republic
This contribution has been peer-reviewed.
Figure 2. Wave flood calculation in the study area.
REFERENCES
Akanbi, A.A. and Katopodes, N.D., 1988. Model for flood propagation on initially dry land. Journal of Hydraulic Engineering, 114, pp. 689-706.
Albrecht, J., 2005. A new age for Geosimulation. Transactions in GIS, 9 (4), pp. 451-454.
Bates, P.D. and De Roo, A.P.J., 2000. A simple raster-based model for flood inundation simulation. Journal of Hydrology, 236, pp. 54-77.
Bates, P.D., Horritt, M.S., Hunter, N.M., Mason D., Cobby, D., 2005. Numerical modeling of floodplain flow, pp. 271-304. In: Bates, P.D., Lane, S.N., Ferguson, R.I., (Eds.). Computational Fluid Dynamics. Applications in Environmental Hydraulics. England, John Wiley & Sons.
Cyphers, A., Zurita-Noguera J., Lane-Rodríguez, M., 2013. Challenges and risks in Olmec life (Retos y riesgos de la vida olmeca). Instituto de Investigaciones Antropológicas, Universidad Nacional Autónoma de México, pp. 184.
Delahaye D., 2002. Apport de l’analyse spatiale en géomorphologie – modélisation et approche multiscalaire des risques (Contribution of spatial analysis in geomorphology – multiscale modelling and multi-approach). Mémoire d’habilitation à diriger des recherches, 2 tomes, Université de Rouen, Laboratoire de Modélisation et Traitements Graphiques (MTG), 250 p.
Delahaye, D. and Douvinet, J., 2013. De la morphométrie à la géo-simulation (From morphometry to geo-simulation) pp. 245-259. In : Mercier, D., (Dir). Géomorphologie de la France. Paris, Dunod.
Douvinet, J., Delahaye, D., Langlois, P., 2011. Use of cellular automata in geomorphology: supports and challenges. Atelier International. Morphodynamique fluvial et Paléo-environnements alluviaux. J.-P. Bravard, 8-9 juin 2011. Université Lumière-Lyon 2(S).
Halstead, P. and O’Shea, J., 1989. Introduction to cultural responses to risk and uncertainty. P. Halstead and J. O’Shea (Eds.) Cambridge University Press, New York, p. 1-10.
Instituto Nacional de Estadística Geografía e Informática (INEGI) 2013. LiDAR filtered point cloud of the bare earth.
Liang, D., Falconer, R.A., Lin, B., 2007. Coupling surface and surface flows in a depth floodwave model. Journal of Hydrology, 337, pp. 147-158.
Nicholas, A.P. and Walling, D.E., 1997. Modelling flood hydraulics and overbank deposition river floodplains. Earth Surface Process and Landforms, 22, pp. 59-77.
O’Gorman, L., 1990. K × K Thinning. Journal of Computer Vision, Graphics and Image Processing, 51 (2), pp. 195-215.
Parrot, J.-F. 2009. DEM simulation of petroleum flux extension and diffusion due to pipeline ruptures in Mexico. In: MODSIM2009, ISBN: 978-0-978400-7-8, Anderssen, R.S., R.D. Braddock and L.T.H. Newham (Eds.), pp. 2701-2705.
Parrot, J.-F., 2013. Dem_lidar_inegi. http://www.igeograf. unam.mx/sigg/investigacion/lage/que_hacemos/spn/simul_lib_g eogr.php
Parrot, J.-F. and Collet, B., 2009. Simulation of lithospheric-plate collision by using DEM. Example of the Arabian platform motion. In: MODSIM2009, ISBN: 978-0-978400-7-8, Anderssen, R.S., R.D. Braddock and L.T.H. Newham (Eds.), pp. 1052-1058.
Parrot, J.-F. and Ramírez-Núñez, C., 2015. Lidar DTM: artifacts, and corrections for river altitudes. Revista Investigaciones Geográficas, Instituto de Geografía, UNAM, ISSN 0188-4611, dx.doi.org/10.14350/rig. 47372.
Peet, F.G. and Sahota, T.S., 1985. Surface curvature as a measure of image texture. PAMI, 7(6), pp. 734-738.
Shorr, N., 2000. Early utilization of flood recession soils as a response to the intensification of fishing and upland agriculture: resource-use dynamics in a large Tikuna community. Human Ecology, 28, 1, pp. 73-107.
Stoesser, T., Wilson, C.A.M.E., Bates P.D., Dittrich, A., 2003. Application of a 3D numerical model to a river with vegetated floodplains. Journal of Hydroinformatics, 05.2, pp. 99-112.
Wurbs, R. and ASCE, M., 1987. Dam-breach flood wave models. Journal of Hydraulics and Engineering, 113, pp. 29-46.
Revised June 2016
The International Archives of the Photogrammetry, Remote Sensing and Spatial Information Sciences, Volume XLI-B2, 2016 XXIII ISPRS Congress, 12–19 July 2016, Prague, Czech Republic
This contribution has been peer-reviewed.