http://infor.seaninstitute.org/index.php/infokum/index
JURNAL INFOKUM, Volume 9, No. 2, Juni 2021
ISSN :2302-9706
INFOKUM is licensed under a Creative Commons Attribution-Non Commercial 4.0
International License (CC BY-NC 4.0)
490
EXAMINE THE ROLE OF MOTIVATION IN UTAUT MODEL
ON THE USE OF CLOUD COMPUTING BY SMEs DURING
COVID-19 PANDEMIC
Marwan Al Fajri1, Erwin Setiawan Panjaitan2, Hanes3
Master of Information Technology, STMIK Mikroskil, Medan, Sumatera Utara email: [email protected] , [email protected] , [email protected]
Abstract
Article Info The 2019 Corona Virus Disease (COVID-19) pandemic is affecting the business sector in Indonesia, especially Small and Medium Enterprise (SMEs) that contribute greatly to the economy which impacted on decrease in revenue due to health protocols. This study aims to examine the role of motivation in the use of cloud computing technology by SMEs during the pandemic by combining it with the Unified Theory of Acceptance and Use of Technology (UTAUT) model. The research method uses quantitative data to test hypotheses that have been formulated through a survey of 129 SMEs in Medan using cloud computing technology since the pandemic. Questionnaires are distributed online and offline containing 25 indicators of variables arranged using the Likert scale. The data processing in this study used equation models from Structural Equation Modeling (SEM) and Smart Partial Least Square (SmartPLS) software. The results of this study received a positive response and showed a significant influence on motivation variable. SME actors have the motivation to survive in the sustainability of their business by using cloud computing technology as a necessity. So that the effect on the intention to use (behavior intention) to use cloud computing technology affects the actual use by SMEs.
Received 10 June 2021 Revised 20 June 2021 Accepted 30 June 2021
Keywords: Cloud Computing, UTAUT, SME, Motivation
1. Introduction
Indonesia confirmed the first case of corona virus infection or COVID-19 in early March 2020. COVID-19 is a new corona virus that was discovered in Wuhan, Hubei, China at the end of 2019 [1]. The corona virus outbreak has been declared a pandemic by the World Health Organization (WHO).
To prevent the spread of the impact of the COVID-19 pandemic, regulations and recommendations from the government were issued to limit the movement of people and goods [2]. There are several sectors that are most affected and affected by this policy, including education, food, social, transportation, manufacturing and tourism. Also in the economic sector, Indonesia is dominated by SMEs which are the backbone of the national economy and are seriously affected by aspects of production and income [3]. In North Sumatra, province of Indonesia, out of a total of 960,000 SMEs, 672,000 SMEs have suffered losses due to the impact of the COVID-19 pandemic [4].
http://infor.seaninstitute.org/index.php/infokum/index
JURNAL INFOKUM, Volume 9, No. 2, Juni 2021
ISSN :2302-9706
INFOKUM is licensed under a Creative Commons Attribution-Non Commercial 4.0
International License (CC BY-NC 4.0)
491
Empirical study of cloud computing as measured by various UTAUT factors and organizational factors on company performance, where expected performance, company size, and absorption can have a significant positive effect on innovation [5].During the COVID-19 pandemic, SME business people still have the motivation to survive in running business continuity [6] [7]. Researchers in this case examine the role of motivation that affects the solution and urgency of SME business people to survive during the COVID-19 pandemic.
2. Method
2.1 Type and Design Research
In this study, a structured questionnaire was developed to collect data through surveys and was taken as a data collection method because it is considered as an appropriate tool to collect quantitative data. [8]. The type of data used is quantitative data, namely data from research in the form of numbers, which can be calculated, such as data on the characteristics of respondents and the results of research questionnaire answers [9]. The source of the data used comes from primary data, namely data directly obtained by researchers from the main source. The main source of this research is through questionnaires that are given directly (offline) or via google form (online) to respondents. The questionnaire contains the indicators of the research variables compiled using a Likert scale.
2.2 Population and Sample
The population in this study are owners or managers of SMEs who use cloud computing technology services in the city of Medan. The sample is representative of all strata units and some of them in the population [10]. To obtain definite provisions, the number of samples can be determined based on the Slovin formula [11]. The formula used to calculate the minimum sample size for a finite population survey is: 𝑛 = 𝑁 1+𝑁𝑒2 (1) Information: 𝑛 = number of sample N = population size e = margin of error = 10%
So from this formula, the calculation of the number of samples can be determined as follows:
𝑛 = 1324
1 + 1324𝑥(0,1)2
𝑛 = 89 𝑟𝑒𝑠𝑝𝑜𝑛𝑑𝑒𝑛𝑡
Thus, the number of samples needed in this study is 89 respondents, who are SMEs that use cloud computing technology services in the city of Medan.
2.3 Defenition of Variable
According to research [12], to make it easier for a research to depart and lead to a clear goal, the research was simplified into a variable structure. Independent variables are referred to as stimulus, predictor, and antecedent variables. In Indonesian it is often referred to as the independent variable. The
http://infor.seaninstitute.org/index.php/infokum/index
JURNAL INFOKUM, Volume 9, No. 2, Juni 2021
ISSN :2302-9706
INFOKUM is licensed under a Creative Commons Attribution-Non Commercial 4.0
International License (CC BY-NC 4.0)
492
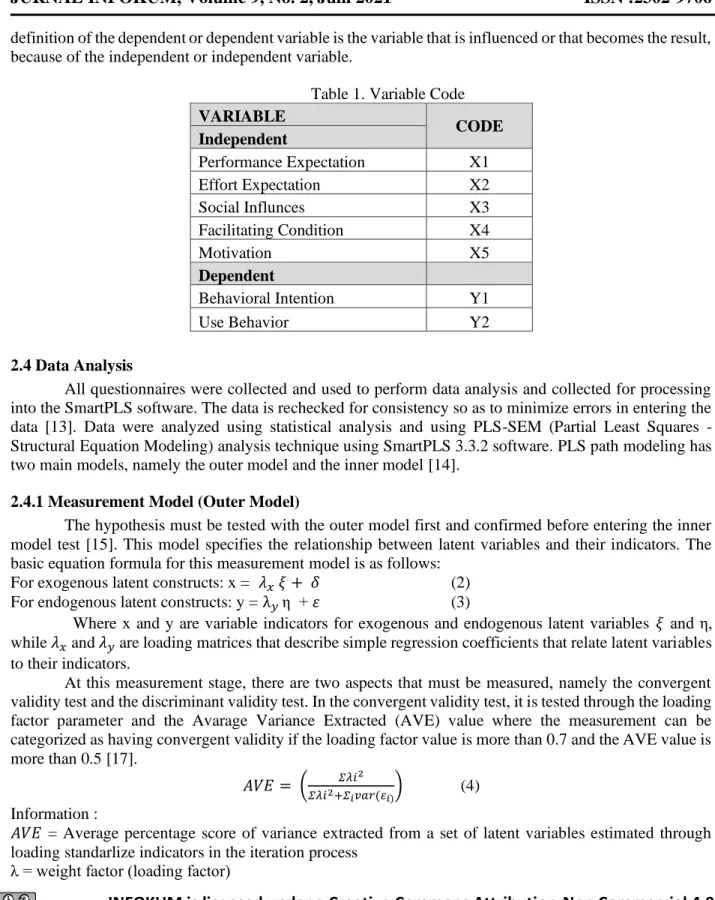
definition of the dependent or dependent variable is the variable that is influenced or that becomes the result, because of the independent or independent variable.Table 1. Variable Code VARIABLE CODE Independent Performance Expectation X1 Effort Expectation X2 Social Influnces X3 Facilitating Condition X4 Motivation X5 Dependent Behavioral Intention Y1 Use Behavior Y2 2.4 Data Analysis
All questionnaires were collected and used to perform data analysis and collected for processing into the SmartPLS software. The data is rechecked for consistency so as to minimize errors in entering the data [13]. Data were analyzed using statistical analysis and using PLS-SEM (Partial Least Squares - Structural Equation Modeling) analysis technique using SmartPLS 3.3.2 software. PLS path modeling has two main models, namely the outer model and the inner model [14].
2.4.1 Measurement Model (Outer Model)
The hypothesis must be tested with the outer model first and confirmed before entering the inner model test [15]. This model specifies the relationship between latent variables and their indicators. The basic equation formula for this measurement model is as follows:
For exogenous latent constructs: x = 𝜆𝑥 𝜉 + 𝛿 (2)
For endogenous latent constructs: y = λ𝑦 η + 𝜀 (3)
Where x and y are variable indicators for exogenous and endogenous latent variables 𝜉 and η, while 𝜆𝑥 and 𝜆𝑦 are loading matrices that describe simple regression coefficients that relate latent variables
to their indicators.
At this measurement stage, there are two aspects that must be measured, namely the convergent validity test and the discriminant validity test. In the convergent validity test, it is tested through the loading factor parameter and the Avarage Variance Extracted (AVE) value where the measurement can be categorized as having convergent validity if the loading factor value is more than 0.7 and the AVE value is more than 0.5 [17].
𝐴𝑉𝐸 = ( 𝛴𝜆𝑖2
𝛴𝜆𝑖2+𝛴
𝑖𝑣𝑎𝑟(𝜀𝑖)) (4)
Information :
𝐴𝑉𝐸 = Average percentage score of variance extracted from a set of latent variables estimated through loading standarlize indicators in the iteration process
http://infor.seaninstitute.org/index.php/infokum/index
JURNAL INFOKUM, Volume 9, No. 2, Juni 2021
ISSN :2302-9706
INFOKUM is licensed under a Creative Commons Attribution-Non Commercial 4.0
International License (CC BY-NC 4.0)
493
i = number of indicatorsWhile the discriminant test is determined by looking at the cross loading factor of each variable. The measurement can be categorized as having discriminant validity if it has a cross loading value of more than 0.7 [16].
2.4.2 Structural Model (Inner Model)
The structural model (inner model) was carried out to see the significant level of the relationship between the dependent variable and the independent variable [17]. The inner model is tested by looking at the R-Square (R2) value, and the path coefficient to get information on how much the dependent latent variable is influenced by the independent latent variable, as well as the significance test to test the significance value of the relationship or influence between variables [18]. Through the bootstrapping process, the T-Statistic parameter is obtained to predict the existence of a causal relationship [19].
Changes in the value of the R-Square can assess certain independent latent variables have an effect or have a substantive effect or not on the dependent latent variable. If the value is greater than the R-Square, it can indicate the higher the significance of the given effect. A value of 0.75 is interpreted as a strong influence significance, 0.50 moderate influence significance, and 0.25 symbolizes a weak influence significance [19].
3. Results and Discussion
The data collected through the questionnaire was addressed to SMEs that use cloud computing technology products in the city of Medan. The 132 respondents there were about 3 respondents who were not eligible for the test because they gave incomplete answers. So this study only used 129 respondents. 3.1 Demographics
Based on the respondents surveyed, the users of cloud computing technology in SMEs are still at a relatively young age, which is less than 50 years (as many as 88%), so the researcher concludes that SMEs run by entrepreneurs with old age or who have been running their business for a long time, usually only conduct business in traditional ways. In addition, the most dominant respondent when surveyed is female because some of them admit to supporting other income from their partner. Meanwhile, when viewed from the last education level of users, namely from high school to master as much as 95% (117 people) which shows that there is concern from the middle and upper education circles towards technology in carrying out their business activities. At the time the survey was conducted, the researchers first asked about the experience of SMEs using one of the cloud computing products, and most answered over 4 months (90% more) because of their decision to immediately use it when the pandemic hit and threatened their business. 3.2 Evaluation of Measurement Model (Outer Model)
3.2.1 Convergent Validity Test
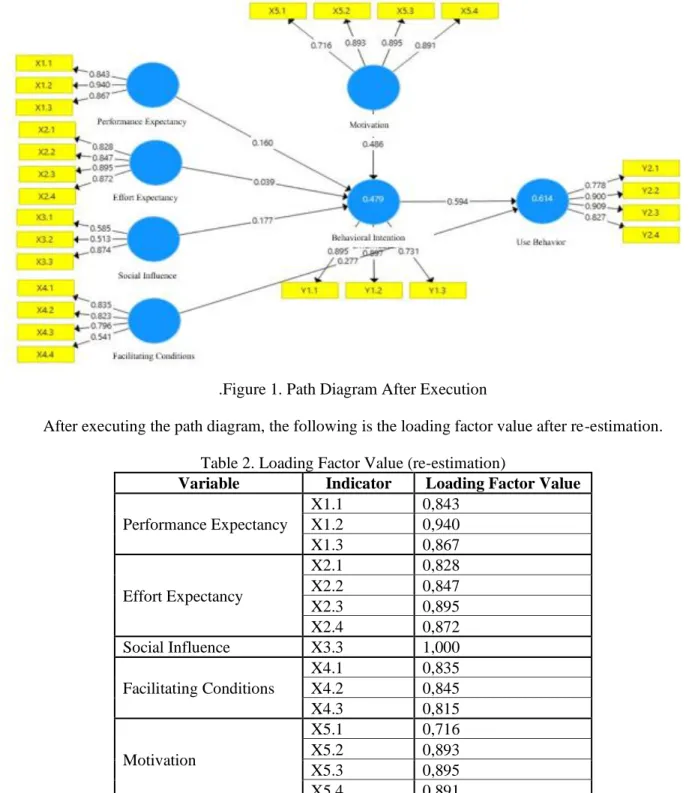
The following is the result of the loading factor of each indicator that will be displayed on the path diagram, which can be seen in Figure 1.
http://infor.seaninstitute.org/index.php/infokum/index
JURNAL INFOKUM, Volume 9, No. 2, Juni 2021
ISSN :2302-9706
INFOKUM is licensed under a Creative Commons Attribution-Non Commercial 4.0
International License (CC BY-NC 4.0)
494
.Figure 1. Path Diagram After ExecutionAfter executing the path diagram, the following is the loading factor value after re-estimation. Table 2. Loading Factor Value (re-estimation)
Variable Indicator Loading Factor Value Performance Expectancy X1.1 0,843 X1.2 0,940 X1.3 0,867 Effort Expectancy X2.1 0,828 X2.2 0,847 X2.3 0,895 X2.4 0,872 Social Influence X3.3 1,000 Facilitating Conditions X4.1 0,835 X4.2 0,845 X4.3 0,815 Motivation X5.1 0,716 X5.2 0,893 X5.3 0,895 X5.4 0,891
Behavioral Intention Y1.1 0,895
http://infor.seaninstitute.org/index.php/infokum/index
JURNAL INFOKUM, Volume 9, No. 2, Juni 2021
ISSN :2302-9706
INFOKUM is licensed under a Creative Commons Attribution-Non Commercial 4.0
International License (CC BY-NC 4.0)
495
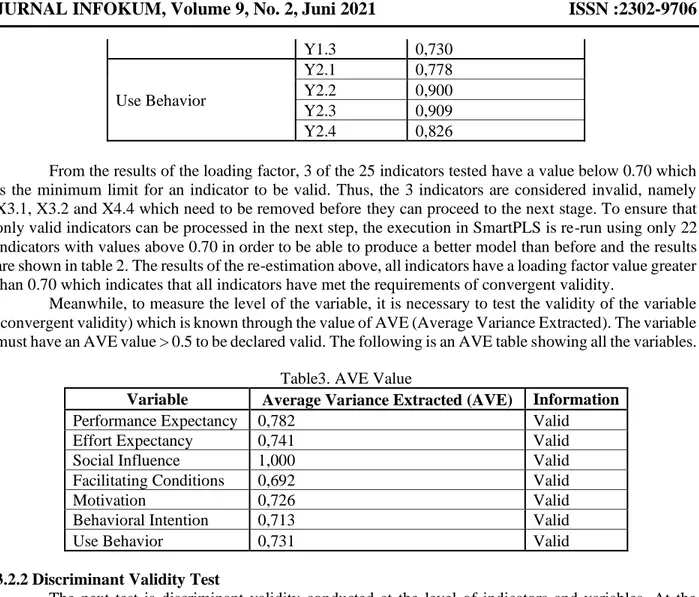
Y1.3 0,730 Use Behavior Y2.1 0,778 Y2.2 0,900 Y2.3 0,909 Y2.4 0,826From the results of the loading factor, 3 of the 25 indicators tested have a value below 0.70 which is the minimum limit for an indicator to be valid. Thus, the 3 indicators are considered invalid, namely X3.1, X3.2 and X4.4 which need to be removed before they can proceed to the next stage. To ensure that only valid indicators can be processed in the next step, the execution in SmartPLS is re-run using only 22 indicators with values above 0.70 in order to be able to produce a better model than before and the results are shown in table 2. The results of the re-estimation above, all indicators have a loading factor value greater than 0.70 which indicates that all indicators have met the requirements of convergent validity.
Meanwhile, to measure the level of the variable, it is necessary to test the validity of the variable (convergent validity) which is known through the value of AVE (Average Variance Extracted). The variable must have an AVE value > 0.5 to be declared valid. The following is an AVE table showing all the variables.
Table3. AVE Value
Variable Average Variance Extracted (AVE) Information
Performance Expectancy 0,782 Valid
Effort Expectancy 0,741 Valid
Social Influence 1,000 Valid
Facilitating Conditions 0,692 Valid
Motivation 0,726 Valid
Behavioral Intention 0,713 Valid
Use Behavior 0,731 Valid
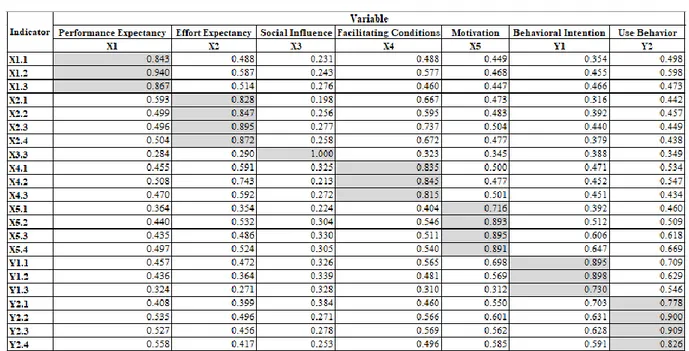
3.2.2 Discriminant Validity Test
The next test is discriminant validity conducted at the level of indicators and variables. At the indicator level states that no indicator provides loading to another variable higher than the variable should be. Another name that is often used is cross loading. The following are the results of discriminant validity. Based on the table below, the results of the cross loading value marked in gray indicate that the correlation value of the variable with the indicator has a higher value than the correlation value of other variables. It can be concluded that all indicators that have the highest value on their own variables are compared with values on other variables so that all indicators are declared valid.
http://infor.seaninstitute.org/index.php/infokum/index
JURNAL INFOKUM, Volume 9, No. 2, Juni 2021
ISSN :2302-9706
INFOKUM is licensed under a Creative Commons Attribution-Non Commercial 4.0
International License (CC BY-NC 4.0)
496
3.2.3 Reliability TestThe reliability test was carried out at the variable level using Cronbach's Alpha and Composite Reliability. This test is done by looking at the value of Cronbach's Alpha must be > 0.7 and the Composite Reliability value must be > 0.7 so that it can be said to be reliable. The results of the variables can be seen in the table below.
Table 5. Cronbach's Alpha and Composite Reliability Value Variable Cronbach's
Alpha Composite Reliability Information Performance
Expectancy 0,861 0,915 Reliable
Effort Expectancy 0,884 0,920 Reliable
Social Influence 1,000 1,000 Reliable
Facilitating Conditions 0,779 0,871 Reliable
Motivation 0,873 0,913 Reliable
Behavioral Intention 0,798 0,881 Reliable
Use Behavior 0,876 0,916 Reliable
3.3 Evaluation of the Structural Model (Inner Model)
Evaluation of the structural model (inner model) was carried out to see the level of significance of the relationship between the dependent variable and the independent variable as seen in Table 6.
http://infor.seaninstitute.org/index.php/infokum/index
JURNAL INFOKUM, Volume 9, No. 2, Juni 2021
ISSN :2302-9706
INFOKUM is licensed under a Creative Commons Attribution-Non Commercial 4.0
International License (CC BY-NC 4.0)
497
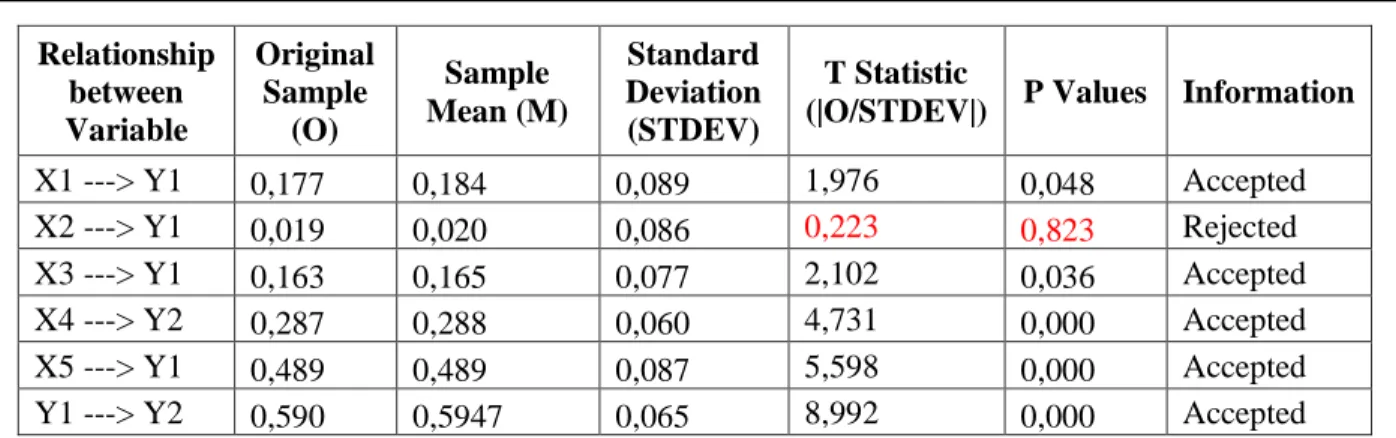
Relationship between Variable Original Sample (O) Sample Mean (M) Standard Deviation (STDEV) T Statistic(|O/STDEV|) P Values Information
X1 ---> Y1 0,177 0,184 0,089 1,976 0,048 Accepted X2 ---> Y1 0,019 0,020 0,086 0,223 0,823 Rejected X3 ---> Y1 0,163 0,165 0,077 2,102 0,036 Accepted X4 ---> Y2 0,287 0,288 0,060 4,731 0,000 Accepted X5 ---> Y1 0,489 0,489 0,087 5,598 0,000 Accepted Y1 ---> Y2 0,590 0,5947 0,065 8,992 0,000 Accepted
Based on the table above, performance expectancy (X1), social influence (X3) and motivation (X5) have a significant effect on behavioral intention (Y1) because the T-Statistic value is > 1.96 and the P-Value value is <0.05. For facilitating conditions (X4) and behavioral intention (Y1) affect use behavior (Y2). Meanwhile, effort expectancy (X2) has no significant effect on behavioral intention (Y1) because it does not meet the requirements for T-Statistics > 1.96 and P-Value <0.05, shown in red font.
The value of R-Square (R2) of the dependent variables (Y) in this case behavioral intention (Y1) and use behavior (Y2) was used to assess the explanatory power of the model used in the study. Table 7 shows the R-Square for the following dependent variables:
Table 7. R-Square Value (R2)
Variable R-Square (R2)
Behavioral Intention (Y1) 0,474
Use Behavior (Y2) 0,618
Based on the results of the R-Square (R2), it shows that behavioral intention (Y1) has a value of 47.4%, where use behavior (Y1) is influenced by the variables of performance expectancy (X1), social influence (X3) and motivation (X5), while 52.6% caused by other variables that were not studied or outside this study.
Use behavior (Y2) has an R-Square (R2) value of 61.8%, indicating that there is an effect of facilitating conditions (X4) and behavioral intention (Y1). While the remaining value of 38.2% is the influence of other variables not examined or outside this study.
3.4 Discussion
In this section, hypothesis examining is explained as follows:
1. Hypothesis 1: The effect of performance expectations (X1) on behavioral intention (Y1) using cloud computing in SMEs
The performance expectancy variable (X1) in this study has a positive and significant effect on the behavioral intention (Y1) cloud computing in SMEs. This is because cloud computing technology can be useful for SME business players, can help effectiveness in terms of product or service promotion, some SMEs provide cashless payments to their customers. In addition, in order to maintain productivity at work, virtual cloud technology is needed for business activities during the COVID-19 pandemic.
http://infor.seaninstitute.org/index.php/infokum/index
JURNAL INFOKUM, Volume 9, No. 2, Juni 2021
ISSN :2302-9706
INFOKUM is licensed under a Creative Commons Attribution-Non Commercial 4.0
International License (CC BY-NC 4.0)
498
2. Hypothesis 2: The effect of effort expectancy (X2) on behavioral intention (Y1) using cloud computingin SMEs.
The effort expectancy variable (X2) has no significant effect on the bahavioral intention (Y1) using cloud computing for SMEs. This is because some SME business people have difficulty in the early use of cloud computing technology. Some of the features in it require more effort and understanding for the user. As a result of the obstacles and difficulties of users so that they do not have an influence on the interest in utilization or the intention to use cloud computing technology.
3. Hypothesis 3: The effect of social influence (X3) on behavioral intention (Y1) using cloud computing in SME
The social influence variable (X3) has a positive and significant effect on the behavioral intention (Y1) using cloud computing in SMEs. This is because facilitating conditions around the user have an effect on social influences. Cloud computing information is also widely known from the experiences of others who use it. During the COVID-19 pandemic, the influence of fellow business partners is very large for those who have not used it, so the influence on intention in using cloud computing technology makes a big contribution.
4. Hypothesis 4: The effect of facilitating conditions (X4) on use behavior (Y2) using cloud computing in SMEs
The facilitating conditions variable (X4) has a positive and significant effect on the use behavior using (Y2) cloud computing in SMEs. This is because user perception is strongly influenced by devices that support cloud computing technology and are also compatible when run with other systems from devices. Some users who take advantage of cloud computing from the provider also feel that there is support in its use, where technicians and service availability are still there in carrying out their business activities. The existence of complete facilities that support the use of the system or technology will be increasingly accepted and used by users.
5. Hypothesis 5: The effect of motivation (X5) on behavioral intention (Y1) using cloud computing in SMEs
The motivation variable (X5) has a positive and significant effect on behavioral intention (Y1) using cloud computing in SMEs. This is because during the COVID-19 pandemic, there are adjustments and needs that need to be made in SME business activities. As a result of such circumstances and conditions, SMEs are motivated to innovate by utilizing cloud computing technology which is part of the solution to survive in running a business. This statement is also supported by the number of positive responses of 98% (agree and strongly agree) that cloud computing helps SME businesses during the COVID-19 pandemic.
6. Hypothesis 6: The effect of behavioral intention (Y1) on use behavior using cloud computing (Y2) in SMEs
The variable behavioral intention (Y1) has a significant effect on use behavior (Y2) using cloud computing in SMEs. This is supported by direct observations of researchers, that it is true that behavioral intention is influenced by behavioral intention, this can be proven by independent variables related to the dependent variable of behavioral intention (Y1), where from the test results it was found that users feel cloud computing technology facilitate and improve performance in their business activities, so that SMEs feel in the use they feel benefited. Therefore, it can be concluded that the use behavior using cloud computing technology affects the actual use for SME business people.
http://infor.seaninstitute.org/index.php/infokum/index
JURNAL INFOKUM, Volume 9, No. 2, Juni 2021
ISSN :2302-9706
INFOKUM is licensed under a Creative Commons Attribution-Non Commercial 4.0
International License (CC BY-NC 4.0)
499
4. ConclusionBased on the measurement results of the Motivation variable in the UTAUT model, users get a positive response. In addition, the tests carried out showed the results of the variables were valid (AVE > 0.5), reliable (Composite Reliability > 0.7) and acceptable (T-Statistics and P-Value were met). These results show that SME business people in Medan City have the motivation to maintain and run a business using cloud computing technology as their needs during the COVID-19 pandemic. Thus the UTAUT model used in this study shows a link between motivation and cloud computing acceptability in SMEs.
References
[1] W.-j. Guan, Z.-y. Ni, Y. Hu, W.-h. Liang, C.-q. Ou, J.-x. He, L. Liu, H. Shan and G. Zeng, "Clinical Characteristics of Coronavirus Disease 2019 in China," New England Journal of Medicine, vol. 382, no. 18, pp. 1708-1720, 2020.
[2] Tempo.com, "https://www.tempo.co/abc/5446/pemerintah-indonesia-diminta-terbuka-dan-tegas-dalam-tangani-virus-corona," Tempo Indonesia, 31 Maret 2020. [Online]. [Accessed 7 November 2020].
[3] A. K. Pakpahan, "COVID-19 dan Implikasi Bagi Usaha Mikro, Kecil, dan Menengah," Jurnal Ilmiah Hubungan Internasional, vol. 0, no. 0, pp. 59-64, 2020.
[4] B. Pasaribu, "Medan Bisnis Daily," 6 May 2020. [Online]. Available:
https://medanbisnisdaily.com/news/online/read/2020/05/06/107409/672_000_umkm_dan_7_700_ko perasi_di_sumut_merugi_akibat_corona/. [Accessed November 2020].
[5] V.-H. L. G. W.-H. T. T.-S. H. J.-J. H. Keng-Boon Ooi, "Cloud computing in manufacturing: The next industrial revolution in Malaysia?," Experts System with Applications, vol. 93, pp. 376-394, 2018.
[6] E. R. Chaldun, G. Yudoko, E. A. Prasetio and J. Setiawan, "Motivation of indonesian culinary SMEs to engage in international markets," Systematic Reviews in Pharmacy, vol. 11, no. 12, pp. 276-282, 2020.
[7] W. l. Hardilawati, "Strategi Bertahan UMKM di Tengah Pandemi Covid-19," Jurnal Akuntansi dan Ekonomika, vol. 10, no. 1, pp. 89-98, 2020.
[8] J. Sultana, "Determining the factors that affect the uses of Mobile Cloud Learning (MCL) platform Blackboard- a modification of the UTAUT model," Education and Information Technologies, vol. 25, no. 1, pp. 223-238, 2020.
[9] M. S. Hartawan, "Analisis Faktor Pengaruh Penggunaan Aplikasi Mobile Menggunakan Unified Theory Acceptance and Use of Technology ( Utaut )," Jurnal Teknologi Informasi ESIT Vol., vol. XIV, no. 03, pp. 1-5, 2019.
[1 0]
T. I. Wahidar, "EFEKTIVITAS INSTAGRAM TERHADAP KEPUTUSAN BERKUNJUNG KE DESA WISATA BULUHCINA (STUDI DESKRIPTIF KUANTITATIF TERHADAP AKUN INSTAGRAM @DESABULUHCINA)," Jurnal Ilmu Komunikasi, vol. 9, no. 2, pp. 186-200, 2019. [1
1]
F. Deviani, D. Rochdiani and B. R. Saefudin, "ANALISIS FAKTOR-FAKTOR YANG
http://infor.seaninstitute.org/index.php/infokum/index
JURNAL INFOKUM, Volume 9, No. 2, Juni 2021
ISSN :2302-9706
INFOKUM is licensed under a Creative Commons Attribution-Non Commercial 4.0
International License (CC BY-NC 4.0)
500
LEMBANG AGRI KABUPATEN BANDUNG BARAT," Jurnal Sosial Ekonomi dan Kebijakan Pertanian, vol. 3, no. 2, pp. 165-173, 2019.[1 2]
A. M. Yusuf, "Pengertian Variabel," in Metode Penelitian Kuantitatif, Kualitatif & Penelitian Gabungan,
https://books.google.co.id/books?id=RnA-DwAAQBAJ&printsec=frontcover&hl=id#v=onepage&q&f=false, KENCANA, 2017, p. 102. [1
3]
H. Wang, D. Tao, N. Yu and X. Qu, "Understanding consumer acceptance of healthcare wearable devices: An integrated model of UTAUT and TTF," International Journal of Medical Informatics, vol. 139, no. February, 2020.
[1 4]
N. F. Richter, S. Schubring, S. Hauff and C. M. Ringle, "When predictors of outcomes are necessary: guidelines for the combined use of PLS-SEM and NCA," Industrial Management and Data Systems, vol. 3, 2020.
[1 5]
K. Al-Saedi, M. Al-Emran, T. Ramayah and E. Abusham, "Developing a general extended UTAUT model for M-payment adoption," Technology in Society, vol. 62, no. September, p. 101293, 2020. [1
6]
R. Hoque and G. Sorwar, "Understanding factors influencing the adoption of mHealth by the elderly: An extension of the UTAUT model," International Journal of Medical Informatics, vol. 101, no. 75-84, 2017.
[1 7]
S. Hu, K. Laxman and K. Lee, "Exploring factors affecting academics’ adoption of emerging mobile technologies-an extended UTAUT perspective," Education and Information Technologies, 2020. [1
8]
S. C. Manley, J. F. H. Jr and R. I. W. Jr., "Essential new PLS-SEM analysis methods for your entrepreneurship analytical toolbox," International Entrepreneurship and Management Journal, 2020.
[1 9]
M. Waluyo, Mudah Cepat Tepat Penggunaan Tools AMOS dalam Aplikasi SEM, Surabaya: UPN “Veteran” Jawa Timur, 2016.