Optimal feeding of
low-birth-weight infants
TECHNICAL REVIEW
For further information please contact:
Department of Child and Adolescent Health and Development (CAH)
World Health Organization
20 Avenue Appia, 1211 Geneva 27, Switzerland
Tel +41 22 791-3281 Fax + 41 22 791-4853 Email [email protected]
Web site http://www.who.int/child-adolescent-health
O
P
TI
M
A
L F
E
ED
ING O
F L
O
W-B
IR
TH
-W
EI
G
HT I
NF
A
NT
S
: TE
C
H
N
IC
A
L R
E
V
IE
W
W
H
O
Optimal feeding of
low-birth-weight infants
TECHNICAL REVIEW
Karen Edmond, MBBS, MSc (Epidemiology), PhD
London School of Hygiene and Tropical Medicine,
London, U.K.
Rajiv Bahl, MD, PhD
WHO Library Cataloguing-in-Publication Data
Edmond, Karen.
Optimal feeding of low-birth-weight infants : technical review / Karen Edmond, Rajiv Bahl.
1.Infant nutrition. 2.Infant, Low birth weight. 3.Nutritional requirements. 4.Feeding methods. 5.Infant food. I.Bahl, Rajiv. II.World Health Organization. III.Title.
ISBN 92 4 159509 4 (NLM classification: WS 120) ISBN 978 92 4 159509 4
© World Health Organization 2006
All rights reserved. Publications of the World Health Organization can be obtained from WHO Press, World Health Organization, 20 Avenue Appia, 1211 Geneva 27, Switzerland (tel.: +41 22 791 3264; fax: +41 22 791 4857; e-mail: [email protected]). Requests for permission to reproduce or translate WHO publications – whether for sale or for noncommercial distribution – should be addressed to WHO Press, at the above address (fax: +41 22 791 4806; e-mail: [email protected]).
The designations employed and the presentation of the material in this publication do not imply the expression of any opinion whatsoever on the part of the World Health Organization concerning the legal status of any country, territory, city or area or of its authorities, or concerning the delimitation of its frontiers or boundaries. Dotted lines on maps represent approximate border lines for which there may not yet be full agreement.
The mention of specific companies or of certain manufacturers’ products does not imply that they are endorsed or recommended by the World Health Organization in preference to others of a similar nature that are not men-tioned. Errors and omissions excepted, the names of proprietary products are distinguished by initial capital letters.
All reasonable precautions have been taken by the World Health Organization to verify the information con-tained in this publication. However, the published material is being distributed without warranty of any kind, either expressed or implied. The responsibility for the interpretation and use of the material lies with the reader. In no event shall the World Health Organization be liable for damages arising from its use.
The named authors alone are responsible for the views expressed in this publication.
Contents
Acknowledgments vii
Abbreviations viii
Executive summary 1
Introduction 7
Methods 9
Results 12
1. Background 12
1.1 Physiological principles of feeding LBW infants 12
1.2 Nutritional requirements 14
1.3 Nutritional sources for LBW infants 14
1.4 Development of feeding ability 23
2. Nutrition 25
2.1 Human milk 25
2.2 Human milk supplementation 39
2.3 Breastmilk substitutes 56
3. Feeding methods 62
3.1 Oral feeding 62
3.2 Intragastric feeding 64
4. Feeding schedules 69
4.1 Initiation of enteral feeding 69
4.2 Progression and scheduling of enteral feeding 74
5. Support 79
5.1 Supportive care for the LBW infant 79
5.2 Support for the breastfeeding mother 90
6. Monitoring 94
6.1 Blood glucose monitoring 94
6.2 Growth monitoring 95
7. Feeding infants of HIV-positive mothers 99
Annex 1. Definitions 101
Annex 2. Levels of evidence 103
Annex 3. Sources and quality of evidence 104
List of boxes
1.2.1 Recommended daily nutrient allowances for pre-term infants
>1000 grams at birth 15
1.3.1 Concentration of nutrients in transitional and mature pre-term
human milk compared with mature term milk 16
1.3.2 Nutrient composition of multivitamin supplement formulations 19
1.3.3 Nutrient composition of multicomponent commercial human
milk fortifiers 19
1.3.4 Nutrient composition of standard and pre-term infant formulas 21
1.3.5 Nutrient composition of nutrient-enriched “post-discharge” formulas 22
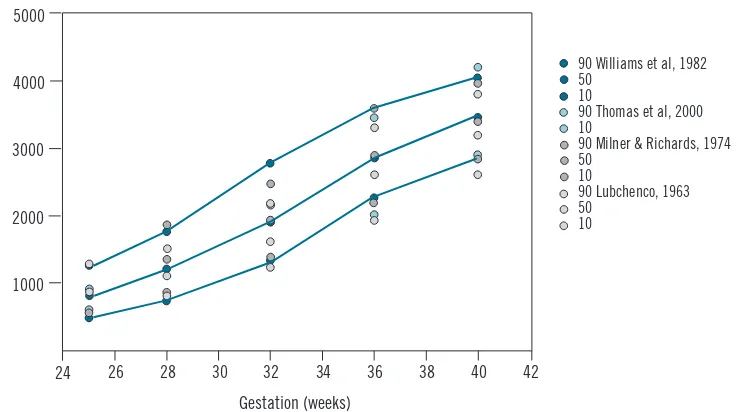
6.2.1 Reference data for size at birth 96
6.2.2 Reference data for postnatal growth of LBW infants with optimal
nutritional management 98
List of figures
1.1.1 Average composition of weight gain of a reference fetus during four
successive 4-week intervals 12
1.1.2 Age-related changes of total body water and its compartments
(intra- and extracellular) from fetal life until adolescence 12
1.1.3 Energy intake and nitrogen retention according to protein intake
in pre-term infants 14
6.2.1 Average body weight versus post-menstrual age in weeks 95
6.2.2 Comparison of growth references for pre-term infants 98
List of summary tables of key studies
2.1.1 Effects of mother’s own milk compared with formula feeding on
infection or necrotising enterocolitis in low birth weight (LBW) infants 28 2.1.2 Effects of mother’s own milk compared with formula feeding on
neurodevelopment in LBW infants 29
2.1.3 Effects of donor human milk compared with formula feeding on
infection or necrotising enterocolitis in LBW infants 32
2.1.4 Effects of donor human milk compared with formula feeding on
neurodevelopment in LBW infants 33
2.1.5 Effects of donor human milk compared with formula feeding on
feed tolerance in LBW infants 33
2.1.6 Effects of exclusive breastfeeding (EBF) duration on
neurodevelopment in LBW infants 36
2.1.7 Effects of EBF duration on growth outcomes in LBW infants 37
2.1.8 Effects of EBF duration on iron-deficiency anaemia in LBW infants 38 2.2.1 Effects of Vitamin A supplementation on mortality in LBW infants 40 2.2.2 Effects of iron supplementation of breastfed LBW infants on iron
status in the first 6 months of life 44
2.2.3 Effects of zinc supplementation of breastfed LBW infants on mortality 46 2.2.4 Effects of zinc supplementation of breastfed LBW infants on serious
2.2.5 Effects of zinc supplementation of breastfed LBW infants on
neurodevelopment 48
2.2.6 Effects of zinc supplementation of breastfed LBW infants on growth
outcomes in LBW infants 48
2.2.7 Effects of multi-component fortification of human milk on mortality
in LBW infants 52
2.2.8 Effects of multi-component fortification of human milk on
necrotising enterocolitis in LBW infants 53
2.2.9 Effects of multi-component fortification of human milk on
neurodevelopment in LBW infants 54
2.2.10 Effects of multi-component fortification of human milk on growth
outcomes in LBW infants 54
2.3.1 Effects of pre-term formula compared with standard infant formula given from birth until LBW infants attained a weight of 2000 g on
neurodevelopment 58
2.3.2 Effects of pre-term formula compared with standard infant formula
on growth outcomes in LBW infants 58
2.3.3 Effects of nutrient-enriched post-discharge formula compared with
standard infant formula on neurodevelopment in LBW infants 60
2.3.4 Effects of nutrient-enriched post-discharge formula compared with
standard infant formula on growth in LBW infants 61
3.1.1 Effects of cup feeding compared with bottle feeding on breastfeeding
patterns in LBW infants 63
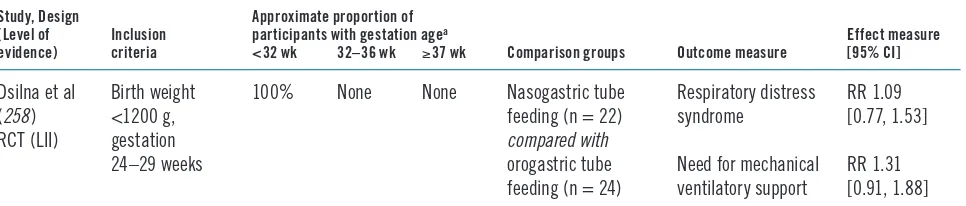
3.2.1 Effects of nasogastric compared with orogastric tube feeding on feeding
patterns in LBW infants 65
3.2.2 Effects of nasogastric compared with orogastric tube feeding on
physiological parameters in LBW infants 66
3.2.3 Effects of continuous feeding compared with bolus feeding on
necrotising enterocolitis in LBW infants 68
3.2.4 Effects of continuous feeding compared with bolus feeding on growth
in LBW infants 68
3.2.5 Effects of continuous compared with bolus feeding on respiratory
complications in LBW infants 69
4.1.1 Effects of initiation of maintenance enteral feeds in the first
24 hours of life on mortality rates in LBW infants 72
4.1.2 Effects of initiation of maintenance enteral feeds in the first 24 hours
of life on growth outcomes in LBW infants 73
4.1.3 Effects of initiation of maintenance enteral feeds in the first 24 hours
of life on biochemical measures in LBW infants 73
4.2.1 Effects of rapid compared with slow feeding progression on necrotising
enterocolitis in LBW infants 76
4.2.2 Effects of rapid compared with slow feeding progression on growth
outcomes in LBW infants 76
4.2.3 Effects of rapid compared with slow feeding progression on time to
reach full enteral feeds in LBW infants 77
5.1.1 Effects of kangaroo mother care compared with conventional care on
5.1.2 Effects of kangaroo mother care compared with conventional care
on severe morbidity in LBW infants 83
5.1.3 Effects of kangaroo mother care compared with conventional care
on neurodevelopment in LBW infants 83
5.1.4 Effects of kangaroo mother care compared with conventional care on
breastfeeding patterns in LBW infants 84
5.1.5 Effects of non-nutritive sucking compared with conventional care
on growth outcomes in LBW infants 85
5.1.6 Effects of non-nutritive sucking compared with conventional care on
hospitalization rates in LBW infants 85
5.1.7 Effects of early compared with conventional discharge of LBW infants
on re-hospitalization rates after discharge 88
5.1.8 Effects of early compared with conventional discharge of LBW infants
on growth outcomes after discharge 89
5.2.1 Effects of breastfeeding counselling on growth outcomes in
LBW infants 91
5.2.2 Effects of breastfeeding counselling on breastfeeding patterns
Acknowledgements
M
any individuals made significant contributions to this document: Saadet Arsan, Zulfiqar Bhutta, Jane Hawdon, Michael Kramer, Sandra Lang, Joy Lawn, Indira Narayanan, Vinod Paul, Felicity Savage, Richard Schanler, Nalini Singhal, and Anthony Williams.Special thanks are also due to Reginald Tsang and Tim Mullican for allowing pre-publication access to: Tsang RC, Uauy R, Koletzko B, Zlotkin SH. Nutrition of the preterm infant: scientific basis and practical guidelines, 2nd ed. Cincinnati, OH, Digital Educational Publishing, 2005; and the Cochrane Neonatal Collaborative Review Group for providing lists of relevant systematic reviews and randomized controlled trials.
Abbreviations
AGA Appropriate for gestational age
CI Confidence interval
CMV Cytomegalovirus
DBM Drip breastmilk
EBF Exclusive breastfeeding
EBM Expressed breastmilk
ERSL Estimated renal solute load
FAO Food and Agriculture Organization
HIV Human immunodeficiency virus
HR Hazard ratio
IDA Iron-deficiency anaemia
IQ Intelligence quotient
IU International units
IUGR Intrauterine growth restriction/retardation
KMC Kangaroo mother care
LBW Low birth weight
MD Mean difference
MTCT Mother-to-child transmission of HIV
NCHS National Centers for Health Statistics
OR Odds ratio
PRSL Potential renal solute load
RCT Randomized controlled trial
RD Risk difference
RNI Recommended nutrient intake
RR Relative risk
SGA Small for gestational age
TPN Total parenteral nutrition
UNICEF United Nations Children’s Fund
VLBW Very low birth weight
WHO World Health Organization
WMD Weighted mean difference
Executive summary
L
ow birth weight (LBW) has been defined by the World Health Organization (WHO) as a weight at birth less than 2500 grams. The global prevalence of LBW is 15.5%, which means that about 20.6 million such infants are born each year, 96.5% of them in developing countries (1). There is significant variation in LBW incidence rates across the United Nations regions, with the highest incidence in South-Central Asia (27.1%) and the lowest in Europe (6.4%).Low birth weight can be a consequence of pre-term birth (i.e. before 37 completed weeks of gestation), or due to small size for gestational age (SGA, defined as weight for gestation <10th percentile), or both. In addition, depending on the birth weight reference used, a variable but small proportion of LBW infants are born at term and are not small for gestational age. Intrauterine growth retardation, defined as a slower than normal rate of fetal growth, is usually responsible for SGA. Low birth weight thus defines a heterogeneous group of infants: some are born early, some are born at term but are small for gestational age, and some are both born early and small for gestational age.
It is generally recognized that being born with a low birth weight is a disadvan-tage for the infant. Pre-term birth is a direct cause of 27% of the 4 million neonatal deaths that occur globally every year (2). Pre-term birth and SGA are also important indirect causes of neonatal deaths. Low birth weight directly or indirectly may con-tribute up to 60–80% of all neonatal deaths (2). LBW infants are at higher risk of early growth retardation, infectious disease, developmental delay and death during infancy and childhood (3, 4).
Countries can substantially reduce their infant mortality rates by improving the care of low birth weight infants. Experience from both developed and developing countries has clearly shown that appropriate care of LBW infants, including feed-ing, temperature maintenance, hygienic cord and skin care, and early detection and treatment of infections can substantially reduce mortality in this highly vulnerable group. Interventions to improve feeding are likely to improve the immediate and longer-term health and wellbeing of the individual infant and to have a significant impact on neonatal and infant mortality levels in the population. Better feeding of pre-term babies was one of the first interventions in the 1960s in the UK and was associated with reduced case fatality for pre-term babies in hospitals before the advent of intensive care (5). Community-based studies from India have shown that improved care of LBW infants can substantially improve their survival (6–8).
• Mortality • Severe morbidity • Neurodevelopment • Growth
• Other outcomes (e.g. anaemia, exclusive breastfeeding rates, feed tolerance, etc.).
Studies from developing and developed countries that included infants with a birth weight less than 2500 g or gestation less than 37 weeks were considered for inclu-sion in this review. Studies were classified into the following three groups based on the infant’s gestational age and (where this was not available) on birth weight: (i) gestational age under 32 weeks or birth weight under 1500 g, (ii) gestational age of 32–36 weeks or birth weight of 1500–1999 g, and (iii) term infants with a birth weight of 2000–2499 g. These infants are considered by many experts to be distinct risk groups requiring different specialized management (9–12). It was not possible to present the findings of most studies separately for pre-term infants who were appropriate for gestational age (AGA) from those who were small size for gestational age (SGA).
Findings of the review
What to feedChoice of milk
Breastfeeding or mother’s own expressed milk. There is strong and consistent evidence that feeding mother’s own milk to pre-term infants of any gestation is associated with a lower incidence of infections and necrotising enterocolitis, and improved neurodevelopmental outcome as compared with formula feeding. Feed-ing unsupplemented mother’s own milk to pre-term infants <1500 g resulted in slower weight and length gains, but the implications of this slower growth are unclear and there is not enough evidence to assess if it increased the risk of malnu-trition. Long-term beneficial effects of breastfeeding on blood pressure, serum lipid profile or pro-insulin levels have also been reported for pre-term infants. There are limited data on most outcomes in term LBW infants; the available data suggest that improved infection and neurodevelopmental outcomes associated with feed-ing mother’s milk in pre-term infants are also seen in this group.
Pre-term infant formula. Infants of <32 weeks gestational age who were fed pre-term infant formula had higher psychomotor developmental scores at 18 months of age than those fed standard infant formula. Although there was no overall effect observed in these children at 7½–8 years of age, the verbal intelligence quotient (IQ) scores were higher in the pre-term infant formula group among boys. Pre-term formula increases growth during the neonatal period but this is not sustained dur-ing later infancy and childhood. No long-term benefits (e.g. blood pressure, serum lipid profile or pro-insulin) have been found. There are insufficient data to draw any conclusions for pre-term infants of 32–36 weeks gestational age or for term LBW infants.
Optimal duration of exclusive breastfeeding
Overall there is no evidence to recommend a different duration of exclusive breast-feeding for pre-term or term LBW infants than for infants who are not low birth weight. Limited available data from industrialized countries suggest that early sup-plementation of breastfeeding (at about 3 months of age) with a high calorie diet in pre-term infants may marginally increase linear growth and haemoglobin levels. No data are available for other key outcomes. Among term LBW infants, the available evidence from two trials suggests that exclusive breastfeeding for 6 months, com-pared with 4 months, had no deleterious impact on neurodevelopment, growth, or haemoglobin levels, if it was accompanied by iron supplementation.
Human milk supplementation
Vitamin D. There is some evidence of reduced linear growth and increased risk of rickets in babies with a birth weight <1500 g fed unsupplemented human milk. There seems to be no consistent benefit of increasing the intake of vitamin D from the usually recommended 400 IU per day. There are no clinical trial data on the effect of vitamin D on key clinical outcomes in infants with a birth weight >1500 g.
Phosphorus and calcium. There is some evidence that phosphorus and calcium sup-plementation reduces the risk of metabolic bone disease in pre-term infants and leads to short-term increases in bone mineralization in infants with a birth weight of <1500 g. There are no data on the effect of phosphorus and calcium supplementation on key clinical outcomes in infants with a birth weight >1500 g.
Iron. Iron supplementation, started at 6–8 weeks of age in LBW infants, is effective in preventing anaemia during infancy. There is some evidence that anaemia is com-mon in LBW infants fed unsupplemented human milk even at 8 weeks of age. There is also some evidence to suggest that iron supplementation, started at 2 weeks of age, may prevent this early anaemia in infants with birth weights <1500 g. However, there are insufficient data on the safety of iron supplementation during the first two months of life. There are no data on the effects of iron supplementation on mortal-ity, common childhood illnesses or neurodevelopment in LBW infants.
Zinc. There are no data on the effect of zinc on key clinical outcomes in pre-term infants. Data from two trials in developing countries suggest that term LBW infants in developing countries may have lower mortality and morbidity if they receive zinc supplementation. There seems to be little evidence that zinc supplementation in these infants improves neurodevelopment or affects growth.
Multicomponent fortifier. In infants of <32 weeks gestation, there is evidence that use of multicomponent fortifier leads to short-term increases in weight gain, lin-ear growth, head growth and bone mineralization. There are insufficient data to evaluate the long-term neurodevelopmental and growth outcomes, although there appears to be no effect on growth beyond one year of age. Use of multicomponent fortifiers does not appear to be associated with increased risk of mortality or necro-tizing enterocolitis, although the small number of infants and the large amount of missing data in the studies reduce confidence in this conclusion. Also, in the largest trial undertaken there was a significant increase in the incidence of infection among infants receiving the fortifier. There are no data examining the efficacy of multi-component fortifier in infants of 32–36 weeks gestation or in term LBW infants.
How to feed
Feeding methods
Cup feeding compared with bottle feeding. In pre-term infants, cup feeding leads to higher rates of full (exclusive or predominant) breastfeeding, compared with bottle feeding at the time of discharge from hospital. Cup feeding was also associated with greater physiological stability, e.g. lower risk of bradycardia or desaturation, than bottle feeding. No data are available for term LBW infants. When cup feeding is cor-rectly done, i.e. with the infant upright and the milk is not poured into the mouth, there is no evidence that there is an increased risk of aspiration.
Nasogastric compared with orogastric feeding. Physiological data show that naso-gastric tubes increase airway impedance and the work of breathing in very pre-term infants, which is supported by clinical data showing an increased incidence of apnoea and desaturation.
Feeding progression
Trophic feedings or minimal enteral nutrition. Trophic feeding or minimal enteral nutrition refers to intragastric milk feeds in the first few days of life in sub-nutritional quantities, e.g. 5–10 ml/kg/day on the first day of life. A systematic review and meta-analysis of 10 randomized controlled trials (RCTs) indicate that trophic feedings in infants of <32 weeks gestation are associated with a shorter time to reach full enteral feeds and shorter duration of hospitalization. There was no significant increase in the risk of necrotising enterocolitis although the findings do not exclude an important effect. Trophic feeding is not relevant for infants of >32 weeks gestation because they usually tolerate maintenance enteral feeding from the first day of life.
Initiation of ‘maintenance’ enteral feeding. Data are available only from two control-led studies conducted in the 1960s. One of these studies showed that infants <2250 g at birth had higher mortality if given full maintenance enteral fluids starting within 2 hours of birth as compared to those given small enteral feeds starting 12–16 hours after birth. Findings from the other study in infants of <32 weeks gestation indicated that infants given IV fluids on the first day of life had lower mortality than those who received nasogastric feeds of glucose in water or those who received no feeds or fluids. No firm conclusions can be drawn from these studies. However, it appears that very pre-term infants may benefit from avoidance of full enteral feeds on the first day of life.
Progression of enteral feeding. In infants of <32 weeks gestation, faster rates of increase in feeding volumes (20–35 ml/kg/day compared with 10–20 ml/kg/day) may decrease the time to full enteral feeds and may increase weight gain. There is limited informa-tion regarding safety (broad confidence intervals for incidence of necrotising entero-colitis) and the effect on length of hospital stay. There are limited data from which to draw any conclusions about fast rates of advancement of feeding rates in infants with 32–36 weeks gestation or in term LBW infants. However, these infants are more likely to tolerate rapid feeding regimens even better than smaller more immature infants.
Demand or scheduled feeding. Demand feeding may be feasible for some infants with 32–36 weeks gestation and may reduce the length of hospitalization. No data are available for infants of <32 weeks gestation and term LBW infants.
Thermal care and support for breastfeeding
Maternal involvement in care and feeding of LBW infants. Substantial benefits in terms of improved breastfeeding rates and early discharge from hospital were reported when mothers participated in the care and feeding of their LBW infants in neonatal units.
Kangaroo mother care (KMC). In clinically stable pre-term infants with a birth weight of <2000 g, there is evidence that KMC is at least as effective as conven-tional care in reducing mortality. KMC may reduce infections and improve exclu-sive breastfeeding rates and weight gain. There are insufficient data regarding the effect of KMC in infants with birth weights <1500 g because many of these infants were excluded from the available studies as they were not considered to be clinically stable. There is preliminary evidence from resource-poor settings that KMC may be effective even in clinically unstable LBW infants including those with birth weights <1500 g. There are no data regarding the effect of KMC in term LBW infants.
Non-nutritive sucking. Non-nutritive sucking may decrease the length of hospital stay in pre-term infants but has no effect on growth outcomes in preterm infants who weigh less than 1800 g at birth. Encouraging the infant to suck on the ‘emptied’ breast, after expression of breast milk, may result in improved breastfeeding rates at discharge and at follow-up.
Breastfeeding counselling. There are few data on the effect of breastfeeding coun-selling among pre-term infants of <32 weeks gestation. Among pre-term infants of 32–36 weeks gestation and term LBW infants, breastfeeding counselling improves the rates of exclusive breastfeeding at 3 months. This finding is consistent with the results of a meta-analysis of 20 intervention trials in term normal birth weight infants.
HIV and infant feeding counselling. No studies were located which examined the impact of HIV and infant feeding counselling of HIV-positive mothers of LBW infants or the choice of milk on key clinical outcomes.
Drug therapy for enhancing lactation. The available evidence suggests that meto-clopramide or domperidone increases breastmilk volume in mothers of infants of <32 weeks gestation, particularly those who were having difficulty in maintaining milk production. There are no data regarding efficacy in the mothers of infants of 32–36 weeks gestation or for term LBW infants.
Monitoring
Blood glucose monitoring. There are no studies reporting the effects of regular blood glucose monitoring on subsequent outcomes. Limited observational data indicate that recurrent and/or prolonged blood glucose levels of <2.6 mmol/l (<45 mg/dl) are likely to be associated with poorer neurodevelopment in later life.
Introduction
Background
Low birth weight (LBW) is defined as a weight at birth less than 2500 g. The global prevalence of LBW is 15.5%, which means that about 20.6 million LBW infants are born each year; 96.5% of them are in developing countries (1). There is significant variation in LBW incidence rates across the United Nations regions:
• The highest incidence occurs in the subregion of South-Central Asia, where 27.1% of infants are born with a low birth weight. The incidence in other parts of Asia ranges from 5.9% to 15.4%.
• The incidence of LBW is 14.3% in Africa, with little variation across the region as a whole.
• Latin America and Caribbean has, on average, lower rates (10%), but in the Caribbean the level (13.7%) is almost as high as in Africa.
• About 10.5% of births in Oceania are infants with a low birth weight.
• Among the developed regions, North America averages 7.7% while Europe has the lowest regional average LBW rate at 6.4%.
Low birth weight can be a consequence of pre-term birth (i.e. before 37 completed weeks of gestation) or related to a small size for tional age (SGA, defined as weight for gesta-tion <10th percentile), or both. In addigesta-tion, depending on the birth weight reference used, a variable but small proportion of LBW infants are born at term and are not small for gestational age. Intrauterine growth retarda-tion, defined as a slower than normal rate of fetal growth, is usually responsible for SGA. Low birth weight thus defines a heterogeneous group of infants: some are born early, some are born at term but are small for gestational age, and some are born early and are small for ges-tational age.
It is generally recognized that being born with a low birth weight is a disadvantage for the infant. Pre-term birth is a direct cause of 27% of the 4 million neonatal deaths that occur globally every year (2). Pre-term birth and SGA are also important indirect causes of neonatal deaths. Low birth weight may directly or indirectly contribute to 60–80% of all neonatal deaths (2). LBW infants are at higher risk of early growth retardation, infec-tious disease, developmental delay, and death during infancy and childhood (3, 4).
Many factors affect the duration of gesta-tion and intrauterine growth. They relate to the infant, the mother, or the physical envi-ronment and play an important role in deter-mining the infant’s birth weight:
• For the same gestational age, girls weigh less than boys, firstborn infants are lighter than subsequent infants, and twins weigh less than singletons.
• Women of short stature or with a low body mass index at conception, those who live at high altitudes, and young women have smaller babies.
• Once pregnant, the mother’s lifestyle (e.g. alcohol, tobacco or drug use) and other exposures (e.g. to malaria, HIV or syphi-lis), or complications such as hyperten-sion can affect intrauterine growth and development, as well as the duration of pregnancy.
Countries can substantially reduce their infant mortality rates by improving the care of low birth weight infants. Experience from both developed and developing countries has clearly shown that appropriate care of LBW infants, including feeding, temperature main-tenance, hygienic cord and skin care, and early detection and treatment of infections can substantially reduce mortality in this highly vulnerable group. Interventions to improve feeding are likely to improve the immediate and longer-term health and wellbeing of the indi-vidual infant and to have a significant impact on neonatal and infant mortality levels in the population. Better feeding of pre-term babies was one of the first interventions in the 1960s in the UK and was associated with a reduced case fatality for pre-term babies in hospitals before the advent of intensive care (5). Com-munity-based studies from India have shown that improved care of LBW infants can sub-stantially improve their survival (6–8).
Feeding the LBW infant involves decisions about what milk to feed, what nutritional supplements to give, how to feed, how much and how frequently to feed, what support is needed, and how to monitor. Current guide-lines on feeding the LBW infant are generally based on research in developed countries and may not be applicable in developing country settings. Unlike in developed countries, where pre-term birth is the main cause of LBW, in developing countries most LBW infants are small for gestational age (SGA). Nearly 75% of all term SGA infants in the world are born in Asia, and 20% are born in Africa (13, 14). Fur-ther, many of the current feeding guidelines are not practical in resource-poor settings.
This review was designed to help the devel-opment of guidelines for feeding LBW infants, both pre-term and SGA, in first-level referral facilities in developing countries, and in the community where feasible.
Aim
n To summarize the evidence on feeding LBW infants in order to develop guidelines for feeding them in the first 6 months of life in developing country settings.
Objectives
To locate, review and summarize key stud-ies on interventions to improve the feeding of LBW infants in the first 6 months of life con-cerning:
• what milk to feed;
• what nutritional supplements to give;
• how to feed;
• how much and how frequently to feed;
• what support is needed for thermal care and breastfeeding;
• how to monitor feeding, fluid balance and growth.
n To draw conclusions and make recommen-dations for developing guidelines, taking into account the feasibility of implementing these interventions in developing country settings.
n To describe the development of feeding ability, fluid and nutritional requirements of pre-term and SGA infants, and the nutritional composition of human milk, human milk sup-plements and breastmilk substitutes.
Target audience
Methods
Inclusion criteria
Study designs
All the available literature from both devel-oped and developing countries was reviewed. They included published and unpublished sys-tematic reviews, non-syssys-tematic reviews, and randomized controlled trials (RCTs); quasi-randomized trials, cohort and case-control studies were also considered.
Definitions of participants
A pre-term infant is defined as an infant born before 37 weeks of gestation; a term infant is defined as an infant born between 37 and 41 weeks of gestation. A small for gestational age (SGA) infant is defined as an infant whose birth weight was less than the 10th centile for gestational age at birth, and an appropriate for gestational age (AGA) infant is defined as an infant whose birth weight was between the 10th centile and the 90th centile for gestational age at birth. The corrected age of the infant is defined as the age of the infant in weeks from the date of birth minus the number of weeks early that the infant was born, and the chrono-logical age of the infant is defined as the age of the infant in weeks from the date of birth with-out correcting for prematurity (9). In general, unless otherwise specified, the chronological age of the infant is used in this document.
Studies from developing and developed countries that included infants with birth weights less than 2500 g or gestation less than 37 weeks were considered for inclusion in this review. The studies were classified into the following three groups based on the infants’ gestational age and (where gestational age was not available) on birth weight: (i) gestational age under 32 weeks or birth weight less than 1500 g, (ii) gestational age of 32–36 weeks or birth weight of 1500–1999 g, and (iii) term infants with birth weights of 2000–2499 g.
This classification was used as these infants are considered by many experts to be distinct risk groups requiring different levels of specialized management (9–12). It was not possible to present the findings of most studies separately for pre-term infants who were appropriate for gestational age (AGA) from those who were small for gestational age (SGA).
Exposures or interventions
All nutritional exposures or interventions to improve feeding of LBW infants in the first 6 months of life were considered. These expo-sures and interventions were stratified into key sections: nutrition, feeding methods, feeding schedules, support, monitoring, and feeding in exceptionally difficult circumstances.
Outcome measures
The following outcome measures were consid-ered:
• mortality;
• severe morbidity (e.g. hospitalization rates, infectious disease incidence, necr-otising enterocolitis, fractures, severe iron-deficiency anaemia with haemo-globin <7 g/dl, hypoglycaemia, adult chronic disease);
• neurodevelopment;
• malnutrition (defined as wasting or stunt-ing: standard deviation score for weight-for-length or length-for-age <–2.0);
• other important outcomes (e.g. bone mineralization, feed tolerance, rates of any breastfeeding, and rates of exclusive breastfeeding).
rapid growth during the first years of life may not be associated with improved neurodevel-opment or other functional outcomes (15–18). However, a study by Victora et al did report a strong association between infant catch-up growth ≥0.66 SD and a lower incidence of hospital admissions in a cohort of Brazilian term SGA infants (19). On the other hand, rapid catch-up growth has been reported to be associated with obesity, hypertension, coro-nary mortality and morbidity, and impaired glucose tolerance during adult life (20–27). A study from Finland suggested that weight gain during infancy was associated with a reduced risk of coronary heart disease during adult life irrespective of size at birth, but after 1 year of age rapid weight gain in infants who were thin at birth was associated with an increased risk of coronary heart disease (28). Other studies have indicated that rapid weight gain after 2 years of age is associated with increased risk (29, 30).
Search strategy for identification
of studies
The search strategy included the following search terms: LBW, preterm, premature, SGA, intrauterine growth restriction/retardation (IUGR), mortality, breastfeeding, and human milk. The electronic databases used were the Cochrane database of systematic reviews of RCTs, the Cochrane controlled trials register, the Cochrane database of abstracts of reviews of effectiveness (DARE), the Cochrane neona-tal collaborative review group specialized reg-ister, MEDLINE (1966 to 2005), and EMBASE (1966 to 2005). The following sources were also accessed: reference lists of articles, per-sonal communications, technical reports, conference proceedings, review articles, books and dissertations, and experts in the field. In addition, a number of key journals were hand searched. Every effort was also made to iden-tify relevant non-English language articles and abstracts.
Data collection
For all studies a standardized form was used to extract relevant information from the available sources. Systematically extracted data included: study location, author, year of publication, design, participants, sample size, type of intervention or exposure, type of control group, follow-up, outcome measures, and results (including the effect of measures and tests of statistical significance, where pos-sible). Where results adjusted for potential confounders were available, particularly for observational studies, they were used in pref-erence to unadjusted results. Where results adjusted for potential confounders were not available, unadjusted results were used. When data were not provided, attempts were made to contact the investigators; secondary sources were used and references included.
Data analysis
All identified studies were initially exam-ined to assess whether they related to feeding of LBW infants. The studies were stratified according to type of intervention or exposure, study design, birth weight, and gestational age where possible. Data were tabulated and viewed descriptively. Effects were expressed as relative risks (RR) or odds ratios (OR) for cat-egorical data, and as mean differences (MD) or weighted mean differences (WMD) for continuous data where possible.
Level of evidence for efficacy
and safety
Levels of evidence were rated according to the following scale for both efficacy and safety (US Preventative Services Task Force 1989).
I Evidence obtained from a systematic review of all relevant randomized con-trolled trials
II Evidence obtained from at least one properly designed randomized control-led trial
III-2 Evidence obtained from comparative studies with concurrent controls and allocation not randomized (cohort stud-ies), case-control studies, or interrupted time series with a control group
III-3 Evidence obtained from comparative studies with historical control, two or more single-arm studies, or interrupted time series without a parallel control group
IV Evidence obtained from case series, either post-test or pre-test and post-test
Conclusions and implications
Level of evidence and study design were first considered. This was then followed by assess-ment of the limitations, internal and external validity and the wider implications of each study. Implications for guideline develop-ment were considered and the need for further research stated.Recommendations
Consensus statements and expert commit-tee reports were then sought and clearly acknowledged. Experts in the field were also contacted and information about standard practice in neonatal units and health facilities was obtained. Recommendations based on the review evidence were then formulated.
Structure of the document
Interventions are considered in chronological order, stratified into sections (nutrition, feed-ing methods, feedfeed-ing schedules, support, mon-itoring, and feeding of infants of HIV-positive mothers), and key issues are considered for each intervention. Key studies are listed and described according to outcome. This is fol-lowed by conclusions and assessment of impli-cations. Recommendations are then discussed and key implications for developing country settings.
Limitations of this review
Results
1. BACKGROUND
1.1 Physiological principles of feeding LBW infants
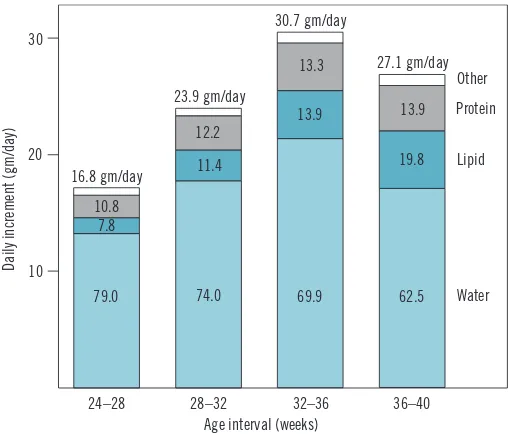
Body compositionThe composition of weight gained by the fetus varies with gestational age. About 80% of all weight gained between 24 and 28 weeks of gestation is water, but this proportion decreases to about 60% between 36 and 40 weeks. On the other hand, a greater proportion of weight gained near term is in the form of fat, increasing from about 8% during 24–28 weeks to nearly 20% during 36–40 weeks gesta-tion (31) (see Figure 1.1.1).
The total body water as a percentage of body weight in the fetus decreases rapidly dur-ing the last trimester and in the first few days after birth. The decrease is because of reduc-tion in extracellular water and somewhat compensated by a corresponding increase in intra-cellular water. This loss of body water after birth is responsi-ble for the physiological weight loss seen after birth and is more pronounced in pre-term infants (5–15% of birth weight) than in term infants (3–5% of birth weight) (32, 33) (see Figure 1.1.2).
Fluid requirements
Key physiological considera-tions for calculating the fluid requirements in the first week of life are:
Figure 1.1.1 Average composition of weight gain of a reference fetus
during four successive 4-week intervals (31)
24–28 28–32 32–36 36–40 Other Protein
Lipid
Water
Age interval (weeks) 30
20
10
Daily increment (gm/day)
79.0 74.0 69.9 62.5 7.8
11.4
13.9
19.8
10.8
12.2
13.3
13.9 30.7 gm/day
16.8 gm/day
23.9 gm/day
27.1 gm/day
Age 100
60
30
Percentage of body weight
90
80
70
50
40
20
10
0 3 6 9 0 3 6 9 1 3 6 7 9 11 13 15
Lunar months Months Years Adults
Body water compartments
Total body water Extracellular water Intracellular water
Figure 1.1.2 Age-related changes of total body water and its
compartments (intra- and extracellular) from fetal life until adolescence
• postnatal physiological changes: 5–10 ml/kg/day water loss in the first 3–4 days for infants >1500 g and 20 ml/kg for those <1500 g (does not need to be replaced);
• insensible water loss: 20 ml/kg/day for infants >1500 g and 40–60 ml/kg/day for those <1500 g;
• urine output: 50–70 ml/kg/day for the first 3 days and 70–100 ml/kg thereafter;
• stool losses: 10 ml/kg after the first 3 days.
It is usual clinical practice therefore to provide infants weighing <1500 g with about 80 ml/ kg for the first day of life and increase fluids by about 10–15 ml/kg/day to a maximum of 160 ml/kg/day by the end of the first week of life. Similarly, LBW infants >1500 g are usu-ally given about 60 ml/kg for the first day of life and the fluid intake is increased by about 15–20 ml/kg/day to a maximum of 160 ml/kg/ day by the end of the first week of life (33–35). There is some evidence that further restric-tion of fluids for LBW infants weighing <2000 g may be beneficial but needs to be balanced against the risk of dehydration. A meta-analy-sis of studies comparing restricted with liberal fluid regimens demonstrated that restricted fluid regimens are associated with a reduced risk of patent ductus arteriosus, necrotising enterocolitis and death (36). The four stud-ies included in the meta-analysis enrolled a total of over 400 premature infants with birth weights ranging from 750 to 2000 grams. Two of the studies examined fluid regimens during the first week of life, while the other two did so up to the end of the neonatal period. The restricted fluid regimens examined in the stud-ies ranged from 50 to 70 ml/kg on day 1, 60–70 ml/kg on day 3, and 80–90 ml/kg on day 5. The corresponding ranges for liberal fluid regimens were 80–150 ml/kg on day 1, 120–150 ml/kg on day 3, and 140–150 ml/kg on day 5. Restricted fluid regimens were found to be associated with a lower risk of patent ductus arteriosus (RR 0.40, 95%CI 0.26, 0.63), necrotising ente-rocolitis (RR 0.30, 95%CI 0.13, 0.71), and death (RR 0.52, 95%CI 0.28, 0.96), but there was a non-significant trend towards increased risk of dehydration (RR 2.43, 95%CI 0.71 to 8.28).
Use of radiant warmers for temperature maintenance and phototherapy for treatment of neonatal jaundice each increased the fluid requirements by about 10 ml/kg/day (37, 38).
Energy balance
Part of energy intake is lost in the urine and stools. The remaining metabolizable energy is either expended to support basal metabolism, activity, synthesis or thermoregulation or is stored in the form of protein and fat. The total energy needs for growth are about 4–6 kcal for each gram of weight gain (39).
The energy needs for pre-term infants dur-ing the first week of life are about 70–80 kcal/ kg/day, increase to 105–135 kcal/kg/day from the second week of life until term, and then decrease to 100–120 kcal/kg/day. Similarly, protein requirements during the first week are 1.0–3.0 g/kg/day, increase to 3.0–3.5 g/kg/day from the second week of life up to term, and then decrease to about 2 g/kg/day.
Growth in premature infants can be limited by both energy and protein intake. Protein intake is not relevant at low levels of energy intake. However, once an energy intake of 90–100 kcal/kg per day is reached, nitrogen retention can be limited if the protein intake is low (see Figure 1.1.3). Poorly growing pre-mature infants should be first reviewed for adequacy of energy needs and if the energy needs are being met, protein supplementation could be considered. Blood urea can be used as a guide; if high, poor growth is likely to be due to inadequate energy; if low despite a high energy intake, poor growth is likely to be due to inadequate protein (39–41).
Solute balance
infant can reduce some of this solute load. The estimated renal solute load (ERSL) takes into account the growth of the infant and can be calculated as the potential renal solute load minus 90% of the weight gain in grams (ERSL = PRSL – [0.9 x weight gain in grams]) (42).
1.2 Nutritional requirements
Recommended nutrient intakes (RNIs) for pre-term and SGA infants have been published by a number of groups (43–45). The RNIs have been developed by calculating nutrient intakes that approximate the rate of growth for a nor-mal fetus of the same gestational age without inducing metabolic stress; factorial equations; provision of idealized nutrient requirements and measurement of utilization and excretion. Published nutrient requirements for pre-term infants are shown in Box 1.2.1.Although the published RNIs provide some indications, they cannot be used as the only basis of guidelines for feeding the LBW infant. This is because outcomes vary widely accord-ing to the basic substrate provided. In par-ticular, the absorption and bioavailability of nutrients in different types of milk vary widely (43–44). This is particularly important for human milk. Bioavailability of many nutrients is higher from human milk than from infant
formula or other breastmilk sub-stitutes (43–44). Studies reporting clinical endpoints are more relevant for developing nutritional guidelines for LBW infants.
1.3 Nutritional sources
for LBW infants
HUMAN MILK
Constituents
Nutrient composition
The nutrient compositions of pre-term and pre-term human milk are dis-played in Box 1.3.1. There was no information located about stratifi-cation by gestational age or birth weight. Also, no information was located which described the nutrient content of the milk of mothers who delivered SGA infants.
Breastmilk meets almost all these require-ments. There may be specific need of addi-tional minerals and vitamins for breastfed LBW infants during certain periods of life. For instance, pre-term infants of <32 weeks gesta-tion need addigesta-tional phosphorus, calcium and vitamin D from the time feeding is established until they reach term post-menstrual age. It should be noted that breastmilk has great vari-ability in composition as seen from the stand-ard deviations (Box 1.3.1). In general, if the breastmilk volume is high, the concentration of nutrients will be lower.
Anti-infective constituents
Term and pre-term human milk contains live cells (macrophages, polymorphonuclear leu-cocytes, T and B lymphocytes) and a range of antimicrobial factors (secretory IgA, lactofer-rin, lysozyme, B12 and folate-binding proteins, complement, fibronectin, mucin, and antiviral factors) (47). Human milk cells and antimi-crobial factors play a major role in conferring local immunological protection to the infant’s gastrointestinal tract (47, 48). Enzymes, anti-oxidants, and cellular components in human milk all improve the host defence of the LBW infant (49).
Figure 1.1.3 Energy intake and nitrogen retention according to protein
intake in pre-term infants (41)
400
300
200
100
40 80 120 160
4
3
2
1
Energy intake (kcal/kg/day)
Nitrogen retention (mg/kg/day)
BOX 1.2.1 Recommended daily nutrient intakes for pre-term infants >1000 g at birth
Period after birth; RNI per day
Nutrient Birth Stable-growing Term to to 7 days (stabilization to term) 1 year of age
Macronutrients
Energy, kJ/kg (kcal/kg) 292–334 (70–80) 438–563 (105–135) 417–501 (100–120)
Protein, g/kg 1.0–3.0 3.0–3.6 2.2
Fat, g/kg 0.5–3.6 4.5–6.8 4.4–7.3
Carbohydrate, g/kg 5.0–20.0 7.5–1 5.5 7.5–1 5.5
Minerals
Calcium, mmol/kg 1.5–2.0 4.0–6.0 6.3 mmol/d (breast fed)
9.4 mmol/d (formula fed)
Phosphorus, mmol/kg 1.0–1.5 2.5–3.8 3.4 mmol/d (breast fed)
8.8 mmol/d (formula fed)
Magnesium, mmol/kg 0.20–0.25 0.20–0.40a 0.20–0.60a
Sodium,b mmol/kg 1.0–3.0 2.5–4.0 2.0–3.0
Chloride,b mmol/kg 1.0–3.0 2.5–4.0 2.0–3.0
Potassium, mmol/kg 2.5–3.5 2.5–3.5 2.5–3.5
Iron, mg/kg 0 2.0–3.0c 2.0–3.0c
Zinc, µmol/kg 6.5 7.7–12.3 15.0 (estimate)
Copper, µmol/kg 1.1–1.9 1.1–1.9 1. 1–1.9
Selenium, µmol/kg 0.04–0.06 0.04–0.06 0.04–0.06
Chromium, nmol/kg 1.0–1.9 1.0–1.9 1.0–1.9
Manganese, nmol/kg 10–20 10–20 10–20
Molybdenum, nmol/kg 2.0–4.0 2.0–4.0 2.0–4.0
Iodine, µmol/kg 0.20 0.25–0.50 0.25–0.50
Vitamins
Vitamin A, IU/kg 700–1500 700–1500 600–1400
Vitamin E, IU/kg 6–12 6–12 6–12
Vitamin K, µg/kg 8–10 8–10 8–10
Vitamin D, lU 40–260 400 (800d) 400
Vitamin C, mg/kg 6–10 6–10 20
Vitamin B1, mg/kg 0.04–0.05 0.04–0.05 0.05
Vitamin B2, mg/kg 0.36–0.46 0.36–0.46 0.05
Vitamin B6, mg/g of protein intake 0.015 0.015 0.015
Vitamin B12, µg 0.15 0.15 0.15
Niacin, NEe/5000 U 8.6 8.6 8.6
Folate, µg 50 50 25
Biotin, µg/kg 1.5 1.5 1.5
Pantothenic acid, mg/kg 0.8–1.3 0.8–1.3 0.8–1.3
a Amount required is higher if milk from the premature infant’s mother is fortified with other minerals that may diminish
the bioavailability and absorption of magnesium.
b In specific clinical situations, sodium and chlorine may need to be omitted for short periods. c From 6 wk after birth.
d Amount may be increased in particular clinical syndromes. e NE = niacin equivalents.
BOX 1.3.1 Concentration of nutrients in transitional and mature pre-term human milk compared with mature term milk
Component (unit/L)
Pre-term transitional Pre-term stable Term mature (6–10 days) (22–30 days) (> 30 days)
Macronutrients
Energy, kcal/L 660 ± 60 690 ± 50 640 ± 80
Protein, g/L 19 ± 0.5 15 ± 1 12 ± 1.5
Fat, g/L 34 ± 6 36 ± 7 34 ± 4
Carbohydrate, g/L 63 ± 5 67 ± 4 67 ± 5
Minerals
Calcium, mmol/L 8.0 ± 1.8 7.2 ± 1.3 6.5 ± 1.5
Phosphorus, mmol/L 4.9 ± 1.4 3.0 ± 0.8 4.8 ± 0.8
Magnesium, mmol/L 1.1 ± 0.2 1.0 ± 0.3 1.3 ± 0.3
Sodium, mmol/L 11.6 ± 6.0 8.8 ± 2.0 9.0 ± 4.1
Chloride, mmol/L 21.3 ± 3.5 14.8 ± 2.1 12.8 ± 1.5
Potassium, mmol/L 13.5 ± 2.2 12.5 ± 3.2 13.9 ± 2.0
Iron, mmol/L 23 22 22
Iron, mg/L 0.4 0.4 0.4
Zinc, µmol/L 58 ± 13 33 ± 14 15 – 46
Copper, µmol/L 9.2 ± 2.1 8.0 ± 3.1 3.2–6.3
Manganese, nmol/kg 6 ± 8.9 7.3 ± 6.6 3 – 6
Iodine, µmol/L — 1.25 —
Iodine, µg/L — — 70
Vitamins
Vitamin A, IU/L 500–4000 500–4000 600–2,000
Vitamin E, mg/L 2.9–14.5 2.9–14.5 2–3
Vitamin K, µg/L 0.7–5.3 0.7–5.3 1.2–9.2
Vitamin D, IU 40 40
Vitamin D, µg/L 0.01 0.01 0.01
Vitamin B2, mg/L 0.055 mg/418 kj 0.055 mg/418 kj —
Folate, mg/L 33 33 1.8
Values are mean ± SD. From: Reference number 46
Amino acids
Human milk also contains many nucleotides and hormones. Approximately 20% of the total nitrogen content of human milk is represented by non-protein nitrogen, and up to 20% of the latter consists of free nucleotides (50). These are believed to be important in the growth and maturation of the gastrointestinal tract and in the development of neonatal immune function. Dietary nucleotides also favourably alter the bowel microflora and reduce the risk of diarrhoea. Glutamine, taurine, cysteine and inositol also serve dual roles to protect the host (51, 52).
Exocrine/endocrine components
Insulin-like growth factor-1, epidermal growth factor and transforming growth factor alpha, found in human term and pre-term milk, are believed to have trophic effects on the develop-ing gastrointestinal tract (53). Human milk also contains at least 60 enzymes, including lipase, which have been shown to enhance intestinal lipolysis and improve fat absorption (54).
Fatty acids
gan-gliosides. Long-chain polyunsaturated fatty acids are believed to be important for cell membrane synthesis, and cerebral and retinal function (55). Human milk gangliosides are also considered to promote neuronal develop-ment, somatic growth and the development of intestinal immunity (56–57).
Types of human milk
Mother’s own milk and donor milk Mother’s own milk can be provided to the infant via breastfeeding or expression and feeding by an alternative method. Donor milk from a human milk bank is another source of human milk. This milk is screened and heat-treated and subjected to strict processing regulations. The WHO/UNICEF Global Baby-Friendly Hospital Initiative subsequently led to a revival of interest in donor milk banks. There are well functioning milk banks in a number of countries around the world includ-ing Brazil, Germany and the United Kinclud-ingdom. In addition, the United Kingdom Association for Milk Banking and the Human Milk Bank-ing Association of North America have pub-lished guidelines for the establishment and operation of human milk banks (58, 59).
Fore milk and hind milk
Fore milk is the milk that is produced as soon as the milk flow begins. Hind milk is the por-tion of the milk which is produced 2 to 3 min-utes after the flow begins. Hind milk is higher in fat and energy than foremilk but has similar concentrations of other nutrients as foremilk (60, 61). Hind milk has been described as pro-moting greater weight gain than fore milk or regular breastmilk (60, 61).
Drip milk and expressed milk
The milk which drips from the opposite breast during breastfeeding is called drip milk and used to be provided in the 1980s for feeding pre-term infants. Drip breastmilk (DBM) dif-fers from expressed breastmilk (EBM) both in its contents and in the change in its com-position over the period of lactation. DBM is mainly fore milk; fat concentration and energy
value are low, compared with levels reported for EBM. Protein, fat, sodium and energy val-ues in DBM fall with the duration of lactation, whereas magnesium and calcium rise, and lactose, potassium, osmolality and lysozyme remain constant. The milk fat content of DBM produced by individual donors is linearly related to the daily volume of DBM produced (62, 63). About 15% of lactating women pro-duce drip milk; volumes propro-duced are up to 188 ml/donor/day (63). Expressed breastmilk varies according to the type of technique used. Sodium levels have been shown to be higher after hand pumping than mechanical pump-ing, but this study did not control for breast-milk volume (64). Milk expressed by electric breast pumping also appears to have greater bacterial contamination than milk expressed by hand (65–67). WHO/UNICEF, the United Kingdom Association for Milk Banking, and the Human Milk Banking Association of North America have published guidelines for the expression and processing of breastmilk (58, 59, 68).
Storage of human milk
Heat treatment (pasteurization)
Simpler methods (e.g. Pretoria pasteuriza-tion and flash treatment) to treat milk from HIV-positive women are emerging and have been reported to inactivate HIV (76–79). These methods can potentially be implemented in resource-poor areas. Pretoria pasteurization involves placing human milk in a container in a pan of boiling water for 20 minutes, then removing and cooling. Flash treatment involves placing human milk in a container, placing the container in a pan of room temperature water, then heating the water and milk together until it reaches a rolling boil (100 °C), and remov-ing and coolremov-ing. Both methods are reported to decrease the concentrations of HIV although flash treatment may be more effective (see Sec-tion 7) (76–79).
Refrigeration and freezing
Expressed human milk can be kept at room temperature for 6 hours before significant bac-terial growth occurs (80, 81). It has been sug-gested that human milk should be refrigerated at 3–4 °C to retard bacterial growth, maintain the stability of nutrients (except vitamin C), preserve the viability and function of leu-kocytes, and preserve the concentration of antimicrobial proteins (82–84). If mother’s own milk needs to be refrigerated, it should not be for more than two days. Heat-treated breastmilk (mother’s or donor) can be refrig-erated for a maximum of 24 hours because of concerns that heating damages bacteriostatic mechanisms making the milk more suscepti-ble to later contamination (58, 59, 63, 85).
Human milk can also be frozen at –15 °C to –20 °C for up to 3 months. This will preserve most nutrients and antimicrobial proteins and maintain the stability of vitamins with anti-oxidant activity such as tocopherol and retinol (86, 87). However, this process will signifi-cantly reduce the concentrations of vitamin C and milk leukocytes (75, 88, 89). IgA was found to be best preserved in frozen human milk by thawing either overnight in a refrig-erator or by keeping under warm running water (90). Microwave thawing, particularly at temperatures above 60 °C, reduces the levels of IgA and lysozyme in breastmilk (91, 92).
Freezing of breastmilk specimens naturally infected with cytomegalovirus (CMV) for 7 days or longer at –20 °C was believed to elimi-nate infectivity without destroying the bio-chemical and immunological qualities of the breastmilk (93). A more recent study that used more sensitive tests for quantitative detection of CMV in breastmilk has shown that late viral RNA and viral infectivity are preserved even after freezing at –20 °C for up to 10 days (94). Pasteurization removes CMV infectiv-ity and should be carried out with donated milk. For a mother known to be infected with CMV, freeze storage of her own milk does not seem to be a perfect solution, but the rate of CMV transmission is likely to be lowered; the observed infections were asymptomatic (95).
HUMAN MILK SUPPLEMENTS
Nutritional supplements, to be given sepa-rately from breastmilk, are available as single vitamin preparations (vitamin A, vitamin D, vitamin K) or single mineral preparations (iron, zinc, calcium and phosphorus). Multi-vitamin preparations are also available which contain vitamin A, vitamin D, thiamine, ribo-flavin, pyridoxine, nicotinamide, ascorbic acid (see Box 1.3.2). Multivitamins are not usually mixed into the breastmilk, but care is needed in administering the correct dose. Multivita-min preparations must be protected from light and refrigerated below 25 °C after opening.
Nutritional supplements are also available as additives to be mixed with human milk. Commonly known as ‘fortifiers’, they are commercially available and can be multicom-ponent (with added protein, carbohydrate, fat, calcium, phosphorus, sodium, vitamins A, D, E, K, riboflavin, folic acid and zinc) (see Box 1.3.3) or single component (protein, carbohy-drate, fat, calcium, phosphorus or sodium).
pro-BOX 1.3.3 Nutrient composition of commercial multicomponent human milk fortifiers
Powdered multicomponent human milk fortifiers Nutrient Enfamil Similac SMA Nutriprem Aptamil
human milk human milk breastmilk Milupa Cow & FMS FM85 fortifier fortifier fortifier Eoprotin Gate Milupa Nestle Quantity 4 g 4 g 4 g 3 g 3 g 3.4 g 5 g
Macronutrients
Energy, kcal 14 14 15 11 10 12 18
Protein, g 1.1 1 1 0.6 0.7 0.8 0.8
Fat, g 0.65 0.36 0.16 0.02 0 0 0.015
Carbohydrate, g 1.1 1.8 2.4 2.1 2 2.2 3.6
Minerals
Calcium, mg 90 117 90 38 60 69 51
Phosphorus, mg 45 67 45 26 40 46 34
Magnesium, mg 1 7 3 2.1 6 6.8 2
Sodium, mmol 0.5 0.7 0.8 0.9 0.3 0.3 1.2
Chloride, mmol 0.3 1.1 0.5 0.4 0.2 0.2 0.5
Potassium, mmol 0.5 1.6 0.7 0.006 0.1 0.1 0.3
Iron, mg 1.44 0.35 0 0 0 0 0
Zinc, mcg 720 1000 260 0 300 350 0
Copper, mcg 44 170 0 0 26 30 0
Manganese, mcg 10 7.2 4.6 0 6 10 0
Vitamins
Vitamin A, mcg 285 186 270 30 130 150 0
Vitamin E, mg 4.6 3.2 3 0.3 2.6 2.9 0
Vitamin K1, mcg 4.4 8.3 11 0.2 6.3 7.1 0
Vitamin D, mcg 4 3 7.6 0 5 5.7 0
Vitamin C, mg 12 25 40 15 12 14 0
Thiamine, mcg 150 233 220 0 130 150 0
Riboflavin, mcg 220 417 260 0 170 190 0
Vitamin B6, mcg 115 211 260 0 110 120 0
Vitamin B12, mcg 0.18 0.64 0.3 0 0.2 0.2 0
Niacin, mg 3 3.57 3.6 0 2.5 2.8 0
Folic acid, mcg 25 23 0 0 50 57 0
Biotin, mcg 2.7 26 0 0 2.5 2.8 0
Pantothenic acid, mg 0.73 1.5 0 0 0.75 0.85 0
Increment in osmolality,
mOsm 63 90 137 70 60 57 105
From: Reference number 46
BOX 1.3.2 Nutrient composition of selected multivitamin supplement formulations
Multivitaminsa Pentavite 0.45 ml Abidec 0.6 ml Dalivit 0.6 ml
Vitamin A, IU 4000 IU 1333 IU 5000 IU
Ergocalciferol Vitamin D, IU 400 IU 400 IU 400 IU
Vitamin C, mg 43 mg 40 mg 50 mg
Vitamin B1, mg 0.54 mg 0.4 mg 1 mg
Vitamin B2, mg 0.81 mg 0.8mg 0.4 mg
Pantothenic acid, mg 0.288 mg — —
Vitamin B6, mg/g protein 0.14 mg 0.8 mg 0.5 mg
Niacin, mg 7.11 mg 8 mg 5 mg
portion of the infant’s fluid intake. Although they are designed to contain adequate quanti-ties of all essential nutrients, mixing the moth-er’s own milk with an equal volume of liquid fortifier dilutes the constituents of the human milk, including nutrients, growth factors and anti-infective properties (96).
BREASTMILK SUBSTITUTES
Breastmilk substitutes are available in many different formulations and their nutrient com-position varies markedly. They do not contain biologically active anti-infective or immune substances, or the hormones and growth factors that are found in human milk. All breastmilk substitutes have a risk of contamination, par-ticularly if prepared and handled incorrectly.
Types of available breastmilk substitutes
Locally prepared animal milks
Raw animal milk is often contaminated with pathogenic organisms (such as Brucella melitensis) and is an excellent culture medium. Raw animal milk should be pasteurized by heating to 56–62 °C for 30 minutes before any other modifications and definitely before administration (97).
It is also important to note that the concen-trations of nutrients in cow, goat and buffalo milk are suboptimal when compared to human milk. Animal milk has low concentrations of iron, folic acid, vitamin D, vitamin B12, vitamin C, vitamin E and long-chain polyunsaturated fatty acids. The bioavailability of the small quantity of iron present in animal milk is also low. Animal milk has high protein, electrolyte, mineral and fat content compared to human milk and must be diluted (2 parts of milk to 1 part of water). Dilution diminishes the energy and micronutrient content which can be par-tially compensated by adding sugar (10 g/100ml undiluted milk). Additional vitamins, minerals and fat/oils are also needed, but these are rarely added and result in an expensive preparation (98–100). Multivitamin complex has been pro-posed, but feasibility is limited due to the small doses needed in LBW newborns.
Standard infant formulas
Standard infant formulas are designed for term infants and are based on the composition of mature breastmilk. The typical energy con-tent is 68 kcal/100ml. Protein concentration is approximately 1.5 g/100ml, and calcium and phosphorus are 50 mg/100ml and 30 mg/100ml respectively. Product information from the manufacturers can be found in Box 1.3.4.
Pre-term infant formulas
Pre-term infant formulas are designed for pre-term infants. These are calorie-enriched (approximately 80 kcal/100ml) and variably protein- and mineral-enriched to support intra-uterine nutrient accretion rates. Calo-ries may be provided as protein, fat or carbo-hydrate and the balance between calories and protein may be critical in determining the type of growth. Product information from the manufacturers can be found in Box 1.3.4.
Compared to unsupplemented human milk, pre-term formula contains more pro-tein, sodium, calcium, phosphorus, zinc, cop-per and vitamins, often in a form that is easily absorbed and metabolised. Most have an energy content of about 80 kcal/100ml. In spite of the higher carbohydrate and mineral content, the osmolality of pre-term formulas remains low at around 250–320 mOsm/kg H2O. Pre-term formulas contain at least 2 g/100ml of protein so that the pre-term infant will receive 3 g/kg/d of protein when fed 150 ml/kg/d.
Nutrient enriched “post-discharge” formulas