IMPACTS OF SALINITY ON SOIL PROPERTIES OF
COASTAL AREAS IN BANGLADESH
Nazmun Naher1,2*), M.Khabir Uddin1*) and A.K.M.M. Alam3)
1)Department of Environmental Sciences, Jahangirnagar University, Dhaka 1342, Bangladesh 2)Patuakhali Science and Technology University, 3)Senior Scientific Officer, PRC, BARI, Gazipur Corresponding author : E-mail: [email protected], [email protected]
Received: June 2, 2011/ Accepted: June 30, 2011
ABSTRACT
Sea level rise is a growing threat for the coastal regions of Bangladesh. It is one of the most densely populated countries of the world where 28% of the population are living in the coastal area. Bangladesh has already been affected by sea level rise through land erosion, salinity intrusion and loss in biodiversity. Saline soil has a detrimental effect upon soil physical and chemical properties. The dominant soil textural classes that occur in the saline areas of these regions are silty clay. In both of the soils pH value of the surface horizon is slightly lower than those of the subsoil and sub stratums. Cation Exchange Capacity (CEC) of all these soils varies from 12.0 to 27.6 meq/100 g soil expressing medium to high status. The organic matter content is medium to high at Asasuni and pretty low at Kalapara. In both areas, nutrient deficiencies of total nitrogen, phosphorous and potassium were quite dominant but sulphur was high. Exchangeable sodium, potassium, calcium and magnesium were in high level. The dominant water soluble cations were Na+, Ca2+, Mg2+ and K+ and anions Cl-and SO42-.The amount of accumulated salt was found higher at the surface and decreases with depth.
Keywords: sea level rise, coastal areas, salinity, soils, flood plain
INTRODUCTION
Climate change is an important issue nowadays. Various human activities turn the warm world to warmer. The ultimate result is global warming, i.e. climate change. Rising temperature in the atmosphere raises sea level and affects low lying coastal areas and deltas of the world. Bangladesh is highly vulnerable to sea level rise
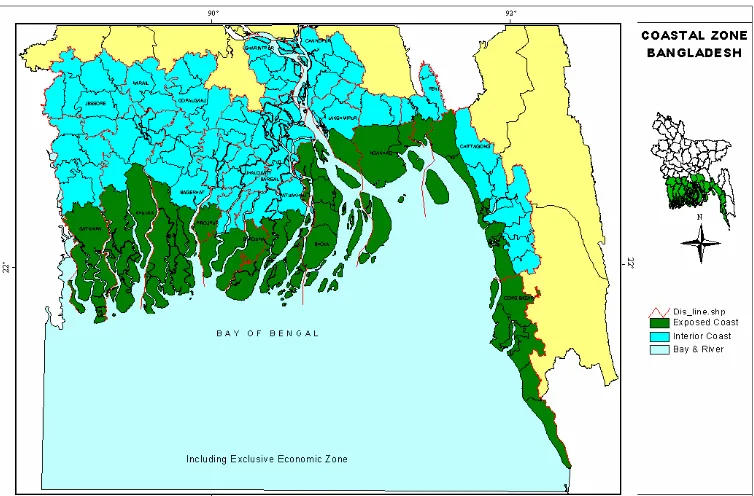
(Brammer et al., 1993). The whole coast runs parallel to the Bay of Bengal, forming 710 km long coastline (CZPo, 2005) (Figure 1). The area lies at 0.9 to 2.1 meters above mean sea level (Iftekhar and Islam, 2004). The country has three distinct coastal regions, namely the western, central and eastern regions. Out of 2.85 million hectares of coastal and off shore, (30% of net cultivable area) about 0.831 million hectare of arable land were affected by varying degrees of soil salinity (Karim et al., 1990). Soil resource development Institute (2000) showed that soil saline area in the country has increased to 1.02 million ha. Agricultural land used in these areas is very poor, which is roughly 50% of the country’s average (Petersen and Shireen, 2001). In general, soil salinity is believed to be mainly responsible for low land use as well and relative proportions of these salts play a critical role in the ‘salinity hazard` of soil. The attractive forces which bind clay particles together are disrupted when too many sodium ions get between the clay particles. When such separation occurs, repulsive forces begin to dominate, and the soil disperses (Hanson et al., 1999; Buckman and Brady, 1967; Falstad, 2000; Saskatchewan Water Corporation,1987). Salinity can have a flocculating effect on soils, causing fine particles to bind together into aggregates. When high concentrations of sodium affect a soil, the subsequent loss of structure reduces the hydraulic conductivity, or rate at which water moves through a soil (Shainberg and Letey, 1984; Hanson et al., 1999).
Figure-1: Coastal zone of Bangladesh (Source: Islam, 2004)
Figure 1. Coastal zone of Bangladesh (Source: Iftekhar and Islam, 2004)
Salinity became a serious problem for agriculture all over the world. (Charman and Murphy, 2000). On a global scale, nearly 40% of the earth`s land surface is potentially endangered by salinity problems. Salinity problem received very little attention in the past, but due to increased demand for growing more food to feed the booming population of the country, it has become imperative to explore the potentials of these lands. So the present study was conducted to know the salinity level at different saline areas and study the effect of
salinity on soil physical and chemical properties. MATERIALS AND METHODS
Environmental Characteristics of The Study Areas
There is a broad range of agro ecological environments in Bangladesh because of differences in climate, physiography, soil and
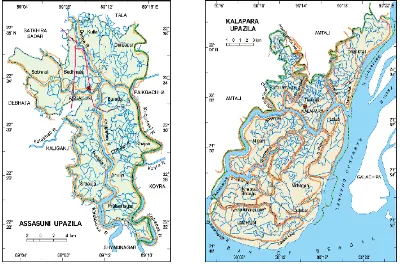
hydrology. A field survey was carried out in the area at Asasuni upazila at Satkhira district located at 22.55000N 89.16810E and kalapara at Patuakhali district located at 21.98610N 90.24220E (Figure 2). Topographically these areas are low lying and have elevation mostly less than 8 m above the mean sea level. The areas are subjected to flooding in the monsoon season. Asasuni and Kalapara include mainly Ganges Tidal floodplain and their sub regions are saline, non calcareous, and the main soil types are loamy and clayey (Table 1).
Soils Used
Figure 2. Study areas Assasuni upazila in the district of Satkhira and Kalapara in Patuakhali district of Bangladesh
Table 1. Distribution and extent of different categories of soil salinity in the studied saline areas of Bangladesh
Salinity Catagories
S1 S2 S3 S4
2.1-4 (dS/m)
4.1-8 (dS/m)
8.1-15 (dS/m)
>15 (dS/m) Slightly
saline
Moderately saline
Saline Strongly
saline
Locations Total
Area
(ha)
Total Saline Area (ha)
Percent
( Hectares)
Asasuni 40.982 34.860 85 910 7400 6480 3100
Kalapara 47.194 35.400 75 31400 12100 7400 2300
Source: Soil salinity in Bangladesh (SRDI) 2000
Analytical Procedures
Particle-size analysis was carried out by the hydrometer method as outlined by Bouyoucos (1927). The textural classes were then determined by plotting the results on a triangular diagram designed by Marshall (1947) following the U.S. Department of Agriculture classification system. The pH was determined by a glass-electrode pH meter in the soil
suspension having a soil: water ratio of 1:2.5, after 30-min shaking. The Electrical Conductivity (EC) was measured by an EC meter in the soil suspension having a soil: water ratio of 1:5, after 30-min shaking.
conventional factor of 1.724.The total nitrogen content was determined by the micro-Kleldhal digestion method. Cation Exchange Capacity (CEC) was determined by the sodium saturation method as described by Chapman (1965). The available phosphor was determined by the method as given by Olsen et al. (1954). The available sulphur was determined by the calcium chloride (0.15%) extraction method (Williams and Steinbergs, 1959).The non-exchangeable potassium content was determined by the boiling HNO3 method (Knudsen et al., 1982). Exchangeable calcium, sodium and potassium were extracted from soil using 1M CH3COONH4 and their concentrations in the extract were directly determined by a flame photometer. Exchangeable magnesium was extracted by Diethylene Triamine Penta Acitate (DTPA) solution and its concentration in the extract was determined directly by an atomic absorption spectrophotometer (ASS). Exchangeable Sodium Percentage (ESP) and Sodium Adsorption Ratio (SAR) were determined by
Exchangeable Na+
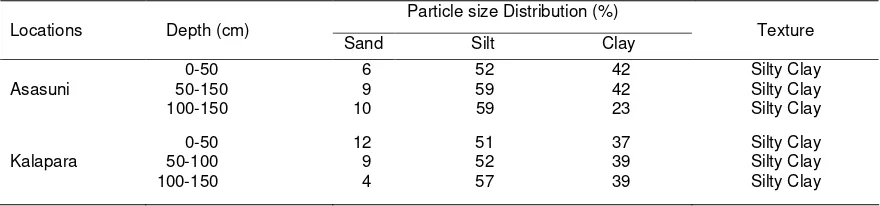
Data on the particle-size distribution and the USDA textural class of the soils is presented in Table 2 which indicates that the dominant soil textural classes that occur in the saline areas of
these regions are silty clay; however, some loamy and sandy soils occur at kalapara. The clay and silt contents were observed to increase with the depth at kalapara while sand content decreased a phenomenon, which described as clay migration by lessivage to produce the process of alluviation.
Chemical Properties: Soil Reaction
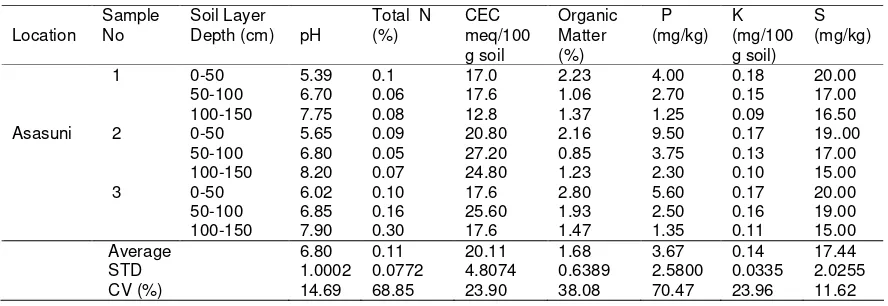
Data on the soil pH are presented in Table 3 and 4. The pH value of the topsoil at Asasuni ranges from 5.39 to 6.02 i.e. the soils were slightly acidic to acidic in reaction. In 50-100 cm depth in this area the pH ranges from 6.7 – 6.85 was 7.2 – 8.1 which is strongly alkaline. In most of the soils, pH value of the surface horizon is slightly lower than that of the subsoil and sub stratums which are similar to the report published by SRDI in 2000. The higher pH values of the soils are likely to create micronutrient deficiency and phosphate fixation problem. But according to Tamhane et al., (1970) the most soil nutrients were available for plants in a pH range from 6.5 to 7.5.
Total Nitrogen
The total nitrogen content of the topsoil is generally low to occasionally high ranging from 0.01 to 0.3%. The total nitrogen of the soils in Asasuni varied from 0.1 to 0.3% (Table 3) while that of Kalapara was 0.05 to 0.09% (Table 4). Table 2. Physical properties of different soils in studied areas of Bangladesh
Total nitrogen content of the soil from Kalapara was evaluated to be low to very low level than that of the soils from Asasuni according to the grading of BARC (1997). Nitrogen content of the surface horizon is higher than that of subsoil. The poor nitrogen status of salt affecting soil is due to high cropping intensity, high rates of decomposition of organic matter and inadequate application of organic matter in terms of manure, compost, and high volatilization of ammonium nitrogen. Portch and Islam (1984) also found that 100% of the soils at Asasuni and kalapara respectively. CEC of all these soils varies from 12.7 to 27.2 meq/100 g soil expressing medium to high status. The high CEC values of these soils denote the comparatively high chemical activity of soil. Organic Matter matter content gradually decreases with depth followed by increasing trend due to the presence of buried mineral and organic horizons.
Phosphorous
The phosphorous contents of these areas estimated by the Olsen method are shown in Table 3 and 4. The ‘P’ content of the soils ranged from 1.25 to 9.50 mg/kg and 0.70 to 1.75 mg/kg at Asasuni and Kalapara, respectively, so most of the soils are found deficient in phosphorous. In some areas, phosphorous is found well below the critical level for most of the agricultural crops (SRDI, 2003). Acute deficiency of phosphorous was observed at Kalapara. Potassium
Potassium status of the soils of different horizons varies from 0.09 to 0.18 meq/100 g soil (Table 3) and 0.06 to 0.17 meq/100 g soil (Table 4) at Asasuni and Kalapara respectively. These ranges indicate very low to low. High cropping intensity, inadequate application of potash fertilizer and limited scope of tidal water inundation may be the cause of lower potassium content.
Table 3. Physico-chemical properties of soils collected from Asasuni
Location
0-50 5.39 0.1 17.0 2.23 4.00 0.18 20.00
50-100 6.70 0.06 17.6 1.06 2.70 0.15 17.00
1
100-150 7.75 0.08 12.8 1.37 1.25 0.09 16.50
0-50 5.65 0.09 20.80 2.16 9.50 0.17 19..00
50-100 6.80 0.05 27.20 0.85 3.75 0.13 17.00
2
100-150 8.20 0.07 24.80 1.23 2.30 0.10 15.00
0-50 6.02 0.10 17.6 2.80 5.60 0.17 20.00
50-100 6.85 0.16 25.60 1.93 2.50 0.16 19.00
Asasuni
3
100-150 7.90 0.30 17.6 1.47 1.35 0.11 15.00
Average 6.80 0.11 20.11 1.68 3.67 0.14 17.44
STD 1.0002 0.0772 4.8074 0.6389 2.5800 0.0335 2.0255
Table 4. Physico-chemical properties of soils collected from Kalapara
50-100 6.44 0.08 20.80 0.62 0.96 0.17 44.00
1
100-150 7.20 0.06 18.40 0.58 0.75 0.11 38.00
0-50 5.92 0.08 12.70 1.87 1.75 0.06 65.00
50-100 6.49 0.07 20.60 0.58 0.90 0.12 42.00
2
100-150 8.10 0.06 17.90 0.52 0.80 0.10 40.00
0-50 5.90 0.09 13.00 1.89 1.65 0.07 63.00
50-100 7.20 0.08 21.00 0.60 0.95 0.13 40.00
Kalapara 3
100-150 7.90 0.05 17.50 0.55 0.70 0.11 39.00
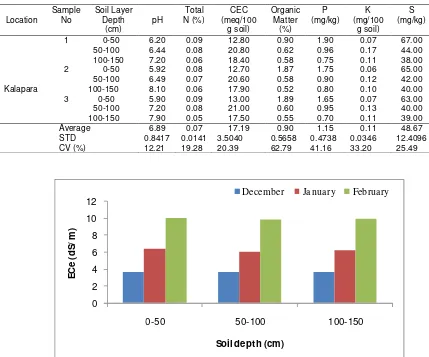
Average 6.89 0.07 17.19 0.90 1.15 0.11 48.67
STD 0.8417 0.0141 3.5040 0.5658 0.4738 0.0346 12.4096
CV (%) 12.21 19.28 20.39 62.79 41.16 33.20 25.49
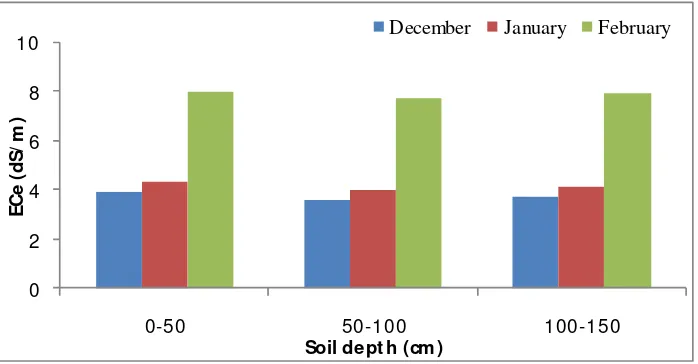
Figure 3. ECe (dS/m) at Asasuni in December, January and February at different soil depth Sulphur
Topsoil sulphur status of all the soils were found medium to high and the content was The salinity of these areas ranges from slight to moderate, but during dry season the salinity
0 2 4 6 8 10
0-50 50-100 100-150
E
C
e
(
d
S
/
m
)
Soil dept h (cm )
December January February
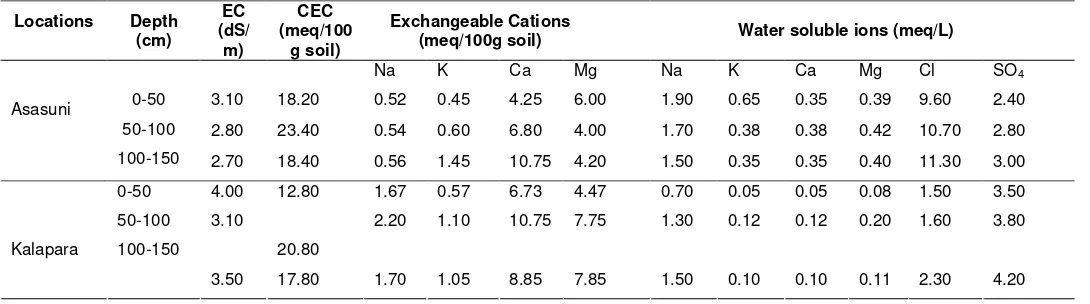
Figure 4. . ECe (dS/m) at Kalapara in December, January and February at different soil depth
The higher ECe value found at the surface horizon followed by decrease with depth can be attributed to flooding with saline water or accumulation of salts through upward capillary movement of saline ground water. Soil salinity of different horizons ranges from 2.4 to 3.4 dS/m at Asasuni and 3.1 to 4.0 dS/m at Kalapara in December (2008) (Table 5). In dry season, this range, however, becomes 9.2 to 10 dS/m at Asasuni and 6.9 to 8.2 at Kalapara, which is under saline category according to soil report of (BARC 1990) and (SRDI 2003). Zaman and Bakri (2003) reported that Bangladesh had 3 million hectares of land affected by salinity, mainly in the coastal and south-east districts, with ECe values ranging between 4 and 16 dS/m.
Exchangeable Sodium Content
The exchangeable sodium contents of the soils of Asasuni and Kalapara at different soil depths are presented in Table 6. It was observed that the exchangeable sodium content for Asasuni varied from 0.52 to 0.56 meq/100 g soils and for Kalapara it varied from 1.67 to 2.2 meq/100 g soil (Table 6).
Exchangeable Potassium Content
The exchangeable potassium content of the soils of Asasuni and Kalapara was varied mainly based on the clay content. At Asasuni, it
ranged from 0.45 to 1.45 meq/100g soil and at Kalapara it was 0.57 to 1.10 meq/100g soil. These ranges were very high in both areas (Table 6).
Exchangeable Calcium Content
The exchangeable calcium contents of the soils for Asasuni were 4.0 to 6.0 meq/100g soil and for Kalapara it was 6.73 to 10.75 meq/100g soil (Table 6). The exchangeable calcium content at Asasuni was medium to very high, and at Kalapara, the range was high to very high (BARC, 2005).
Exchangeable Magnesium Content
Exchangeable magnesium content of the two areas was in the very high level (Table-6). At Asasuni, it ranged from 4.0 to 6.0 meq/100g soil and from 4.47 to 7.85 meq/ 100g soil at Kalapara (Table 6).
Water Soluble Ions
Nazmun Naher et al.: Impact of Salinity on Soil Properties……….
Table 6. Salt characteristics of soils of Asasuni and Kalapara Locations Depth
(meq/100g soil) Water soluble ions (meq/L)
Na K Ca Mg Na K Ca Mg Cl SO4
3.10 18.20 0.52 0.45 4.25 6.00 1.90 0.65 0.35 0.39 9.60 2.40
2.80 23.40 0.54 0.60 6.80 4.00 1.70 0.38 0.38 0.42 10.70 2.80
Asasuni 0-50
50-100
100-150 2.70 18.40 0.56 1.45 10.75 4.20 1.50 0.35 0.35 0.40 11.30 3.00
4.00 12.80 1.67 0.57 6.73 4.47 0.70 0.05 0.05 0.08 1.50 3.50
3.10
20.80
2.20 1.10 10.75 7.75 1.30 0.12 0.12 0.20 1.60 3.80
Kalapara
0-50
50-100
100-150
3.50 17.80 1.70 1.05 8.85 7.85 1.50 0.10 0.10 0.11 2.30 4.20
Exchangeable Sodium Percentage (ESP) Exchangeable Sodium Percentage has been used as a parameter for assessing the severity of salinity problem. The sodium hazard is expressed as ESP. It ranges from 2.31 % to 3.04% at Asasuni which is acceptable (< 10%) and it is intermediate (10-35%) at Kalapara, i.e. 9.55% to 13.05%.
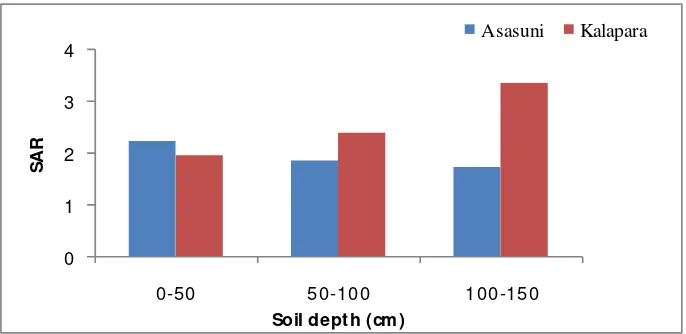
Sodium Adsorption Ratio (SAR)
The sodium hazard is denoted by the sodium adsorption ratio. The SAR of a soil extract gives an indication of the level of exchangeable Na+ in comparison with that of Ca+ and Mg+ in soil.
The SAR values vary from 1.72-2.22 at Asasuni upazila and 1.94 to 3.33 at Kalapara upazila (Fig.6). The SAR values of these areas are acceptable (<10).
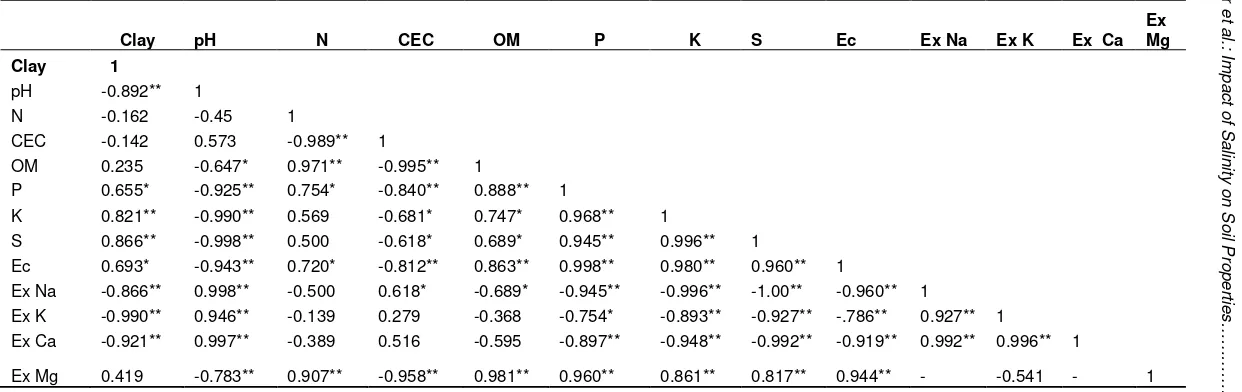
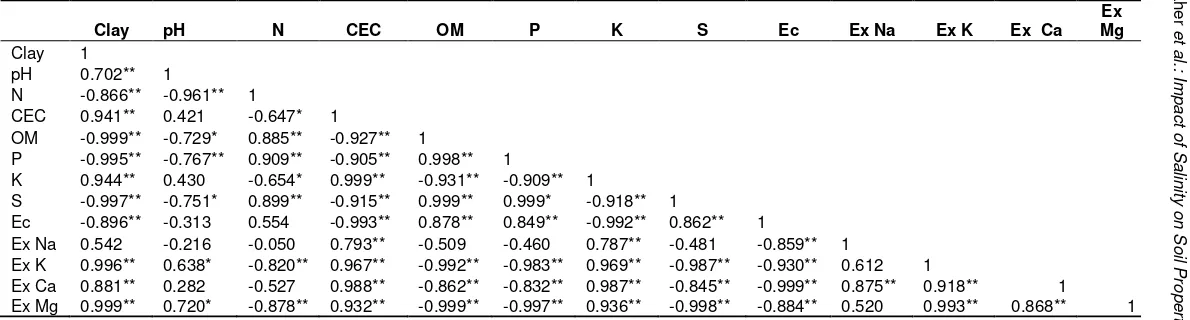
Correlation matrix
The correlation matrix for physical and chemical properties determined in the present study of Asasuni is given in Table 7 and that of Kalapara is in Table 8. From Table 8, it is understood that the clay content is the most fundamental property to control chemical properties of soils at Kalapara.
0 2 4 6 8 10 12
0
-
50
50
-
100
100
-
150
E
S
P
(
%
)
Soil dept h (cm )
Asasuni Kalapara
Figure 5. ESP(%) of Asasuni and Kalapara at different soil depth
0 1 2 3 4
0-50 50-100 100-150
S
A
R
Soil dept h (cm )
Asasuni Kalapara
Table 7. Correlation matrix between physical and chemical properties of the soils of Asasuni
Remarks = ** and * mean correlation significant at the 0.01 and 0.05 levels, respectively (2-tailed). Clay: clay percentage, N: total N content, CEC: cation exchange capacity, OM: organic matter content, P: available P determined by the Olsen method, K: available K content, S: Available S content, Ec: electrical conductivity, Ex Na: exchangeable Na content, Ex K: exchangeable K content, Ex Ca: exchangeable Ca content, Ex Mg: exchangeable Mg content
OM 0.235 -0.647* 0.971** -0.995** 1
P 0.655* -0.925** 0.754* -0.840** 0.888** 1
K 0.821** -0.990** 0.569 -0.681* 0.747* 0.968** 1
S 0.866** -0.998** 0.500 -0.618* 0.689* 0.945** 0.996** 1
Ec 0.693* -0.943** 0.720* -0.812** 0.863** 0.998** 0.980** 0.960** 1
Ex Na -0.866** 0.998** -0.500 0.618* -0.689* -0.945** -0.996** -1.00** -0.960** 1
Ex K -0.990** 0.946** -0.139 0.279 -0.368 -0.754* -0.893** -0.927** -.786** 0.927** 1
Ex Ca -0.921** 0.997** -0.389 0.516 -0.595 -0.897** -0.948** -0.992** -0.919** 0.992** 0.996** 1
Ex Mg 0.419 -0.783** 0.907** -0.958** 0.981** 0.960** 0.861** 0.817** 0.944**
Table 8. Correlation matrix between physical and chemical properties of the soils of Kalapara
OM -0.999** -0.729* 0.885** -0.927** 1
P -0.995** -0.767** 0.909** -0.905** 0.998** 1
K 0.944** 0.430 -0.654* 0.999** -0.931** -0.909** 1
S -0.997** -0.751* 0.899** -0.915** 0.999** 0.999* -0.918** 1
Ec -0.896** -0.313 0.554 -0.993** 0.878** 0.849** -0.992** 0.862** 1
Ex Na 0.542 -0.216 -0.050 0.793** -0.509 -0.460 0.787** -0.481 -0.859** 1
Ex K 0.996** 0.638* -0.820** 0.967** -0.992** -0.983** 0.969** -0.987** -0.930** 0.612 1
Ex Ca 0.881** 0.282 -0.527 0.988** -0.862** -0.832** 0.987** -0.845** -0.999** 0.875** 0.918** 1
Ex Mg 0.999** 0.720* -0.878** 0.932** -0.999** -0.997** 0.936** -0.998** -0.884** 0.520 0.993** 0.868** 1
CONCLUSIONS AND SUGGESTION
Coastal area in Bangladesh constitutes 20% of the country of which about 53% are affected by different degree of salinity. The texture of most of the saline areas of Bangladesh varies from silty clay to clay soil. Land preparation for crop production in these soils becomes very difficult as the soil dries out, deep and wide cracks develop and the surface soil becomes very hard. In these areas electrical conductivity was slightly saline to saline. The higher pH values of the soils are likely to create micronutrient deficiency problem. Hence, soil fertility should be improved based on the results obtained in the present study. Bangladesh Unnayan Parishad (BUP), Dhaka.
Bouyoucos, G.J. 1927 The hydrometer as a method for the mechanical analysis of soils. Soil Sci., 23: 343–353.
Buckman, H.O. and N.C. Brady. 1967. The nature and properties of soils. The MacMillan Company, New York, New York. 42-46 Charman, P.E.V. and Murphy, B.W. Eds 2000.
Soils: Their properties and management
.
Oxford University Press, South Melbourne. pp. 217.Chapman, H. D. 1965. Cation exchange capacity. In “Methods of soil analysis”. ed. by C. A. Black, American Society of Agronomy, Inc., Madison, Wisconsin. p. 891–901. CZPo, 2005. Coastal Zone Policy, Ministry of Water
Resources, Government of the People’s Republic of Bangladesh, Dhaka.. p.5-8. Falstad, J. 2000. Soil condition. transplant status in
burger draw. Billings Gazette.Prepared by D.G. Steward Page. Burger Draw Comments and Recommendations. p..67-71.
Hanson, B.R., S.R. Grattan, and A. Fulton. 1999. Agricultural salinity and drainage. Publication 3375:141. Div. of Agriculture and Natural Resources, University of California, Oakland, CA..
Iftekhar, M.S., and M.R. Islam. 2004. Managing mangroves in Bangladesh: A strategy analysis.Journal of Coastal Conservation 10: 139-146
Karim, Z., Hussain, S. G. and Ahmed, M., 1990. Salinity problems and crop intensification in the coastal regions of Bangladesh. Soils Publication No. 33,
BARC,.63.
Knudsen, D., G.A. Peterson and P.F. Pratt 1982 Lithium, sodium and potassium. In Methods of soil analysis (Part 2)”, 2nd ed., ed. by A.L. Page, R.H. Miller and D.R. Keeny, American Society of Agronomy, Inc. and Soil Science Society of America, Inc., Madison, Wisconsin. p. 225–246. Marshall, T.J. 1947 Mechanical composition of
soils in relation to field description of texture. Commonwealth of Australia, Council for Scientific and Industrial Research, Bulletin 224, Melbourne (Australia). pp. 20. Bangladesh. Proceedings of the workshop on, 'Coastal salinity and crop production in Bangladesh', February 17, 1993, Bangladesh Rice Research Institute publication p..1-30.
Patterson, R.A. 2006. Consideration of soil salinity when assessing land application of effluent or grey water,.1-6.
Petersen, L. and S. Shireen. 2001. Soil and water salinity in the coastal area of Bangladesh. SRDI,.15-18.
Portch, S. and M. S. Islam 1984. Nutrient status of some important agricultural soils of Bangladesh. In “Proceedings of the International Symposium on Soil Test Crop Response Correlation Studies”, Bangladesh Agricultural Research Council and Soil Science Society of Bangladesh, Dhaka (Bangladesh),. 97–106
Resources in Bangladesh: Assessment and Utilization,.4-6.
Saskatchewan Water Corporation. 1987. "Irrigation water quality - soil compatibility: Guide-lines for irrigation in Saskatchewan." Saskatchewan Water Corporation..60 Shainberg, I. and J. Letey. 1984. "Response of
soils to sodic and saline conditions." Hilgardia. 61: 21-57.
SRDI. 2000. Soil salinity in Bangladesh. Soil Resources Development Institute. Ministry of Agricultural, Dhaka-1215,.40-42. Tamhane, R.V., D.P. Motiramani, Y.P. Bali and
R.L. Donahue 1970 Soils: Their chemistry and fertility in tropical Asia. Prentice Hall of Indian Private Limited, New Delhi (India). pp. 29.
USDA, Natural Resources Conservation Service. 2002. Soil conservationists. Salinity management guide - Salt Management. Available at http://www.launionsweb. org/ Salinity.htm. 2002.
Williams, C. H. and A. Steinbergs 1959 Soil sulphur fractions as chemical indices of available sulphur in some Australian soils. Aust. J. Agric. Res., 10: 340–352.
Zaman, T.M. and Bakri, D.A. 2003. Dry land salinity and rising water table in the Mulyan Creek Catchment, Australia. The University of Sydney Orange Leeds Parade, Orange, NSW 2800, Australia. p.23-27.