817
AJCS 12(05):817-826 (2018) ISSN:1835-2707 doi: 10.21475/ajcs.18.12.05.PNE1043
Effects of particle size and application rate of rice-husk biochar on chemical properties of tropical
wetland soil, rice growth and yield
Kartika Kartika
1, Benyamin Lakitan
2,3*, Andi Wijaya
2, Sabaruddin Kadir
4, Laily Ilman Widuri
1, Erna Siaga
1, Mei
Meihana
1,51Graduate School, Universitas Sriwijaya, Palembang 30139, Indonesia 2
Department of Agronomy, College of Agriculture, Universitas Sriwijaya, Inderalaya 30662, Indonesia
3
Research Center for Sub-optimal Lands (PUR-PLSO), Universitas Sriwijaya, Palembang 30139, Indonesia
4
Department of Soil Sciences, College of Agriculture, Universitas Sriwijaya, Inderalaya 30662, Indonesia
5
STIPER Sriwigama, Palembang 30137, Indonesia
*Corresponding author: [email protected] (B. Lakitan).
Abstract
Besides unpredictable time and duration of flooding occurrence, low soil fertility has been another main agricultural issue at riparian wetland in Indonesia. The objective of this research was to determine the potential use of biochar in improving soil chemical properties, rice growth, and yields. Assessment on the effects of particle sizes (S) and application rates (R) of rice-husk biochar was executed through pot experiments in a greenhouse of Universitas Sriwijaya, Indonesia, from January to April 2017. The experiment was laid out in randomized block arrangement with three replications. S co sisted of particle sizes ≤ S1) and > 1 mm (S2). R consisted of
(R4). Rice growth, yield, and growth analysis were measured during
vegetative and generative stage. Soil chemical properties were analyzed after harvesting. Results indicated that application of biochar increased soil pH but did not affect cation exchange capacity (CEC), and availability of major soil nutrients. During vegetative stage, biochar application increased relative growth rate (RGR) and net assimilation rate (NAR) but decreased leaf are ratio (LAR). R3 treatment
significantly increased grain weight per panicle, number of filled spikelet, and weight of 1000 grains. Root and stem N content tended to be higher with biochar application. Application of biochar on riparian wetland soil exhibited some promising positive impacts on soil properties, growth, and yield of rice. However, a long term study on residual effects of biochar application in tropical riparian wetland needs to be pursued further for a more comprehensive understanding on this issue.
Keywords: carbon sequestration, crop growth analysis, inland swamp, nutrient deficiency, soil quality, soil amendment, soil ameliorant, sustainable agriculture, rice yield component, root distribution.
Abbreviations: LAR_leaf area ratio; LWR_leaf weight ratio; NAR_net assimilation rate; RGR_relative growth rate; RWR_root weight ratio; SRR_shoot to root ratio; WAT_week after transplanting.
Introduction
As acreage of fertile agricultural land continuously declines due to conversion to other economic and social purposes, suboptimal land such as riparian wetland has been targeted for sustaining rice production in Indonesia. Yet, smallholder farmers at riparian wetland ecosystem face arduous constraints in increasing cropping intensity due to long-term flooding during rainy season and occasional drought problem during dry season. At present, riparian wetland is cultivated only once a year, except in short-term flooded area (Irmawati et al., 2015). Low nutrient availability associated with high soil acidity, low cation exchange capacity, and other unfavorable chemical, physical, and biological soil properties have caused
low rice productivity at this ecosystem. Thus, application of soil ameliorants is crucial for overcoming these constraints. Residue of rice crops, such as straw and husk, are largely available during postharvest period. Rice straw is mostly abandoned at the paddy fields and naturally decomposed during off-season rice growing period. This process commences after rice harvest, during soil drying and subsequent flooding period, until land preparation for the next growing season. Rice husks are, on the other hand, piled up in large quantity at rice milling units and rarely utilized for agricultural purposes.
Converting rice residue into biochar and subsequently returned to the paddy field is a scenario for addressing low soil
818
fertility. Recycling of this biomaterial will improve sustainability of rice production system at the riparian wetland ecosystem. Since the required biomaterial is locally available, the biochar can be produced by rural communities; therefore, it is economically affordable by smallholder farmers. Moreover, biochar application has long been accepted as an effective tool for carbon sequestration (Zhang and Ok, 2014). Biochar was characterized as stable structure, resistant to decomposition, and could remain in the soil in the range of hundreds to thousands years (Lehmann et al., 2011).
Biochar production and application have been suggested as a novel approach to improve soil quality and increase agronomic productivity. Biochar significantly decreased soil bulk density (Zhang et al., 2012); increased soil cation exchange capacity (Liang et al., 2006); neutralized soil acidity and improved soil nutrients availability (Atkinson et al., 2010); increased overall net soil surface area (Chan et al., 2008); and improved soil water retention capacity (Asai et al., 2009; Masulili et al., 2010). Porous structure of biochar was also suitable as habitat of beneficial soil organisms and enhanced their activities (Unger et al., 2011). In addition, biochar decreased damages caused by soil borne plant pathogens (Elmer and Pignatello, 2011; Zwart and Kim, 2012).
Growth and yield improvement due to biochar application have been reported by many studies in both upland rice (Asai et al., 2009; Wang et al., 2012) and lowland rice (Zhang et al., 2012; Dong et al., 2015; Lakitan et al., 2018). Detailed investigation of the effects of biochar application on riparian wetland soil is crucial. Objective of this study was to evaluate benefits of biochar in improving soil chemical properties, enhancing growth, and increasing yield in rice.
Results
The effect of biochar application on soil characteristics
After harvest, the amended soils exhibited a slightly higher soil pH compared with the control. The bigger particle size (>1 mm) tend to increase pH higher than smaller size. Apparently, even when pH increased by the addition of biochar, this does not necessarily lead to a positive response regarding the cation exchange capacity, organic carbon, nitrogen, and exchangeable K. Interestingly, biochar application with the
particle size ≤ 1 mm increased available P concentration. In
contrast, the higher application rate of >1 mm biochar decreased the available P (Table 1).
Vegetative growth and yield components of rice
Pattern of crop height increase at later stage of vegetative growth to early generative stage or from 2 to 8 weeks after transplanting (WAT) followed an asymptotic curve. Shoot elongation rate was faster between 2 to 4 WAT and slowing down between 6-8 WAT (Table 2). Biochar application increased shoot elongation rate at the beginning of vegetative stage. Regarding the number of tillers, crops treated with biochar showed better performance (especially S1 treatment)
than untreated control (Table 3).
Biochar application significantly affected grain weight per panicle, number of filled spikelet, number of sterile spikelet, and weight of 1000 grains. Biochar application at rates of 3 t ha-1 produced the highest grain weight, number of filled spikelet, and weight of 1000 grains. A higher biochar application at rate of 4 t ha-1 decreased the number of filled spikelet in comparison to control (Table 4).
Growth analysis and dry matter accumulation
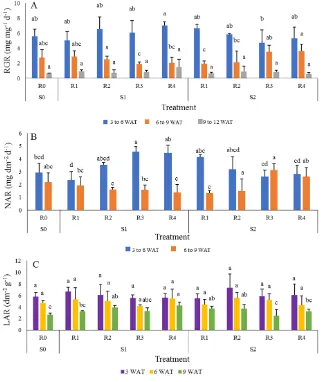
Regardless of particle size and rate of biochar applications, the fastest relative growth rate (RGR) was at the early vegetative biochar was used. During late vegetative stage, the trend was opposite to that of the early vegetative stage. During generative stage, there was no significant difference among combination of size and rate of application treatments (Fig1A). Net assimilation rate (NAR) at early and late vegetative stages followed similar patterns of RGR (Fig 1B). Leaf area ratio (LAR), across all biochar treatments, decreased as rice development progressed from early vegetative phase (3 WAT) to the transitional phase approaching generative stage (9 WAT) (Fig 1C). There was no significant difference in LAR among all combinations of size and rate of biochar application at 3 WAT and 6 WAT (late vegetative stage). Yet, differences in LAR were observed at 9 WAT. If fine size (S1) biochar used, LAR was
significantly higher at application rates of 2 and 4 t ha-1 than that of untreated control. However, if coarse (S2) biochar used,
significantly higher LAR was found at lower biochar application rates of 1 and 2 t ha-1.
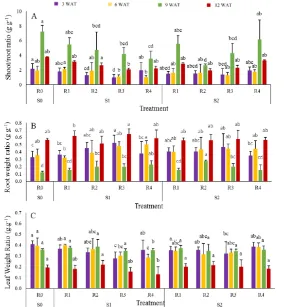
Shoot/root ratio (SRR) in rice increased during a period of 3 WAT to 9 WAT, sharp increase occurred at 9 WAT, but then SRR decreased at 12 WAT. This pattern was similar in both fine and coarse biochars (Fig 2A). Sharp increase of SRR at 9 WAT was associated with seed filling period. Therefore, seeds contributed significantly in increasing shoot weight during this seed filling period. During ripening period, root growth reaccelerated in search of water due to drying soil progression as indicated by increase in root weight ratio (RWR). The higher biochar application rate increased RWR at all growth stages if finer size biochar used; conversely, SRR at 3 WAT and 6 WAT was not significantly different with control and SRR decreased at 9 WAT and 12 WAT if coarse size biochar was used (Fig 2B). Decrease in leaf weight ratio (LWR) justified that rice plants did not develop new leaf after flag leaf was developed and the plants entered flowering stage. The highest leaf weight ratio (LWR) in rice was found generally at 3 WAT and slowly decreased until 12 WAT. LWR of rice treated with finer sized biochar was lower than control at all growth stages; similar effect was observed in rice treated with coarse biochar with an exception at 12 WAT (Fig 2C).
819
Table 1. The effect of biochar at different sizes and rate of applications on soil chemical characteristics measured after rice harvesting.
Treatment pH CEC
(cmol kg-1)
Organic C (g kg-1)
Total N (g kg-1)
Exchangeable K (cmol kg-1)
Available P (cmol kg-1) S0R0 4.51±0.02 a
z
15.23±1.17 a 2.93±0.11 a 0.89±0.16 a 2.13±0.36 a 8.87±1.40 a S1R1 4.55±0.18 a 15.23±2.18 a 3.14±0.04 a 0.70±0.14 ab 2.13±0.18 a 9.75±3.10 a
S1R2 4.52±0.19 a 15.23±2.18 a 2.90±0.45 a 0.56±0.24 bc 2.03±0.36 a 9.24±2.52 a
S1R3 4.54±0.14 a 13.78±2.51 a 2.90±0.12 a 0.61±0.16 bc 2.03±0.48 a 9.94±2.81 a
S1R4 4.53±0.18 a 15.23±2.18 a 3.01±0.16 a 0.70±0.28 ab 2.03±0.18 a 10.50±1.24 a
S2R1 4.61±0.20 a 15.33±1.25 a 2.83±0.54 a 0.56±0.14 bc 2.24±0.31 a 9.99±2.50 a
S2R2 4.69±0.32 a 13.05±0.00 a 2.77±0.32 a 0.79±0.08 a 2.03±0.18 a 8.82±3.51 a
S2R3 4.63±0.26 a 12.33±3.22 a 2.97±0.39 a 0.56±0.00 bc 1.92±0.31 a 8.03±1.03 a
S2R4 4.67±0.29 a 13.05±2.17 a 2.71±0.25 a 0.42±0.00 c 1.92±0.31 a 8.17±2.04 a z
Data are means of three replications ± standard deviation (SD).Data followed by similar letter within each column were not significantly different at LSD0.05.
820
Table 2. Biweekly increase in crop height and shoot elongation rate during vegetative stage of rice treated with different size and rate of biochar.
Treatment Week after transplanting (WAT)
2 4 6 8
Crop height (cm)
S0R0 37.44±1.30 a z
64.58±2.21 ab 92.88±4.15 a 108.47±2.72 a S1R1 38.73±3.62 a 69.04±3.52 a 95.16±2.75 a 109.10±2.75 a
S1R2 36.32±2.59 a 65.29±5.29 ab 91.06±6.24 a 109.88±7.46 a
S1R3 38.82±2.24 a 65.64±1.92 ab 94.33±0.97 a 110.85±0.64 a
S1R4 36.06±1.50 a 65.95±3.64 ab 94.43±3.15 a 111.47±2.77 a
S2R1 38.28±1.85 a 67.09±1.82 ab 95.82±4.09 a 110.84±2.54 a
S2R2 36.75±4.94 a 64.08±4.73 b 91.83±5.61 a 110.59±0.01 a
S2R3 37.48±0.56 a 65.28±2.86 ab 94.63±3.00 a 110.50±1.03 a
S2R4 37.21±0.66 a 66.10±0.52 ab 93.62±1.28 a 109.55±2.42 a
Treatment 2 to 4 4 to 6 6 to 8
Shoot elongation rate (cm d-1)
S0R0 1.94±0.22 a 2.02±0.15 a 1.11±0.11 a
S1R1 2.17±0.06 a 1.87±0.07 a 1.00±0.33 a
S1R2 2.07±0.23 a 1.84±0.15 a 1.58±0.32 a
S1R3 1.92±0.26 a 2.05±0.21 a 1.18±0.02 a
S1R4 2.14±0.17 a 2.03±0.17 a 1.22±01.5 a
S2R1 2.06±0.10 a 2.05±0.18 a 1.07±0.14 a
S2R2 1.95±0.09 a 1.98±0.15 a 1.34±0.40 a
S2R3 1.99±0.09a 2.10±0.02 a 1.13±0.29 a
S2R4 2.06±0.02 a 1.97±0.08 a 1.14±0.16 a
z
Data are means of three replications ± standard deviation (SD). Data followed by similar letter within each column were not significantly different at LSD 0.05.
821
Table 3. Biweekly increase in number of tillers during vegetative stage in rice treated with different size and application rate of biochar.
Treatment Week after transplanting (WAT)
4 6 8
S0R0 9.00±0.00 a 14.00±2.65 ab 14.00±2.31 a
S1R1 14.00±6.24 a 16.67±4.51 ab 18.22±3.51 a
S1R2 12.00±1.73 a 17.33±0.58 a 18.67±1.15 a
S1R3 13.00±2.00 a 16.33±3.06 ab 18.33±3.51 a
S1R4 13.67±2.52 a 17.67±2.89 a 18.67±2.89 a
S2R1 11.67±4.04 a 16.67±5.03 ab 17.33±5.51 a
S2R2 8.00±4.36 a 13.33±3.21 b 14.67±0.58 a
S2R3 10.33±2.08 a 16.00±4.58 ab 17.67±3.79 a
S2R4 12.33±0.58 a 17.00±1.73 ab 18.67±3.06 a
z
Data are means of three replications ± standard deviation (SD). Data followed by similar letter within each column were not significantly different at LSD0.05.
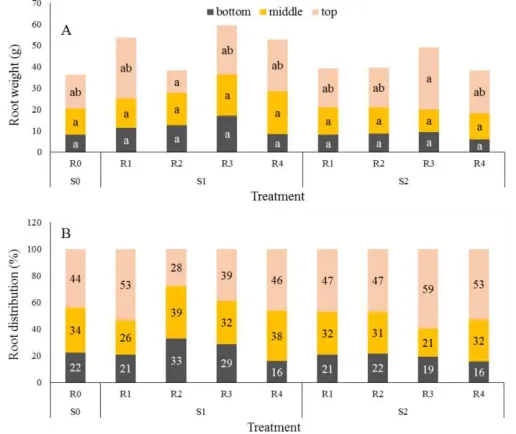
Fig 3. Root weight (A) and root distribution (B) at depth of 0-6 cm (top layer), 6-12 cm (middle layer), and 12-18 cm (bottom layer) of rice plants grown in substrate treated with different sizes and application rates of biochar. Different letters indicate significant differences between pair of treatments based on LSD0.05.
Table 4. Effect of biochar at different sizes and rate of applications on rice yield components.
Treatments Grain weight (g/panicle) Filled spikelet/panicle Sterile spikelet per panicle
Weight of 1000 grains (g)
S0R0 3.67 ab
z
146.67 ab 17.00 ab 22.44 a
S1R1 3.83 ab 148.67 ab 27.00 ab 21.91 a
S1R2 3.44 b 142.00 ab 23.67 ab 20.78 ab
S1R3 4.25 ab 170.00 a 23.67 ab 21.91 a
S1R4 3.83 ab 153.33 ab 43.33 a 19.41 b
S2R1 3.96 ab 159.33 ab 14.33 b 22.81 a
S2R2 3.56 ab 131.00 b 38.33 ab 20.89 ab
S2R3 4.35 a 178.33 a 22.67 ab 21.64 ab
S2R4 3.77 ab 147.00 ab 24.67 ab 21.98 a
LSD0.05 0.86 36.76 26.53 2.35
F-calculated 1.08* 1.39* 1.1* 1.72*
z
822
Fig 4. N content of root (A), stem (B), leaf (C), and whole plant (D) of rice treated with biochar at different sizes and rate of applications. Bars (means ± SD, n=3) with different letters are significantly different based on LSD0.05.
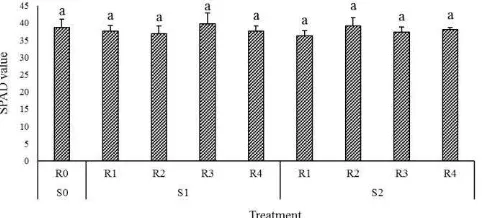
Fig 5. SPAD value of rice treated with biochar at different sizes and rate of applications. Bars (means ± SD, n=3) with similar letters are not significantly different based on LSD0.05.
not found at all soil layers of 0-18 cm (Fig 3A). On average, regardless of sizes and rates of biochar application, almost half of rice roots was distributed within 6 cm of the top layer and more than 70 % of the roots were distributed within the depth of 0-12 cm (Fig 3B). This finding justifies that rice is a shallow rooted plant.
Nitrogen content and SPAD value
Biochar application on rice significantly affected content of nitrogen in stem for treatment S1R4 (Fig 4B). Insignificant
effects were discovered in root, leaf and whole plant N contents (Fig 4A, 4Cand 4D). The highest leaf N content was observed in rice plants treated with fine size biochar at application rate of 3 t ha-1(S1R3), while the highest stem N
content was found at application rate of 4 t ha-1 (S1R4).
Interestingly, there was similar pattern of leaf N content with measured SPAD value (Fig 5).
Discussion
Soil chemical properties and crop N contents
Biochar application increased soil pH compared to the untreated control but did not affect the cation exchange
capacity, organic carbon, total nitrogen, and exchangeable K (Table 1). A slight increase of pH (0.04 units of pH) after application of 3 t ha-1 non-crushed rice husk biochar on acidic Indonesian mineral soils have been reported previously by Martinsen et al. (2015). It should be noted, however, that effects of biochar on soil pH may vary due to different particle size and time of pH measurement after biochar application. Biochar is commonly alkaline, therefore it can be utilized as a soil amendment to neutralize soil acidity (Liang et al., 2006; Novak et al., 2009; Yuan et al, 2011).
In this study, the biochar-treated soil did not exhibit a significant increase in availability of soil nutrients. It was assumed that some nutrients had been released and absorbed during crop growth (Fig 4). In addition, the biochar could not release all nutrients in short period of time. Previous research reported that biochar might retain essential nutrients and then over time, slowly discharge the nutrients that could be subsequently utilized by plants (Laird et al., 2010; Knowles et al., 2011; Taghizadeh-Toosi et al., 2012). Furthermore, Carter et al. (2013) reported that some nutrients retained in biochar may become directly available through the solubilization processes, but other nutrients may become available through microbial activity.
823
proteins, and contributes in producing chemical components for plant protection. Therefore, crop yield and biomass are highly affected by N fertilization (Muñoz et al., 2013). Application of biochar has been reported to increase N uptake. Increase in the N uptake possibly occurred due to increase of availability of the nutrient in the soil (Uzoma et al., 2011). In our study, biochar application in most cases decreased total N in the soil as compared to control (Table 1). Nevertheless, N content at whole plant level and in roots were not significantly affected. Effects of fine biochar application on stem and leaf were inconsistent. Only application at 4 t ha-1 significantly increased stem N content. Application at 3 t ha-1 was significantly higher leaf N content than lower application rates (Fig 4). Higher N content in leaf and stem indicated that N absorbed by roots was translocated to crop shoot.
Brunetto et al. (2012) reported that SPAD value was related to the chlorophyll contents of the leaves, total N content, and yield in grape. The SPAD values were affected by variety, age, growth stage, leaf thickness, leaf positions and the measurement point on the leaf. According to Xiong et al. (2015), proportion of leaf N allocated to chlorophyll increased with increasing leaf N content in monocots. In our study, the SPAD values were measured on upper leaves and was found did not affected by biochar application at any rates and sizes (Fig 5). Yang et al. (2014) explained that lower leaves were more sensitive to the N level than the upper leaves in rice.
Effects of biochar on rice growth and development
The effect of biochar application on soil properties was reflected in the growth and biomass production in rice. Biochar did not affect the early vegetative growth in rice as indicated by crop height and shoot elongation rate in this study (Table 2). This fact was associated with slow release nature of this biomaterial. However, restricted growth of vegetative organs should not be a disadvantage as long as it did not reduce yield. In addition, shorter rice crop was an advantage since the crop could withstand lodging damage at higher wind speed conditions.
Plant growth can be assessed with RGR which represents the growth on unit mass over time scale. In our study, RGR was higher at the early of vegetative stage and declined sharply at late vegetative and reproductive stages (Fig 3). Rees et al. (2010) reported that the RGR decline with time was because of increasing resource restriction. Azarpour, et al. (2014) stated that rate of dry matter accumulation was characterized by three distinct phases: (1) period of exponential growth during early development, (2) period of constant rate dry matter accumulation, and (3) period of declining growth rates during the final phase of development. Increase of the RGR due to biochar application was an evidence that biochar could improve crop growth.
Biochar application had reciprocal effects on NAR (increase) and LAR (decrease). Increase in NAR was basically due to an increase in photosynthetic capacity per unit leaf area and at the same time decreased specific leaf weight (Poorter et al., 2012). The value of LAR was high at early growth stage and then it gradually decreased (Azarpour, et al., 2014).
Biochar application decreased SRR and LWR (Fig 2). This finding was in contrast with Yang et al. (2015) and Noguera et al. (2010) who found an increase of SRR in rice and sugarcane, respectively. The effect of biochar on SRR strongly varies depending on soil moisture condition. Biochar had no effect to SRR in poor soil but caused it increase in the rich soil (Noguera et al., 2010). However, a lower SRR is a favorable for rice to confront water stress at generative stage as it is usually happening at riparian wetland ecosystem. According to Binotto et al. (2010), a high SRR would have a greater transpiring surface which could be detrimental during a drought or water stress condition.
There was a trend of increase in root weight and its distribution with biochar application (Fig 3). Increase in soil pH as influenced by biochar amendment is assumed to have an indirect effect on root growth. Abiven et al. (2015) found that biochar application increased root area, root depth, and development of fine roots. Yang et al. (2015) complemented that biochar application could improve other root properties, including length, volume, average diameter, number of tips and number of forks.
Bakar et al. (2015) reported that at a low soil pH, rice root growth might be irregularly altered, especially when planted in the acidic soil without application of soil amendment. In compact soil, biochar decreased soil density (Glaser et al., 2002), facilitated root proliferation by providing wider or additional pores (Bruun et al., 2014) and retained plant-available water due to its higher water holding capacity (Martinsen et al., 2015). In this study, addition of biochar slightly altered root distribution. More roots were distributed at upper layer of the growing substrate. Root distribution or accumulation significantly affected by soil physical-chemical conditions (Poorter et al., 2012). Moreover, Reyes-Cabrera et al. (2017) reported that root distribution was more concentrated in the biochar-amended soil sections due to more favorable conditions for root growth.
Effects on yield components
Yield and its formation process depended on genetic, environmental and agronomic factors as well as the interaction between them (Sidlaukas et al., 2003). The yield of crop is strongly affected by flowering and fruiting process. In our study, biochar application inconsistently affected weight of 1000 grains (Table 4). Similar results were reported by Miranda et al. (2017). Increasing yield due to biochar application also was reported by Asai et al. (2009). Fahad et al. (2015) revealed that biochar improved pollen development and anther dehiscence.
Materials and methods
Plant materials
824
weeks. Then, the two-week old seedlings were transplanted into pots filled with original riparian wetland soils. Three rice seedlings were transplanted as one hill in each pot. During cultivation, watering was adapted with the condition in riparian wetland. Water level in each pot was maintained at 5 cm above soil surface. All crops were treated alike for inputs and agronomic practices except for treatments. Basic fertilizers equivalent to 0.175 g N, 0.035 g P2O5, and 0.035 g K2O) were
The air-dried rice husks were used for biochar production since this biomaterial was largely available in rice growing area at wetland ecosystem. Rice husk biochar was produced using a simple method with two different size containers. A larger container was 90 cm in height and 58 cm diameter. The smaller but taller container made of metal sheet was 100 cm in height and 20 cm in diameter. Some small holes were made firewood within the smaller container to trigger the pyrolysis process on the rice husks. After 5 hours when all firewood had burnt up, produced rice-husk biochar was collected. Biochar produced was about 20% of the original rice husk biomass. The biochar was then cooled down, crushed, and sieved with 1 mm sieve to split the biochar into fine (< 1 mm) (S1) and coarse
sizes (>1 mm) (S2). The specification of produced biochar were
6.81% water, 21.75% ash, pH 7.25, 31.18 g kg-1 organic carbon, 84.37 mg kg-1 available P, 4.2 g kg-1 total N, 0.28 cmol kg1 exchangeable K, 1.27 cmol kg-1 Ca, and 0.16 cmol kg-1 Mg.
Pot experiment
A pot experiment was carried-out in a greenhouse of Universitas Sriwijaya, Indonesia, from January to April 2017. The pots 26 cm in height and diameter of 22 cm (bottom) and 30 cm (top), were filled with 7 kg soil. The soil was originally from paddy field at riparian wetland at Pemulutan Ulu Village
(3o ’ . ”S, o ’ 8. ”E , South Su atra, I do esia. The
Rice husk biochar was applied and mixed thoroughly a week prior to transplanting. The research was arranged on Completely Randomized Block Design with 9 treatments and 3 replications (each replication consisted of 10 pots). There were 270 pots in total. Biochar applications consisted of two particle sizes (S1 and S2) and four biochar application rates at 1,
2, 3, and 4 t ha-1 (R1, R2, R3, and R4, respectively), plus
untreated control (S0R0).
Growth analysis
Plant material for basis data for rice growth analysis was destructively collected at 3, 6, 9, and 12 WAT. Three plant samples per treatment were randomly selected and separated into functional parts, namely leaf, stem, root, and reproductive organ. Leaf length and width were measured for estimating rice leaf area. Dry weight of the crop organs was measured using digital balance after drying them in oven at 70°C for two days. The collected basis data were used for calculating growth analysis parameters, including RGR, NAR, LAR, SRR, LWR, and RWR.
Root distribution
During generative stage, the soil in the pots was let gradually dried. Therefore, at harvest time the soil had been moderately dry. At these circumstances, the substrate soil had been content of the soil and presence of massive rice roots. The soil mass was gently sliced into three layers to represent the depths of 0 to 6 cm, 6 to 12 cm, and 12 to 18 cm, respectively. After slicing, each layer was separated and soaked in a bucket full of water for 1 day. On the following day, rice roots were washed with tap water and filtered with a 1-mm sieve. Collected rice roots were dried in oven at 70oC for 2 days for measuring thire dry weight and further used in analyzing root biomass distribution.
treatments were air dried, homogenously mixed, grounded and passed through a 2-mm sieve. The soil pH was measured using pH meter (HANNA HI 98129 Combo). Total N was analyzed by following macro Kjeldahl method in both soil and crop organs (Jackson, 1973). K was extracted with ammonium acetate (1:25 ratio) and measured by flame photometer (Black, 1965). The CEC was calculated using Black’s procedure (Black,
825
differences amongst treatments of those variables were further tested using the Least Significant Difference (LSD0.05).
Conclusion
Based on results of this study, application of biochar on riparian wetlands exhibited some promising positive impacts on soil properties, growth, and yield of rice. Application of biochar increased soil pH but did not affect cation exchange capacity (CEC), and availability of major soil nutrients. During vegetative stage, biochar application increased relative growth rate (RGR) and net assimilation rate (NAR) but decreased leaf are ratio (LAR). Application of fine size biochar at 3 t ha-1 significantly increased grain weight per panicle, number of filled spikelet, and weight of 1000 grains. Root and stem N content tended to be higher with biochar application. Research on long term residual effects of biochar application in tropical riparian wetland needs to be pursued for a more comprehensive understanding.
Acknowledgement
The authors would like to express gratitude to editor of the AJCS and the anonymous reviewers for their constructive comments on this manuscript. We also appreciated our colleagues who had given us constructive notes during internal discussion at the LPPM Universitas Sriwijaya. This work was supported by the Program PMDSU 2016 (SK No.326/SP2H/ LT/DRPM/IX/2016) and the Program Penelitian Unggulan Profesi 2017 Universitas Sriwijaya (SK No.0570/UN9/PP/2017).
Reference
Abiven S, Hund A, Martinsen V, Cornelissen G (2015) Biochar amendment increases maize root surface areas and branching: a shovelomics study in Zambia. Plant Soil. 395(1-2): 45-55.
Asai H, Samson, BK, Stephan HM, Songyikhangsuthor K, Homma K, Kiyono Y, Inoue Y, Shiraiwa T, Horie T (2009) Biochar amendment techniques for upland rice production in Northern Laos: 1. Soil physical properties, leaf SPAD and grain yield. Field Crop Res. 111(1): 81-84.
Atkinson CJ, Fitzgerald JD, Hipps NA (2010) Potential mechanisms for achieving agricultural benefits from biochar application to temperate soils: a review. Plant Soil. 337: 1– 18.
Azarpour E, Moraditochaee M, Bozorgi HR (2014) Effect of nitrogen fertilizer management on growth analysis of rice cultivars. Int J Biosci. 4(5): 35-47.
Bakar RA, Razak ZA, Ahmad SH, Seh-Bardan BJ, Tsong LC, Meng CP (2015) Influence of oil palm empty fruit bunch biochar on floodwater pH and yield components of rice cultivated on acid sulphate soil under rice intensification practices. Plant Prod Sci. 18(4): 491-500.
Binotto AF, Lúcio ADC, Lopes SJ (2010) Correlations between growth variables and the Dickson quality index in forest seedlings. Cerne. 16(4): 457-464.
Brunetto G, Trentin G, Ceretta CA, Girotto E, Lorensini F, Miotto A, Mosser GRZ, de Melo GW (2012) Use of the
SPAD-502 in estimating nitrogen content in leaves and grape yield in grapevines in soils with different texture. Am J Plant Sci. 3(11): 1546-1561.
Bruun EW, Petersen CT, Hansen E, Holm JK, Hauggaard-Nielsen H (2014) Biochar amendment to coarse sandy subsoil improves root growth and increases water retention. Soil Use Management. 30: 109–118.
Carter S, Shackley S, Sohi S, Suy TB, Haefele S (2013) The impact of biochar application on soil properties and plant growth of pot grown lettuce (Lactuca sativa) and cabbage (Brassica chinensis). Agronomy. 3(2): 404-418.
Chan KY, Van ZL, Meszaros I, Downie A, Joseph S (2008) Using poultry litter biochars as soil amendments. Soil Res. 46(5): on mycorrhizal associations and fusarium crown and root rot of asparagus in replant soils. Plant Dis. 95(8): 960-966. Fahad S, Hussain S, Saud S, Tanveer M, Bajwa AA, Hassan S,
Shah AN, Ullah A, Wu C, Khan FA, Shah F (2015) A biochar application protects rice pollen from high-temperature stress. Plant Physiol Bioch. 96: 281-287.
Glaser B, Lehmann J, Zech W (2002) Ameliorating physical and chemical properties of highly weathered soils in the tropics with charcoal-a review. Biol Fert Soils. 35(4): 219-230. Irmawati, Ehara H, Suwignyo RA, Sakagami JI (2015) Swamp
rice cultivation in South Sumatra, Indonesia. Trop Agr Develop. 59(1): 35-39.
Knowles OA, Robinson BH, Contangelo A, Clucas L (2011) Biochar for the mitigation of nitrate leaching from soil amended with biosolids. Sci Total Environ. 409(17): 3206-3210.
Lakitan B, Alberto A, Lindiana L, Kartika K, Herlinda S, Kurnianingsih A (2018) The benefits of biochar on rice growth and yield in tropical riparian wetland, South Sumatera, Indonesia. Chiang Mai Univ J Nat Sci. 17(2): xx-xx. Laird D, Fleming P, Wang B, Horton R, Karlen D (2010) Biochar
impact on nutrient leaching from a midwestern agricultural soil. Geoderma. 158(3): 436-442.
Liang B, Lehmann J, Solomon D, Kinyangi J, Grossman J, O'Neill BJ, Skjemstad JO, Thies J, Luizao FJ, Petersen J, Neves EG (2006) Black carbon increases cation exchange capacity in soils. Soil Sci Soc Am J. 70(5): 1719-1730.
Masulili A, Utomo WH, Syechfani MS (2010) Rice husk biochar for rice based cropping system in acid soil 1. The characteristics of rice husk biochar and its influence on the properties of acid sulfate soils and rice growth in West Kalimantan, Indonesia. J Agr Sci. 2(1): 39-47.
826
succession of upland rice and cowpea fertilized with nitrogen. Rev Caatinga. 30(2): 313-323.
Muñoz-Huerta RF, Guevara-Gonzalez RG, Contreras-Medina LM, Torres-Pacheco I, Prado-Olivarez J, Ocampo-Velazquez RV (2013) A review of methods for sensing the nitrogen status in plants: advantages, disadvantages and recent advances. Sensors. 13(8): 10823-10843.
Noguera D, Rondón M, Laossi KR, Hoyos V, Lavelle P, de Carvalho MHC, Barot S (2010) Contrasted effect of biochar and earthworms on rice growth and resource allocation in different soils. Soil Biol Biochem. 42(7): 1017-1027.
Novak JM, Busscher WJ, Laird DL, Ahmedna M, Watts DW, Niandou MAS (2009) Impact of biochar amendment on fertility of a southeastern coastal plain soil. Soil Sci. 174: 105–112.
Poorter H, Niklas KJ, Reich PB, Oleksyn J, Poot P, Mommer L (2012) Biomass allocation to leaves, stems and roots: meta-analyses of interspecific variation and environmental control. New Phytol. 193(1): 30-50.
Rees M, Osborne CP, Woodward FI, Hulme SP, Turnbull LA, Taylor SH (2010) Partitioning the components of relative growth rate: how important is plant size variation?. Am Nat. 176(6): 152-161.
Reyes-Cabrera J, Leon RG, Erickson J, Silveira ML, Rowland DL, Morgan KT (2017) Biochar changes shoot growth and root distribution of soybean during early vegetative stages. Crop Sci. 57(1): 454-461.
Sidlauskas G, Bernotas S (2003) Some factors affecting seed yield of spring oilseed rape (Brassica napus L.). Agron Res. 1(2): 229-243.
Taghizadeh-Toosi A, Clough TJ, Condron LM, Sherlock RR, Anderson CR, Craigie RA (2012) Biochar incorporation into pasture soil suppresses in situ nitrous oxide emissions from ruminant urine patches. J Environ Qual. 40(2): 468-476.
Unger R, Killorn R (2011) Effect of the application of biochar on selected soil chemical properties, corn grain, and biomass yields in Iowa. Commun Soil Sci Plan. 42(20): 2441-2451. Uzoma KC, Inoue M, Andry H, Fujimaki H, Zahoor A, Nishihara E
(2011) Effect of cow manure biochar on maize productivity under sandy soil condition. Soil Use Manage. 27(2): 205-212. Wang J, Pan X, Liu Y, Zhang X, Xiong Z (2012) Effects of biochar
amendment in two soils on greenhouse gas emissions and crop production. Plant Soil. 360(1-2): 287-298.
Xiong D, Chen J, Yu T, Gao W, Ling X, Li Y, Peng S, Huang J (2015) SPAD-based leaf nitrogen estimation is impacted by environmental factors and crop leaf characteristics. Sci Rep-UK. 5: 1-12.
Yang L, Liao F, Huang M, Yang L, Li Y (2015) Biochar improves sugarcane seedling root and soil properties under a pot experiment. Sugar Tech. 17(1): 36-40.
Yang H, Yang J, Lv Y, He J (2014) SPAD values and nitrogen nutrition index for the evaluation of rice nitrogen status. Plant Prod Sci. 17(1): 81-92.
Yuan JH, Xu RK, Zhang H (2011) The forms of alkalis in the biochar produced from crop residues at different temperatures. Bioresource Technol. 102(3): 3488-3497. Zhang A, Bian R, Pan G, Cui L, Hussain Q, Li L, Zheng J, Zheng J,
Zhang X, Han X, Yu X (2012) Effects of biochar amendment on soil quality, crop yield and greenhouse gas emission in a Chinese rice paddy: a field study of 2 consecutive rice growing cycles. Field Crop Res. 127: 153-160.
Zhang M, Ok YS. Biochar soil amendment for sustainable agriculture with carbon and contaminant sequestration. Carbon Manag. 5(3): 255-257.