The effects of land use changes on some soil properties
in
İ
nda
ğı
Mountain Pass
–
Çank
ı
r
ı
, Turkey
M. Başaran&G. Erpul&A. E. Tercan& M. R. Çanga
Received: 29 May 2006 / Accepted: 23 February 2007 / Published online: 12 June 2007 #Springer Science + Business Media B.V. 2007
Abstract Understanding spatial variability of dy-namic soil attributes provides information for suitably using land and avoiding environmental degradation. In this paper, we examined five neighboring land use types in Indagi Mountain Pass – Cankiri, Turkey to
spatially predict variability of the soil organic carbon (SOC), bulk density (BD), textural composition, and soil reaction (pH) as affected by land use changes. Plantation, recreational land, and cropland were the lands converted from the woodland and grassland which were original lands in the study area. Total of 578 disturbed and undisturbed soil samples were taken with irregular intervals from five sites and represented the depths of 0–10 and 10–20 cm. Soil
pH and BD had the lower coefficient of variations (CV) while SOC had the highest value for topsoil. Clay content showed greater CV than silt and sand
contents. The geostatistics indicated that the soil properties examined were spatially dependent to the different degrees and interpolations using kriging showed the dynamic relationships between soil properties and land use types. The topsoil spatial distribution of SOC highly reflected the changes in the land use types, and kriging anticipated significant decreases of SOC in the recreational land and cropland. Accordingly, BD varied depending on the land use types, and also, the topsoil spatial distribu-tion of BD differed significantly from that of the subsoil. Generally, BD greatly decreased in places where the SOC was relatively higher except in the grassland where overgrazing was the more important factor than SOC to determine BD. The topsoil spatial distributions of clay, silt, and sand contents were rather similar to those of the subsoil. The cropland and grassland were located on the very fine textured soils whereas the woodland and plantation were on the coarse textured soils. Although it was observed a clear pattern for the spatial distributions of the clay and sand changing with land uses, this was not the case for the silt content, which was attributed to the differences of dynamic erosional processes in the area. The spatial distribution of the soil pH agreed with that of the clay content. Soils of the cropland and grassland with higher amounts of clay characteristi-cally binding more cations and having higher buffer-ing capacities had the greater pH values when compared to the soils of other land uses with higher DOI 10.1007/s10661-007-9668-4
M. Başaran (*)
Seyrani Faculty of Agriculture, Erciyes University, Develi, Kayseri, Turkey
e-mail: [email protected]
G. Erpul
:
M. R. ÇangaFaculty of Agriculture, Department of Soil Science, Ankara University,
Diskapi, Ankara 06110, Turkey
A. E. Tercan
amounts of sand naturally inclined to be washed from the base cations by the rainwater.
Keywords Spatial variability . Land use changes . Organic carbon . Bulk density . Textural composition . Soil reaction
Introduction
Spatial variability of soil properties affected soil per-formance and therefore the crop yield (Warrick and Gardner1983). Understanding changes of soil prop-erties in the field scale guided plant nutrient appli-cations (Robert et al. 1993) and optimized irrigation budget in salinity management (Russo 1984). There-fore, there is a great need to spatially investigate the variability of dynamic soil attributes to refine the ag-ricultural management practices, from which expected is less environmental degradation.
Spatial changes in soil properties can result from soil formation factors. Mineral composition and textural class of soil considerably determine the manner in which it can be used. Based on clay content, which affects most of the agriculturally significant soil properties such as water holding capacity, permeability to water, aeration, plasticity and nutrient-supplying ability and cation exchange capacity (Mapa and Kumaragamage 1996), some generalizations can be made about soil behavior (Uehara and Gillman1981). Similarly, the soil reaction (pH) is another significant soil property to predict nutrient availability and determine soil ability to benefit from fertilizer and amendments. Dhillion et al. (1994) used pH as an indicator of soil fertility in strategies based on spatial analysis of plant nutrients. Bauer and Black (1994) quantified the effects of organic matter content on soil productivity.
On the other hand, spatial variations in soil properties can also stem from soil management factors or can be in relation to land use at different scales. Soils of the natural ecosystems have been characterized by natural soil intrinsic factors such as climate, topography, aspect, bedrock, and vegetation. And, land use changes could also have characterizing effects on soils due to the extrinsic factors such as fertilization, cultivation, over grazing and management. In recent years, there has been a great need for estimating variations in soil quality especially by human pressure, aiming at an improve-ment in the agricultural manageimprove-ment practices and
decreases in environmental damage. Wali et al. (1999) and Mahtab and Karim (1992) reported that expanding cropland at the expense of woodland and grassland was one of the main reasons of degrading soil properties.
Changes in land use can have a marked effect on soil organic carbon content by means of humification, decomposition and mineralization of soil organic matter. The alteration of forest and pastureland into arable agriculture is one of the main causes of de-grading soil organic matter. Cultivation of pastures led to 25–50% decrease in soil organic carbon (Elliott
1986; Grupta and Germida 1988). In China, when Alpine grassland soils were converted into arable land for 8, 16, and 41 years, it was indicated by Wu and Tiessen (2002) that the organic matter content of soils decreased by 25, 39, and 55%, respectively. Celik (2005) has recently reported that relative to soil or-ganic matter of the forest and pasture soils in a south-ern Mediterranean highland of Turkey, soil organic matter of the cultivated soils decreased by 44 and 48% for the 0–10 cm layer and 48 and 50% for the
10–20 cm layer over 12 years, respectively.
Land degradation and loss of soil organic matter is closely linked to the deterioration of such significant soil physical properties as pore size distribution, bulk density, aggregation and aggregate stability (Tisdall and Oades 1982; Elliott 1986). Hajabbasi et al. (1997) found that deforestation and successive tillage practices caused nearly 20% increase in bulk density and a 50% decrease in soil organic matter for a soil depth of 0–
30 cm over 20 years in the central Zagrous mountain in Iran. Shukla et al. (2004) documented that the bulk density was the most discriminating soil attribute or the dynamic soil quality indicator for ascertaining temporal changes in soil properties in relation to land use and management. Cultivated soils had higher bulk density than adjacent soils under forests and pastures for the 0–
10 and 10–20 cm layers in a southern Mediterranean
highland of Turkey (Celik2005).
In recent years soil scientists focused on predicting spatial variability of soil properties using geostatistics and different kriging methods to better understand the influence of land use changes on soil properties over small to large spatial scale (Yost et al.1982; Trangmar et al. 1987; Miller et al. 1988; Voltz and Webster
1990; Chien et al.1997; Tsegaye and Hill1998; Lark
2002; Bo et al. 2003).
Atalay (1997) gives details of highlands of Turkey. He reports that ecosystems at elevations of 1,500 m
and higher with the slope range of 15–40% still
account about 26 and 34% of the total area of 759,978 km2, respectively, although important
changes have occurred in rural ecosystems over the past five decades in a large part of Turkey. Cropland of Turkey increased approximately 18 Mha from 1952 to 2000 (Anonymous 2000), and overgrazing, deforestation, and increase in agricultural activity have intensified pressures on high-altitude fragile ecosystems (Evrendilek et al. 2004). The objective of this study is to geostatistically examine the effect of land use changes on carbon content, bulk density, reaction and texture of soils of Indagi Mountain Pass of Cankiri, Turkey, where woodland is an important source of vegetation and soil organic carbon, and woodland of the Mountain Pass has been already strongly affected by agricultural expansion due to the population growth and socio-economical conditions in the region. It is expected by this research that explaining any variation in soil properties affected by land use changes would provide information for optimization of land use distribution and improve-ment of ecological soil functions.
Materials and methods
Site description
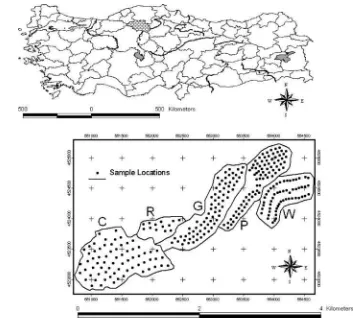
Study site is located in the Indagi Mountain Pass of Cankiri at an altitude of 1,450 m above sea level and approximately 131 km north of Ankara, Turkey (Fig.1). The whole region has terrestrial climate with annual precipitation of 500–800 mm with actual
amounts determined by elevation, and average tem-perature is 21.1°C in summer and −0.5°C in winter. There are no significant climatic differences in the study area to the extent that climate could alone have an effect in changing soil properties regardless of the land use changes. Uniform local climate exists in the five bordering land use types chosen as the research site. However, micro-climatic conditions resulted from topographical discrepancies in the study area might be expected to have an influence on varying soil properties.
The geological strata in the study area belong to Pliocene Ilgaz formation and Miocene Mamak for-mation. While the former mainly contains sandstone, claystone, conglomerate, breccia, and marn, the latter
is composed of magmatic rocks like serpentine, an-desite, and basalt. Sandstone, conglomerate, and breccia of the Ilgaz formation are calcium carbonate-and iron oxide-cemented rocks. In situ observations showed that serpentines of the Mamak formation greatly underwent the carbonization by hydrothermal alteration. The soil forming factors relief, parent ma-terial, climate, organisms, and time control the spatial variation of soil properties within landscapes. A large heterogeneity in terms of the soil formation may occur at greater depths and this study did not aim to cover the soil property change with the soil depth at which geology changed. Therefore, notwithstanding the underlying geology, the more homogenous soil properties found close to the soil surface were con-sidered in this study.
Selected site for this research contains five adjacent land use types, cropland, grassland, woodland, plan-tation, and recreational land. Of these land uses, cropland, plantation, and recreational land have been converted from the grassland or woodland which were original land uses in the ecosystem of Indagi Mountain Pass. The woodland comprises of Pinus nigra Arn. and Quercus pubescens Willd. Principal tree species of the plantation, which was replaced by the original woodland 40 years ago, is Pinus nigra Arn., which is also principal tree species of the recreational land in the site. The observations also showed that there were remnants of quite old Pinus nigra Arn. and Quercus pubescens Willd. in the cropland, grassland, and recreational land either in isolation or in groups. Age determination indicated these remnant trees were 155 years old. Forests of Pinus nigra Arn. are protected in the mid of the treeless plains and floristically in very poor conditions in the central Turkey (Akman 1995). Aytug (1970) reported the fact that such species as Quercus pubescensWilld.,Quercus cerrisL., Pyrus elaeagni-folia Pall., and Cistus larifolius L. exists in the Anatolia could be proof of existence of Pinus nigra Arn. since it descended from them, and that Pinus nigraArn. vanished in time. These old remnant trees found in the cropland, grassland, and recreational land in addition to those present in the woodland and plantation indicated that original land use over the whole study area was natural forest.
(D.C) Schultz Bip., Salvie virgata Jacq., Trifolium campestre Schreb., Verbascum glomeratum Boiss., and Dactylis glomerate L. Agricultural crops are mostly wheat (Tritucum aestivum L.) and barley (Hordeum vulgareL.).
Using conventional methods outlined in the man-ual by the Soil Survey Staff (1993), soil horizons of the 13 soil pits were sampled and described according to Soil Taxonomy (Soil Survey Staff 1999). The method required both pedon-level data and horizon-level data for soil classification. The former contained site-level data such as soil series name and geographic location and the latter contained the physical and chemical characterization data for individual soil horizons. Lithic Exerorthents, Lithic Haploxererts, Typic Haploxererts, Lithic Haploxerepts, and Typic Haploxerepts are the dominant soils of the area. Time, topography and climate were major factors control-ling soil formation. Soils especially formed on the gently and steeply sloping areas were characterized with shallow soil profiles and did not have distinct
pedogenic horizons. These soils were classified as Entisols. Inceptisols were characterized with Cambic and Calcic horizons while Vertisols were character-ized with deep-wide cracks and slickensides. Most of the soils were placed in Lithic Subgroup because of the limited soil depth.
Generally, soil texture is clay loam (CL) in both cropland and grassland, and sandy loam (SL) in woodland, plantation, and recreational land.
Soil sampling and analyses
An area of 1,200×4,200 m was selected within the Indagi Mountain Pass in August 2004, covering all land use types. With irregular intervals, soil samples were taken from 0–10 and 10–20 cm soil depth. The
mean sampling intervals were 43, 50, 64, 78, 85 m for woodland, plantation, grassland, recreation, cropland, respectively, and was 64 m for whole area. Figure 1
shows 289 locations of soil sampling, and total of 578 disturbed and undisturbed samples by 100 cm3 steel
Fig. 1 Study area
cores were analyzed for clay, silt, and sand contents by hydrometer method (Gee and Bauder 1986), for soil organic matter (SOM) content by the method of Nelson and Sommers (1982), and SOM was con-verted to SOC, based on SOC = 0.58 SOM, for pH with glass electrode in a 1:2.5 soil/water suspension (Page et al.1982), and for soil bulk density (BD) by Blake and Hartge (1986).
Statistical analysis
Descriptive statistics were used to express the overall variability within the study area. Spatial variability in soil properties was defined using geostatistical meth-ods. Experimental semivariograms were developed to determine the spatial dependence of soil properties using the following equation given by Journal and Huijbregts (1978) and reviewed Trangmar et al. (1987):
whereγ(h)is the semivariance;N(h)is the number of experimental pairs separated by a distance h; z(xi)is
the measured sample value at pointxi; andz(xi+h)is
the measured sample value at pointxi+h.
The spherical and the gaussian models are the most commonly used theoretical models and these models are, respectively, described by:
where,C0is the nugget variance,C; partial sill value,
andC0+C; sill value, respectively; andais the range
of influence for the spherical model (Samra et.al.
1988). The rangeafor the Gaussian model is described as practical range at which the semivariogram reaches 95% of its sill value (Pannatier 1996). The model parameters are estimated visually as suggested by Vieira et al. (1983) and Cuenca and Amegee (1987). Kriged estimate z*(x0) and error estimation variance
σk 2
(x0) at any point x0 were, respectively, calculated
as follows:
where,liare the weights;μis the lagrange constant; and γ(x0−xi) is the semivariogram value
corre-sponding to the distance between x0and xi (Vauclin
et.al. 1983; Agrawal et. al.1995). In addition to the geostatistics, analysis of variance (ANOVA) was per-formed to compare the effects of land use types on the soil properties for two depths of 0–10 and 10–20 cm
individually.
Results and discussion
Variation of soil properties among different land uses
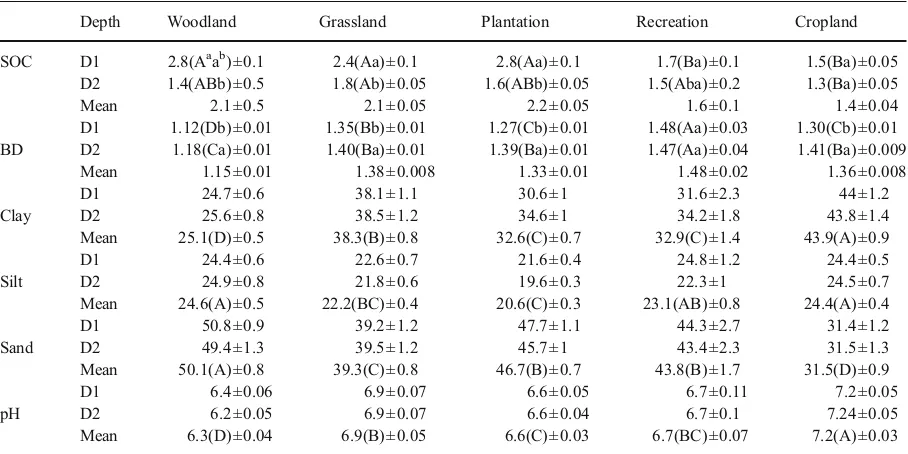
Table 1 shows analysis of variance to compare the effects of different land use types on SOC, BD, pH, and textural composition of soils for two soil depths of 0–10 and 10–20 cm. In Table 1, while upper case
letters indicate statistically significant differences among soil properties affected by the different land uses, lower case letters show those between soil depths for the cases that there were interactions be-tween land use type and depth. Additionally, if there was no significant difference in the soil properties with the soil depth for each land use type, the com-parisons were made for the mean of both depths among different land uses. Means superscripted by the same upper case or lower case letters are not significant at p<0.05.
woodland and grassland, SOC of the cropland de-creased by 46 and 38%, respectively, for the 0–10 cm
depth. This decrease was, respectively, by 39 and 29% when SOC of the recreational land was compared to those of the woodland and grassland. Evrendilek et al. (2004) and Celik (2005) reported similar results for changes in SOC along adjacent Mediterranean forest, grassland, and cropland ecosys-tems in Turkey. Sparling et al. (1992), Haynes (1999), and Shepherd et al. (2001) explained in detail that cultivation detached soil aggregates and exposed previously inaccessible organic matter to microbial attack and accelerated the decomposition and miner-alization of SOC. Furthermore, as a matter of fact, variation of the SOC content could be affected with soil detachment, transport, and depositional processes, which could significantly result from the land use changes. There were no significant differences in SOC between the cropland and recreational land for both depths.
On the other hand, SOC contents of the woodland, grassland, and plantation significantly decreased with the soil depth (p<0.05), and decreases were by 50, 25, and 43%, respectively, (Bernoux et al.1998; Cerri
et al.1999; Trumbore et al.1995). For SOC contents of all land uses at the depth of 10–20 cm were
somewhat similar and SOC mostly accumulated in the surface soil, this suggested that SOC of near-surface layers in the cropland and recreational land underwent major changes during the conversion and showed that the Indagi Mountain Pass had very fragile ecosystem in terms of SOC.
Of the adjacent lands uses examined, the recrea-tional land had the highest bulk density (1.48 and 1.47 g cm−3, respectively, for soil depths of 0
–10 and
10–20 cm) while the lowest bulk density was
determined in the woodland (1.12 and 1.18 g cm−3,
respectively, for soil depths of 0–10 and 10–20 cm).
At the depth of 0–10 cm, the cropland had a greater
bulk density than the woodland and less bulk density than grassland. Particularly, the loss of SOC in the cropland resulted in the greater bulk density in this land. In spite of having higher SOC than the cropland, the fact that the grassland had unexpectedly greater bulk density could be attributed to overgrazing of this land at this depth (Celik 2005; Evrendilek et al.
2004). Consequently, if compared to the bulk density of the woodland, increases in the bulk densities of the
Table 1 Summary statistics of soil properties for the different land uses at two different sampling depths (p<0.05 for SOC and BD,
p<0.01 for clay, silt, sand and pH)
Depth Woodland Grassland Plantation Recreation Cropland
SOC D1 2.8(Aaab)±0.1 2.4(Aa)±0.1 2.8(Aa)±0.1 1.7(Ba)±0.1 1.5(Ba)±0.05
D2 1.4(ABb)±0.5 1.8(Ab)±0.05 1.6(ABb)±0.05 1.5(Aba)±0.2 1.3(Ba)±0.05
Mean 2.1±0.5 2.1±0.05 2.2±0.05 1.6±0.1 1.4±0.04
D1 1.12(Db)±0.01 1.35(Bb)±0.01 1.27(Cb)±0.01 1.48(Aa)±0.03 1.30(Cb)±0.01 BD D2 1.18(Ca)±0.01 1.40(Ba)±0.01 1.39(Ba)±0.01 1.47(Aa)±0.04 1.41(Ba)±0.009
Mean 1.15±0.01 1.38±0.008 1.33±0.01 1.48±0.02 1.36±0.008
D1 24.7±0.6 38.1±1.1 30.6±1 31.6±2.3 44±1.2
Clay D2 25.6±0.8 38.5±1.2 34.6±1 34.2±1.8 43.8±1.4
Mean 25.1(D)±0.5 38.3(B)±0.8 32.6(C)±0.7 32.9(C)±1.4 43.9(A)±0.9
D1 24.4±0.6 22.6±0.7 21.6±0.4 24.8±1.2 24.4±0.5
Silt D2 24.9±0.8 21.8±0.6 19.6±0.3 22.3±1 24.5±0.7
Mean 24.6(A)±0.5 22.2(BC)±0.4 20.6(C)±0.3 23.1(AB)±0.8 24.4(A)±0.4
D1 50.8±0.9 39.2±1.2 47.7±1.1 44.3±2.7 31.4±1.2
Sand D2 49.4±1.3 39.5±1.2 45.7±1 43.4±2.3 31.5±1.3
Mean 50.1(A)±0.8 39.3(C)±0.8 46.7(B)±0.7 43.8(B)±1.7 31.5(D)±0.9
D1 6.4±0.06 6.9±0.07 6.6±0.05 6.7±0.11 7.2±0.05
pH D2 6.2±0.05 6.9±0.07 6.6±0.04 6.7±0.1 7.24±0.05
Mean 6.3(D)±0.04 6.9(B)±0.05 6.6(C)±0.03 6.7(BC)±0.07 7.2(A)±0.03
SOC; Soil organic carbon (%),BD; Bulk density (g/cm3),
D1; Depth of 0–10 cm,D2; Depth of 10–20 cm
aDifferences between land uses
bDifferences between depths
cropland and recreational land were 14 and 24%, respectively, at the depth of 0–10 cm.
Except that of the recreational land, the bulk densities of the woodland, grassland, plantation, and cropland significantly varied with the soil depth (Table 1), and increases in the bulk densities with the depth were by 5, 4, 9, and 8%, respectively. These increases in the bulk densities could be easily explained by the decreases in SOC at the depth of 10–20 cm. Additionally, compaction of the cropland
soils by the continuous use of machinery could further contribute to the higher bulk density of sub-soil. Loss of organic matter and a decline of soil ag-gregation by the cultivation were reported as causes of the increased bulk density (Lal1987).
Statistics of clay, silt, and sand showed that these did not change with depth but changed with the land use types (p<0.01). The highest clay content was found in the cropland (43.9% as an average of both depths) while the lowest clay content was determined in the woodland (25.1% as an average of both depths) (Table1). The difference between clay contents of the plantation and recreational land was statistically insignificant. However, these land uses had statisti-cally different silt contents (20.6 and 23.1%, respec-tively). In inverse proportion to the clay contents, the highest sand content was found in the woodland (50.1% as an average of both depths) while the lowest sand content was determined in the cropland (31.5% as an average of both depths). Similar to the contents
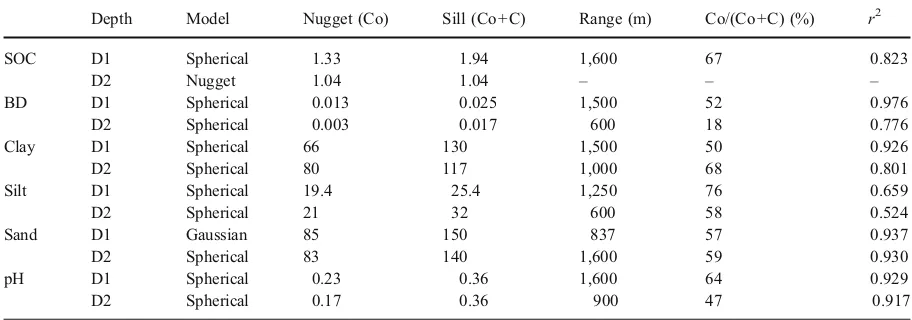
Table 3 Semivariograms models and parameters for the different land uses at two different sampling depths
Depth Model Nugget (Co) Sill (Co+C) Range (m) Co/(Co+C) (%) r2
SOC D1 Spherical 1.33 1.94 1,600 67 0.823
D2 Nugget 1.04 1.04 – – –
BD D1 Spherical 0.013 0.025 1,500 52 0.976
D2 Spherical 0.003 0.017 600 18 0.776
Clay D1 Spherical 66 130 1,500 50 0.926
D2 Spherical 80 117 1,000 68 0.801
Silt D1 Spherical 19.4 25.4 1,250 76 0.659
D2 Spherical 21 32 600 58 0.524
Sand D1 Gaussian 85 150 837 57 0.937
D2 Spherical 83 140 1,600 59 0.930
pH D1 Spherical 0.23 0.36 1,600 64 0.929
D2 Spherical 0.17 0.36 900 47 0.917
SOC; Soil organic carbon (%), BD; Bulk density (g /cm3),
Co; Nugget, C; Partial sill, Co+C; Sill, D1; Depth of 0–10 cm, D2; Depth of 10–20 cm
Table 2 Descriptive statistics of soil properties for the different land uses at two different sampling depths
Depth Mean S.D. C.V Skewness Kurtosis Min. Max. Mod Median
SOC D1 2.4 1.1 44 0.51 0.15 0.06 5.7 2.5 2.3
D2 1.6 0.77 49 0.93 0.79 0.18 6.9 1.9 1.5
BD D1 1.3 0.14 11 −0.25 0.01 0.86 1.7 1.1 1.3
D2 1.4 0.12 8.8 −0.49 0.68 0.92 1.9 1.2 1.4
Clay D1 35 11.4 33 0.39 −0.53 12 66 22 33.6
D2 36 11.4 31 0.51 0.08 12 74 36.6 35.6
Silt D1 23 4.9 21 0.82 4.39 3.1 51 30.3 22.8
D2 23 5.6 25 1.42 6.53 2.7 54 29.3 21.8
Sand D1 42 12 29 0.11 −0.30 9.5 76 46.9 43.4
D2 41 11.8 29 −0.14 −0.31 7.5 72 58.8 42
pH D1 6.8 0.58 8.5 −0.27 0.67 4.6 8.1 7.3 6.8
D2 6.8 0.6 8.8 0.13 −0.17 5.3 8.3 7.6 6.8
SOC; Soil organic carbon (%),BD; Bulk density (g /cm3),
D1; Depth of 0–10 cm,D2; Depth of 10–20 cm
of silt, in terms of sand contents the plantation and recreational land had statistically similar values (46.7 and 43.8%, respectively). Of course, mineral compo-sition and textural class of soil significantly affects soil properties and plant growth (Kosmas et al.1993) and considerably determine the use of land. Since the Indagi Mountain Pass is located in the hilly areas with very undulating topography, soils are mostly cultivat-ed in a way that mechanization agrees with slopes, and steep slopes are kept intact. In other words, the land use and topography are rather compounded in the area. For example, the cropland has much smoother slopes than the woodland, plantation, and recreational land. In fact, parent material and
topog-raphy as the soil-forming factors together with different soil detachment, transport, and depositional processes, which could be greatly influenced by the changes in the land use, could be considered as factors characterizing the textural composition of the soils in the study site.
There were statistically significant differences in mean pH values among the land uses (p<0.01) (Table 1). The cropland had the highest pH (7.2 as an average of both depths) and the woodland had the lowest pH (6.3 as an average of both depths). The grassland, recreational land, and plantation had the pH values of 6.9, 6.7, and 6.6, respectively. Excluding the woodland, the average pH of the land uses could
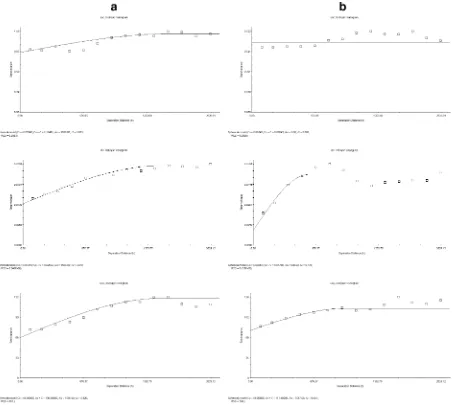
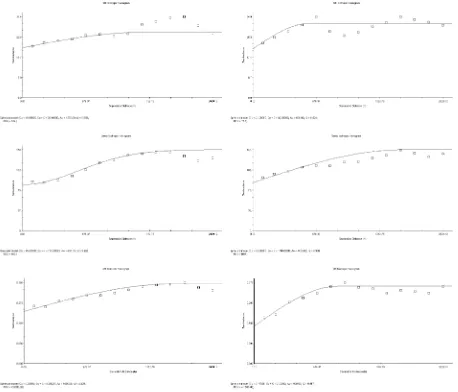
Fig. 2 The experimental and theoretical variograms of the soil propertiesa0–10 cmb10–20 cm
be placed in the neutral side of the pH scale (between 6.6 and 7.3). The pH of the woodland that was never plowed was relatively lower than those of the others and placed in the slightly acidic side of the pH scale (<6.5), almost having 10 times greater concentration of H+ions than that of the cropland. Most probably, the woodland tended to become acidic as a result of rainwater washing of sandy soils which had low buff-ering capacities from the base cations more quickly (calcium, magnesium, potassium, and sodium) and sufficiently decomposing and decaying organic mat-ter. Reasonably higher pH of the cropland was primarily due to the presence of base cations asso-ciated with CaCO3 observed in the soils.
Addition-ally, soils of the cropland had higher amounts of clay
characteristically binding more cations and having higher buffering capacities when compared to the soils of other land uses. The underlying geology, especially presence of the calcium carbonate-cemented rocks in the site is also expected to explain this greater pH value of the cropland.
Coefficient of variation
The descriptive statistics for the values of the mea-sured soil properties are given in Table 2. These statistics are mean, mod, and medians with minimum and maximum values and coefficient of variation (CV), skewness, and kurtosis for the examined soil properties in terms of soil depths. Of the soil
properties, soil pH and BD had the lower coefficient of variation, while SOC had the highest value for both depths. This variation in SOC could result from dif-ferent land use types and difdif-ferent management practices in the area. Significant losses of SOC were determined by the conversion of the woodland and grassland into the cropland (Hajabbasi et al.1997; Wu and Tiessen 2002; Evrendilek et al. 2004). On the
other hand, pH showed little variation, which could be result of the underlying geology. Lower variation of soil pH compared to other soil chemical properties were also reported by Yost et al. (1982), Zhou et al. (1996), Tsegaye and Hill (1998), and Ardahanlioglu et al. (2003). Bo et al. (2003) linked this to the fact that pH values were mostly measured on log scale of proton concentration in soil solution. Clay showed
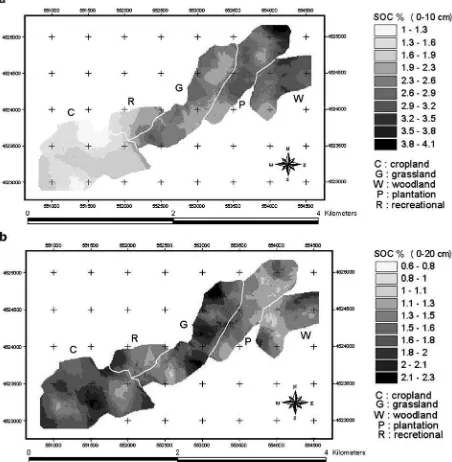
Fig. 3 Spatial distribution of the SOC,a0–10 cmb10–20 cm
larger CV than silt and sand and this larger CV could be attributed to the heterogeneity of slope, land cover, and transport processes of soil erosion. There were some differences in CV values between soil depths for all soil properties examined, however, these seemed insignificant.
Geostatistical analysis
The empirical semivariograms were estimated by raw data and were directionally calculated at the angles of
0° (N–S), 45° (NE–SW), 90° (E–W), and 135° (SE–NW)
for each soil property. This directional examination of the variogram surfaces indicated no severe anisotropy for variation of soil properties measured, and there-fore, only omni-directional variograms were obtained by using the best fitting model by the least squares regression method and modeled with isotropic func-tions (Fig. 2a,b). This was significant to make the spatial structure analysis by kriging and to find a view of changes in the soil properties affected by changes in the land use types. Also, for better fitting, using the
skewness and kurtosis coefficients in order to de-scribe the shape of data distribution, the model data frequency distribution was compared to a normal distribution. The results indicated that there were no significant right or left tails in the distributions and
only distributions of the silt contents for both depths were significantly positively kurtotic (Table 2). This suggested that a few extremely large values of the silt were observed in the distributions. The square-root transformation seemed useful to normalize the data,
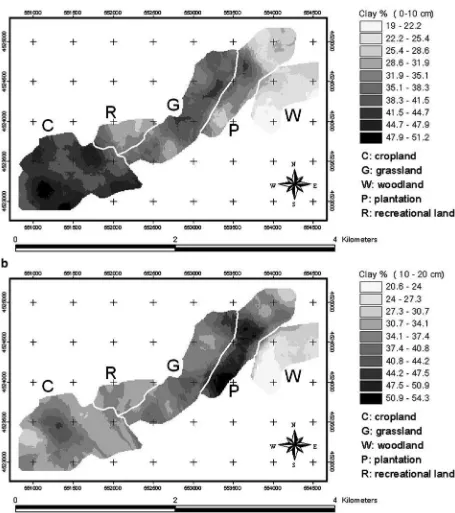
Fig. 5 Spatial distribution of the soil clay content, a0–10 cmb10–20 cm
but it did not help considerably and the semivario-grams were fitted using the raw data.
The Gaussian model was selected for the best estimation for the isotropic semivariograms for topsoil sand content, while the spherical model provided the best fit for silt, clay, BD, pH at the both depths, and
subsoil sand content and SOC for topsoil. SOC was showed pure nugget effect for subsoil. The spatial statistics obtained from the semivariograms and the models used are summarized in Table 3.
The geostatistics indicated that the soil properties examined were spatially dependent to the different
degrees, which could be ascribed to the land use changes occurred in the area or to differences in soil formation. The range of spatial dependence differed from 837 m for sand content to 1,600 m for pH and SOC at the depth of 0–10 cm. The samples showed
spatial dependence with the range of ≥1,250 m for pH, BD, clay, silt, and sand at this depth. The smaller nugget variance of pH and BD compared to SOC, clay, silt, and sand suggested that the sampling scheme used was sufficient for these two soil properties.
Fig. 7 Spatial distribution of the soil sand content, a0–10 cmb10–20 cm
However, larger nugget variances in SOC and textural composition showed the control of short range effects for these properties.
At the depth of 10–20 cm, the range of spatial
dependence varied from 600 m for BD and silt content to 1,600 m for the sand content. However, except in the sand content, there were significant decreases in the ranges of the soil properties at the depth of 10–
20 cm when compared to those of 0–10 cm. And,
especially BD and silt content at this depth were
spatially much less correlated than that they were correlated at the depth of 0–10 cm. The decrease of the
range of the semivariograms for BD at the subsoil compared with the topsoil could reflect the influence of changes in the land use and soil management practices. Cultivation in the cropland by the use of machinery and overgrazing in the pasture were expected to be the reasons for the remarkable decrease in the spatial correlation of BD at the depth of 10–20 cm.
Topo-graphical differences and erosional transport processes
could play a significant role in the soil distribution. In the study area, soil loss and/or deposition resulted in the decrease of range for the silt contents as it was most susceptible soil particle size to the water erosion. On the other hand, the finding that subsoil showed less range when compared to the topsoil for the silt content was not straightforwardly understand-able and can be explained by the differences in the underlying material type (Fig.2a,b).
Similar results in the nugget variance observed at the depth of 0–10 cm were obtained at the depth of
10–20 cm. pH and BD had the much smaller nugget
variance than those SOC, pH, clay, silt, and sand, indicating, of these two grouping, an appropriate sampling for former and the short range variability for latter soil properties (Fig.2a,b).
Cambardella et al. (1994) and later Bo et al. (2003) suggested that the nugget-to-sill ratio could be used to classify the spatial dependence of soil properties. Authors considered a variable had a strong, moderate, and weak spatial dependence if the ratio was <25%, between 25 and 75%, and >75%, respectively. Ac-cordingly, the nugget-to-sill ratio showed a strong spatial dependence for BD at the depth of 10–20 cm
and a weak spatial dependence for silt content at the depth of 0–10 cm. The others soil properties showed
moderate spatial dependence.
Kriging of spatial variation of soil properties
Evaluation of a spatial structure of soil properties could help to solve particular problems associated with the land use planning activities such as agriculture, erosion control, environmental protection and ecosystem con-servation. Kriging based on variogram models and raw data values for each variable at 5,920 locations (148× 40) over a regular grid were used to directly find the spatial changes of soil properties by interpolation for locations where soil samples were not taken.
Figure 3a and b show kriging interpolations for SOC at the depth of 0–10 and 10–20 cm, respectively.
Although the subsoil spatial distribution of SOC did not remarkably change with land use type, the topsoil spatial distribution highly reflected the changes in the land use types. The kriging interpolation predicted significant decreases of SOC in the recreational land and cropland (Fig.3a). Clearly, SOC decreased in the western part of the study area where land uses were the recreational land and cropland, while it increased in
the center and eastern part where the grassland, planta-tion, and woodland, respectively, were the main land use types. Changing the original forest and grassland ecosystem into the recreational land and cropland re-sulted in significant declines of SOC at the depth of 0–10 cm, and particularly, plowing forest soils
encouraged rapid mineralization of the SOC previously accumulated in the topsoil. This result suggests certain management practices, e.g., minimum tillage, cover crops, and rotations, to be used to recover SOC of the topsoil in the study area (Dick et al.1998).
Furthermore, landscape attributes including slope, aspect, elevation, and land use might be the dominant factors of SOC in an area with the same parent material and single climate regime (Rezaei and Gilkes
2005). Especially, topography influences local and regional microclimates by changing pattern of preci-pitation, temperature, solar radiation, and relative hu-midity (Dahlgren et al.1997; Smith and Smith2000; Tsui et al.2004).
The spatial distribution of the soil BD is shown in Fig. 4a and b, respectively, for the depth of 0–10 and
10–20 cm. In two cases of soil depths, BD varied
depending on the land use types. Also, the topsoil spatial distribution of BD differed significantly from that of the subsoil. Especially for the woodland, BD of the topsoil was inversely related to SOC, and BD greatly decreased in the southeastern part where the SOC was relatively higher. This relation did not hold for the grassland and plantation because of the overgrazing and mechanization, respectively, al-though they contained noticeable SOC in the topsoil. The effect of over-walking by human and animal on the topsoil BD of the recreational land and grassland, respectively, could be observed in the center of Fig. 4a, BD increasing more northerly. On the other hand, except over the woodland, the distribution of the subsoil BD was homogenous over the land uses (Fig.4b). It was easily observable from Fig.4a and b that increases in the subsoil BD were further spreading westerly when two maps were compared, indicating the effect of the compaction due to the continuous use of the machinery in the cropland.
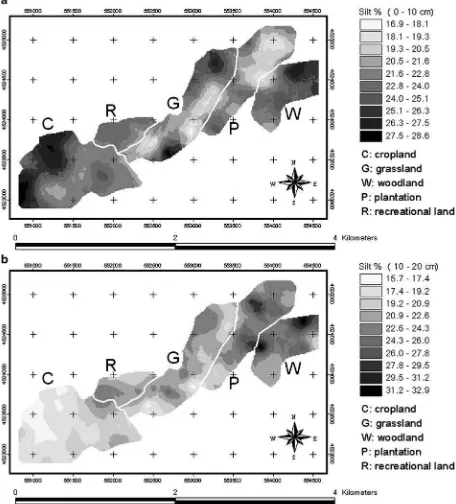
Figure 5a,b, 6a,b, and 7a,b show kriging interpo-lations for the clay, silt, and sand contents at the depth of 0–10 and 10–20 cm, respectively. The topsoil
spatial distributions were, to a certain extent, similar to those of the subsoil. The cropland and grassland, which were in the center and west of the study area,
respectively, were located on the very fine textured soils while the woodland and plantation, which were in the southeast and northeast of the study area, were on the coarse textured soils. This pattern, proportion-ally inverse relationship between the clay and sand contents, is very obvious in Fig. 5a,b and 7a,b. However, it was difficult to distinguish any clear pattern for the silt contents in terms of land uses. The silt content was higher towards the northwest and southeast and decreased towards the middle of the area. As well as to the parent material, this could also be ascribed to the different soil detachment, transport, and depositional processes that are historically or cur-rently in play in the study area for the silts are easily movable particles by the water erosion. Consequently, since such important soil properties as water retention and cation exchange capacity are affected by the textural composition of the soils, given the texture and land use types different practices would be es-sential to manage these lands.
The spatial distribution of the soil pH is shown in Fig.8a and b, respectively, for the depth of 0–10 and
10–20 cm. pH distributions of both soil depths were
not different but changed with the land use types. Exceptionally, the spatial distribution of the soil pH agreed with that of the clay content. The cropland and grassland with soils relatively richer in clay had the higher pH while the woodland and plantation with soils relatively richer in sand had lower pH. The higher amounts of clay bound the more cations and higher amounts of sand caused the base cations to be easily washed away. The presence of the organic acids in the woodland and plantation could additionally lead to the decreases in pH. Again, in terms of soil pH, different management practices should be in place based on the kriging interpolations.
Conclusions
Soils of five land use types, woodland, grassland, plantation, recreational land, and cropland, in Indagi Mountain Pass – Cankiri, Turkey were examined to
predict spatial variability of SOC, BD, soil texture and pH. The first two have been the original land uses and the others were converted from either woodland or grassland. In this respect, we looked into the effects of changes in the land use types on the soils. Analysis of variance indicated that SOC of the woodland and
grassland experienced major changes after the conver-sion. There were increases in BD of the cropland and recreational land at the depth of 0–10 cm when
compared to that of the woodland. This was due primarily to the loss SOC, over-walking and vehicle access. BD of the grassland, however, changed with overgrazing rather than SOC. Clay, silt, and sand contents did not vary with depth but with the land use types (p<0.01). Parent material and topography as the soil-forming factors together with different soil detachment, transport, and depositional processes were concluded as factors characterizing the textural compo-sition of the soils in the study site. pH values at both soil depths were also similar but exhibited dynamic behavior with land use in this mountain ecosystem.
We further gained the spatial structure of SOC, BD, texture, and pH by the geostatistics and kriging interpolations. The topsoil spatial distribution of SOC highly reflected the changes in the land use types, and kriging anticipated significant decreases of SOC in the recreational land and cropland. Accordingly, BD varied depending on the land use types, and also, the topsoil spatial distribution of BD differed significantly from that of the subsoil. Generally, BD greatly decreased in places where the SOC was relatively higher except in the grassland where overgrazing was the more important factor than SOC to determine BD. The topsoil spatial distributions of clay, silt, and sand contents were rather similar to those of the subsoil. The cropland and grassland were located on the very fine textured soils whereas the woodland and planta-tion were on the coarse textured soils. Although we observed a clear pattern for the spatial distributions of the clay and sand changing with land uses, this was not the case for the silt content, which was attributed to the differences of dynamic erosional processes in the area. The spatial distribution of the soil pH agreed with that of the clay content. Soils of the cropland and grassland with higher amounts of clay characteristi-cally binding more cations and having higher buffer-ing capacities had the greater pH values when compared to the soils of other land uses with higher amounts of sand naturally inclined to be washed from the base cations by the rainwater.
This research has spatially provided the effects of the land use changes on the soil properties that affect the ecosystem dynamics in Indagi Mountain Pass–Cankiri,
References
Agrawal, O. P., Rao, K. V. G. K., Chauhan, H. S., & Khandelwal, M. K. (1995). Geostatical analysis of soil salinity improvement with subsurface drainage system. Transactions of ASAE, 38, 1427–1433.
Akman, Y. (1995). Türkiye Orman Vejetasyonu. Ank. Üniv. Fen Fakültesi Botanik Ana Bilim Dalı, 143–154, Ankara (in Turkish).
Anonymous (2000). Tarım İstatistikleri. D.İ.E., Ankara. (in Turkish).
Ardahanlioglu, O., Oztas, T., Evren, S., Yılmaz, H., & Yıldırım, Z. N. (2003). Spatial variability of exchangeable sodium, electrical conductivity, soil pH and boron content in salt- and sodium-affected areas of the Igdır plain. Journal of Arid Environments, 54, 495–503.
Atalay, I. (1997).Geography of Turkey (pp. 416). Izmir: Ege University Press (in Turkish).
Aytuğ, B. (1970). Arkeolojik araştırmaların ışığı altında İç Anadolu Stepi,İ. Ü. Orman Fak. Dergisi, Seri A, 20(1), 127–143 (in Turkish).
Bauer, A., & Black, A. C. (1994). Quantification of the effect of soil organic matter content on soil productivity. Soil Science Society of America Journal, 58, 185–193. Bernoux, M., Arrouays, D., Cerri, C. C., de Graca, P. M. A.,
Volkoff, B., & Trichet, J. (1998). Estimation des stocks de carbone des sols du Rondonia (Amazonie bresilienne). Etude et Gestion des Sols, 5, 31–42.
Blake, G. R., & Hartge, K. H. (1986). Bulk density. In: A. Klute (Ed.), Methods of soil analysis. Part 1, 2nd edn. (pp. 363–375). Agron. Monogr. 9. Madison, WI: ASA and SSSA.
Bo, S., Shenglu, Z., & Qiguo, Z. (2003). Evaluation of spatial and temporal changes of soil quality based on geo-statistical analysis in the hill region of subtropical China. Geoderma, 115, 85–99.
Cambardella, C. A., Moorman, T. B., Nowak, J. M., Parkin, T. B., Karlen, D. L., Turco, R. F. et al. (1994). Field scale variability of soil properties in Central Iowa soils. Soil Science Society of America Journal, 58, 1501–1511. Celik, I. (2005). Land-use effects on organic matter and
physical properties of soil in a southern Mediterranean highland of Turkey.Soil & Research, 83, 270–277. Cerri, C. C., Bernoux, M., Arrouays, D., Feigl, B. J., & Piccolo,
M. C. (1999). Carbon stocks in soils of the Brazilian Amazon. In: R. Lal, J. Kimble, R. Follet, & B. A. Stewart (Eds.), Global climate change and tropical ecosystems. advances in soil science(pp. 33–50). Boca Raton: CRC. Chien, Y. J., Lee, D. Y., Guo, H. Y., & Houng, K. H. (1997).
Geostatistical analysis of soil properties of mid-west Taiwan soils.Soil Science, 162, 291–298.
Cuenca, R. H., & Amegee, K. Y. (1987). Analysis of evapotranpiration as a regionalized variable. In: D. Hillel (Ed.),Advances in Irrigation, vol. 4 (pp. 182–220). New York: Academic.
Dahlgren, A. R., Bottinger, L. T., Huntington, L. G., & Amundson, A. R. (1997). Soil development along an ele-vation transect in the western Sierra Nevada, California. Geoderma, 78, 207–236.
Dhillion, N. S., Samara, J. S., Sadana, U. S., & Nielsen, D. R. (1994). Spatial variability of soil test values in a Typic Ustochrept.Soil Technology, 7, 163–171.
Dick, W. A., Blevins, R. L., Frye, W. W., Peters, S. E., Christenson, D. R., Pierce, F. J. et al. (1998). Impacts of agricultural management practices on C sequestration in forest-derived soils of the eastern Corn Belt. Soil and Tillage Research, 47, 235–244.
Elliott, E. T. (1986). Aggregate structure and carbon, nitrogen, and phosphorus in native and cultivated soils.Soil Science Society of America Journal, 50, 627–633.
Evrendilek, F., Celik, I., & Kilic, S. (2004). Changes in soil organic carbon and other physical soil properties along adjacent Mediterranean forest, grassland, and cropland ecosystems in Turkey.Journal of Arid Environments, 59, 743–752. Gee, G. W., & Bauder, J. W. (1986). Particle-size analysis. In:
A. Klute (Ed.),Methods of Soil Analysis. Part 1. 2nd Ed. Agron. Monogr. 9 (pp. 383–411). Madison, WI: ASA and SSSA.
Grupta, V. S. R., & Germida, J. J. (1988). Distribution of microbial biomass and its activity in different soil aggregate size classes as affected by cultivation. Soil Biology & Biochemistry, 20, 777–786.
Hajabbasi, M. A., Lalalian, A., & Karimzadeh, R. (1997). Deforestation effects on soil physical and chemical properties, Lordegan, Iran. Plant and Soil, 190, 301–308.
Haynes, R. J. (1999). Size and activity of the soil microbial biomass under grass and arable management.Biology and Fertility of Soils, 30, 210–216.
Journal, A. G., & Huijbregts, C. S. (1978).Mining geostatistics (p. 600). New York: Academic.
Kosmas, C., Danalatos, N., Moustakas, N., Tsatiris, B., Kallianou, Ch., & Yassoglou, N. (1993). The impacts of parent material and landcape position on drought and biomass production of wheat under semi-arid conditions. Soil Technology, 6, 337–349.
Lal, R. (1987). Tropical ecology and physical edaphology. Chichester, UK: Wiley.
Lark, R. M. (2002). Optimized spatial sampling of soil for estimation of the variogram by maximum likeliwood. Geoderma, 105, 49–80.
Mahtab, F. U., & Karim, Z. (1992). Population and agricultural land use: Towards a sustainable food production system in Bangladesh.Ambio, 21, 50–55.
Mapa, R. B., & Kumaragamage, D. (1996). Variability of soil properties in a tropical alfisol used for shifting cultivation. Soil Technology, 9, 187–197.
Miller, M. P., Singer, P. M. J., Nielsen, D. r. (1988). Spatial variability of wheat yield and soil properties on complex hills. Soil Science Society of America Journal, 52, 1133–1141.
Nelson, D. W., & Sommers, L. E. (1982). Total Carbon, organic carbon, and organic matter. In A. L. Page (Ed.),Methods of soil analysis. Part 2. 2nd Ed. Agron. Monogr. 9 (pp. 539–579). Madison, WI: ASA and SSSA.
Page, A. L., Miller, R. H., & Keeney, D. R. (1982).Methods of soil analysis. Part 2. Chemical and microbiological properties, 2nd Ed. Agron. Monogr. 9. Madison, WI: ASA and SSSA.
Pannatier, Y. (1996). VARIOWIN: Software for spatial data analaysis in 2D (p. 91). Berlin Heidelberg New York: Springer.
Rezaei, S. A., & Gilkes, R. J. (2005). The effects of landscape attributes and plant community on soil chemical properties in rangelands.Geoderma, 125, 167–176.
Robert, P. C., Rust, R. H., & Larson, W. E. (1993). Soil specific crop management. Special Publ. Amer. Soc. Agronomy, 406. Russo, D. (1984). Spatial variability considerations in salinity management. In: I. Shainberg, & J. Shalhvet (Ed.),Soil salinity under irrigation(pp. 198–216). Berlin Heidelberg New York: Springer.
Samra, J. S., Singh, V. P., & Sharma, K. N. S. (1988). Analysis of spatial variability in sodic soils. 2. Point and block– kriging.Journal of the Soil Science, 145, 250–256. Shepherd, T. G., Newman, R. H., Ross, C. W., & Dando, J. L.
(2001). Tillage induced changes in soil structure and soil organic matter fraction. Australian Journal of Soil Research, 39, 465–489.
Shukla, M. K., Lal, R., & Ebinger, M. (2004). Soil quality indicators for reclaimed minesoils in southeastern Ohio. Soil Science, 169(2), 133–142.
Smith, R. L., & Smith, T. M. (2000). Elements of ecology, 4th ed. San Francisco: Addison Wesley Longman. Soil Survey Staff (1999).Soil taxonomy. A basic system of soil
classification for making and interpreting soil surveys. USDA, Handbook No: 436, Washington DC.
Soil Survey Staff (1993). Soil survey manual, USDA. Hand-book No: 18, Washington D.C.
Sparling, G. P., Shepherd, T. G., & Kettles, H. A. (1992). Changes in soil C, microbial C and aggregate stability under continuous maize and cereal cropping, and after restoration to pasture in soils from Manawatu region, New Zealand.Soil & Tillage Research, 24, 141–225.
Tisdall, J. M., & Oades, J. M. (1982). Organic matter and water stable aggregates in soils. Journal of Soil Science, 33, 141–163.
Trangmar, B. B., Yost, R. S., Wade, M. K., Uehara, G., & Sudjadi, M. (1987). Spatial variation of soil properties and rice yield in recently cleared land.Soil Science Society of America Journal, 51, 668–674.
Trumbore, S. E., Davidson, E. A., de Camargo, P. B., Nepstad, D. C., & Martinelli, L. A. (1995). Below-ground cycling of carbon in forest and pastures of eastern Amazonia. Global Biogeochemical Cycles, 9, 515–528.
Tsegaye, T., & Hill, R. L. (1998). Intensive tillage effects on spatial variability of soil test, plant growth, and nutrient uptake measurement.Soil Science, 163, 155–165. Tsui, C. C., Chen, Z. S., & Hsieh, C. F. (2004). Relationships
between soil properties and slope positioning a low land rain forest of southern Taiwan. Geoderma, 123, 131–142.
Uehara, G., & Gillman, G. (1981).The mineralogy, chemistry, and physics of tropical soils with variable charge clays (170 pp). Colorado: Westview.
Vauclin, M., Vieira, S. R., Vachaud, G., & Nielsen, D. R. (1983). The use of cokriging with limited field soil observations. Soil Science Society of America Journal, 47, 175–184.
Vieira, S. R., Hatfield, J. L., Nielsen, D. R., & Biggar, J. W. (1983). Geostatistical theory and application to variability of some agronomical properties.Hilgardia, 51, 1–75. Voltz, M., & Webster, R. (1990). A comparison of kriging,
cubic splins and classification for predicting soil properties from sample information. Journal of Soil Science, 41, 473–490.
Wali, M. K., Evrendilek, F., West, T., Watts, S., Pant, D., Gibbs, H. et al. (1999). Assessing terrestrial ecosystem sustain-ability: Usefulness of regional carbon and nitrogen models.Nature and Resources, 35, 20–33.
Warrick, A. W., & Gardner, W. R. (1983). Crop yield as affected by spatial variations of soil and irrigation.Water Resource, 19, 181–186.
Wu, R., & Tiessen, H. (2002). Effect of land use on soil degradation in Alpine grassland soil, China.Soil Science Society of American Journal, 66, 1648–1655.
Yost, R. S., Uehara, G., & Fox, R. L. (1982). Geostatical analysis of soil chemical properties of large land areas: I. Semivariograms.Soil Science Society of American Journal, 46, 1028–1032.