OBSERVING SURFACE CIRCULATION OF THE WESTERN MEDITERRANEAN
BASIN WITH SATELLITE IMAGERY
S. Karimova
University of Liege, Department of Astrophysics, Geophysics and Oceanography, GeoHydrodynamics and Environment Research Unit, 4000 Liege, Belgium - [email protected]
KEY WORDS: Mesoscale Eddies, Submesoscale Eddies, Hydrological Fronts, Mediterranean Sea, SST, Chlorophyll-a, SAR
ABSTRACT:
In this article, the benefits of using satellite imagery of different types (namely thermal infrared, visible-range, and synthetic aperture radar (SAR) images) for observing surface circulation of marine basins are being discussed. As a region of interest, we use the Western Mediterranean Basin. At first, the areas with sharpest thermal and chlorophyll-a gradients within the region of interest were defined on a seasonal base using the data provided by Aqua Moderate Resolution Imaging Spectrometer (MODIS). After that, mesoscale eddies were detected using different sea surface temperature (SST) products and, finally, submesoscale vortices were observed with Envisat Advanced SAR imagery. Thus found locations of eddies were compared with locations of the sharpest fronts discovered in the first part of the study, which showed that the biggest, mostly anticyclonic, eddies tended to correspond to locations of main surface currents; smaller cyclonic eddies were mostly attributed to thermal fronts, while submesoscale eddies were distributed quite homogeneous. The observations performed in that way revealed quite prominent basin-, meso- and submesoscale eddy activity in the region of interest. Additionally, significant seasonal variability in the type of surface water stirring was noted. Thus, the maximum of both meso- and submesoscale eddy activity seems to happen during the warm season, while during winter, presumably due to low Richardson numbers typical for the upper water layer, the turbulent features are still undeveloped and of the smaller spatial scale than during the warm period of year.
1. INTRODUCTION 1.1 General Problematics
The Mediterranean Sea is frequently considered a natural laboratory for studying oceanographic processes. Among others, it is granted an oligotrophic status, which makes it of particular interest to investigate the local influence of certain hydrodynamic features on bioproductivity of the ecosystem. The Western Mediterranean Basin, compared to the Eastern Mediterranean sub-basin, is quite productive due to seasonal convective mixing and wind forcing provided by the mistral winds (Barale, 2008). Consequently, during seasonal phytoplankton bloom, visible-range satellite imagery can be also quite informative in terms of manifesting surface circulation features.
Despite significant attention paid to studying surface circulation in the Western Mediterranean and especially to anticyclonic gyres of the Alboran Sea and Algerian Basin, which have been intensively studied by satellite and in situ observations (Millot, 1999), in general a wealth of data provided by satellite imagery still stays unused. Thus, thermal infrared imagery is traditionally used either for some descriptive analysis of surface circulation in the region of interest (Taupier-Latage, 2008) or observed in satellite synthetic aperture radar (SAR) imagery by Redondo et al. (2013). For the entire Westerm Mediterranean, submesoscale eddies manifested in SAR imagery were tackled recently by Karimova and Gade (2016) and Karimova (2017).
2.2 Reanalysis Data
For retrieving more characteristics of the eddies observed, some additional data were analysed. Thus, the data on mixed layer depth (MLD) were provided by the Copernicus Marine Environment Monitoring Service (CMEMS) reanalysis.
3. RESULTS 3.1 Seasonality of Surface Stirring
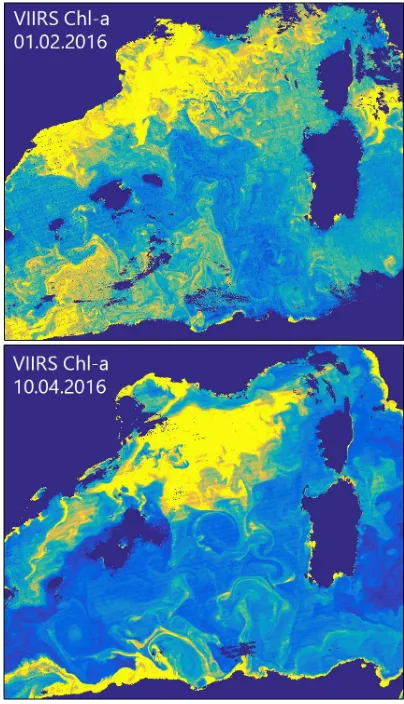
The very first observation we would like to mention here is that there was quite a significant seasonal variability of surface water stirring observed in the region of interest. Especially well such seasonal differences can be illustrated by the fields of Chl-a cChl-aptured, for exChl-ample, by the Visible InfrChl-ared ImChl-aging Radiometer Suite (VIIRS) functioning onboard the Suomi National Polar-Orbiting Partnership (Suomi NPP) spacecraft.
Tendencies similar to those observed in the fields of Chl-a were noted in the fields of SST as well, but a less prominent scale, because the SST fields are not so flexible in terms of visualisation of surface water stirring. Nevertheless, while calculating a structure function of both fields, fields of SST demonstrated greater seasonal differences than fields of Chl-a.
During the cold period of year (approx. December to March), there are mostly underdeveloped disorganized small-scaled turbulent features seen in the imagery. A typical for the Western Mediterranean winter-time snapshot of surface currents is shown in Figure 1, upper panel, where a Chl-a field obtained on 01.02.2016 by VIIRS is presented. In this and similar figures, violet and blue shading correspond to low values of Chl-a, while yellow one, to high values of Chl-a. Such an impressive and detailed representation of surface turbulence in this image is explained by the occurrence of a seasonal phytoplankton bloom, due to which a great number of organic cells is presenting in surface waters.
Later on (in late March or early April) the turbulence regime seems to change and some bigger-scale anticyclonic eddies start appearing in the field of surface currents. The turbulence regime of the warm period of year can be characterized by the dominance of well-developed big-scale coherent vortical structures almost all over the region of interest. Such situation is illustrated by Figure 1, lower panel, where a Chl-a field obtained by VIIRS on 10.04.2016 is presented. According to this field of Chl-a, anticyclonic eddies could be found almost everywhere in the region except for the northernmost part, where quite small-scale turbulence still can be observed in the area occupied by the bloom.
As a reason for the observed variability of surface stirring we propose the differences of stratification of upper water during the cold and warm seasons defined in this study. According to the CMEMS reanalysis data, the period from late March to early April, when the transition from the winter to summer turbulence regimes was observed, is exactly the time when summer restratification of the upper water layer begins. The corresponding graphics is provided in Figure 2, where yearly timeseries of MLD at about 5000 fixed locations in the Western Mediterranean corresponding to the year of 2013 are plotted. In this plot, markers of the same colour correspond to the same location.
Figure 1. Snapshots of surface circulation in the Western Mediterranean during the cold (upper panel) and warm (lower
panel) periods of year captured by the fields of Chl-a
Figure 2. Seasonal variability of MLD at different locations in the Western Mediterranean in 2013
3.2 Frontal Density of Chl-a and SST
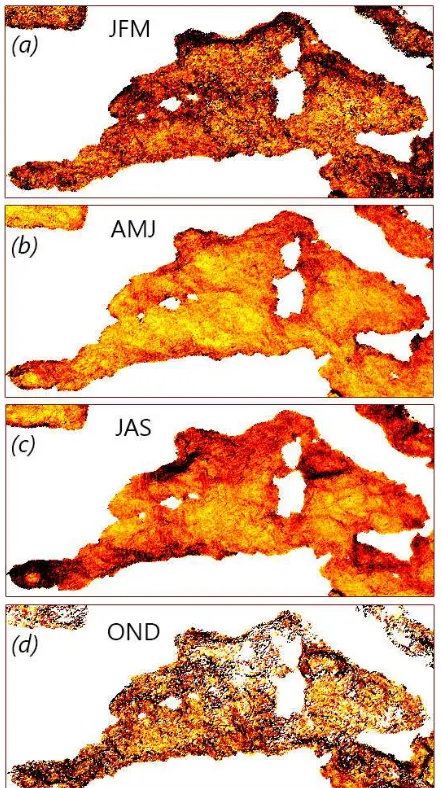
seasonally averaged numerical gradient of Chl-a and SST were constructed for the years 2003-2014 using the Aqua MODIS data. In Figure 3, there are the fields of the SST gradient presented. In these schemes, dark red and black shading denotes high gradients, while yellow one, low gradients.
Figure 3. Seasonally averaged gradient of SST in 2009
As we can note, such generalized schemes of the SST gradient managed to capture the locations of the main circulation features in the region of interest. Thus, during the winter time (Figure 3(a)), there is a clear manifestation of the Northern Current in the Liguro-Provençal Basin and in the Gulf of Lion. During the spring time, the Northern Current manifestation is still visible in the vicinity of the Gulf of Lion (Figure 3(b)). In summer, one can note quite a broad meandering of the Northern Current in the Liguro-Provençal Basin; in the Balearic Sea, the current is getting narrow again (Figure 3(c)). Another area of sharp thermal contrasts during this season corresponds to a small gyre in the northern shallow part of the Tyrrhenian Sea. Finally, thermal contrasts also depicted the propagation of Atlantic water in the Alboran Sea and formation of the westernmost Alboran Eddy (Figure 3(c)). The last four months of the year seem particular cloudy over the region of interest (Figure 3(d)). For that reason, there appear gaps in the field of SST gradient and in general the picture is getting noisy.
Nevertheless, some circulation features are still noticeable, e.g. the northern Tyrrhenian gyre mentioned earlier (Figure 3(d)).
Figure 4. Seasonally averaged gradient of Chl-a in 2009
Unlike thermal fronts (Figure 3), during winter and spring the high gradients of Chl-a mostly correspond to edges of the seasonal phytoplankton bloom rather than to surface circulation features (Figures 4(a)-(b)). Noteworthy that in the first half of year, the Northern Current is manifested by the relatively low values of Chl-a gradient. In spring, we note that the propagation of Atlantic water along the periphery of the Alboran Eddy is seen not only in the field of SST, but also in Chl-a (Figure 4(b)). In summer, high Chl-a gradients are observed only in the near-coastal areas (Figure 4(c)). In autumn, there are slightly increased contrasts of Chl-a along the southern coast.
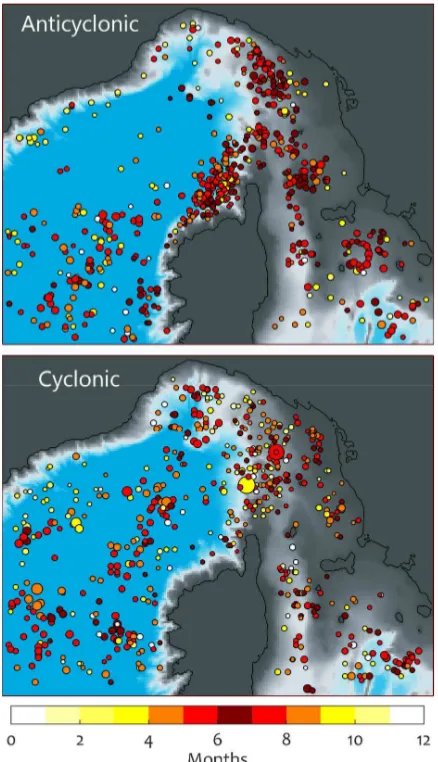
3.3 Mesoscale Eddies
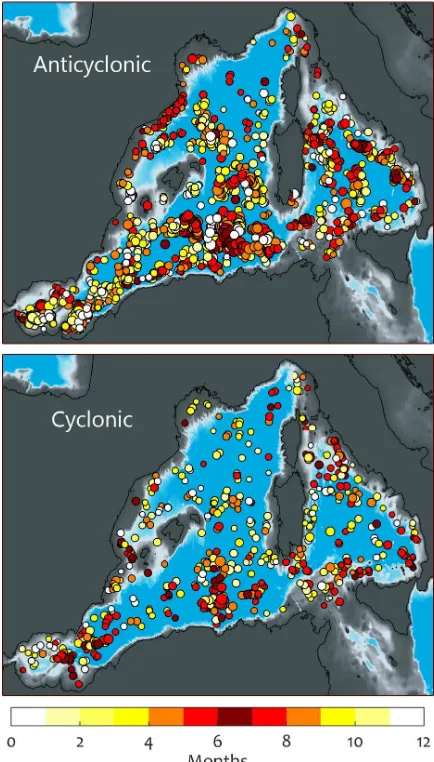
Spatial distribution of the manifestations found is shown in Figure 5. In these plots, the marker’s colour denotes the month at which the manifestation was observed. The main tendency that can be noted in the schemes presented is that most anticyclones tend to located along the southern coast of the region of interest, where Atlantic water propagates. The biggest cyclones are also located there. Both anticyclonic and cyclonic eddies marked quite well the gyre in the Tyrrhenian Sea. Finally, during the warm period quite a lot of medium size anticyclones were found along the northern coast of the Balearic Sea (Figure 5).
Figure 5. Spatial distribution of mesoscale eddy manifestations found in the fields of SST in 2008 and 2014 in the Western
Mediterranean
Since some eddies (big anticyclones in particular) were observed and registered upon the image analysis several times, we tried to track the propagation of centres of such eddies. The resulting scheme is shown in Figure 6. In this figure, the movement of eddies is marked with arrows connecting two sequential in time positions of the eddy. According to Figure 6, we did not manage to track particularly long-distance displacements of eddies. The longest-tracked structures were the two Alboran Eddies, but they were quite stable in their location, especially the westernmost one.
Figure 6. Tracked movements of AC (red arrows) and C (blue arrows) eddies in the Western Mediterranean
As far as the spatial scale of the eddy manifestations detected in the fields of SST is concerned, in Figure 7 there is a histogram of eddy diameters for AC and C eddies. We note that anticyclonic eddies were dominating not only in the number, but also in the size. In general, anticyclones were bigger than cyclones, which is quite typical for mesoscale eddies of inner and marginal seas with presence of some strong dominating current (Karimova, 2017). Average diameter of anticyclones was about 76.3 km, while that of cyclones, of about 54.6 km.
Figure 7. Absolute counts of eddy diameters for AC and C eddies detected in the Western Mediterranean
Figure 8. Monthly averaged eddy diameter and number of manifestations for AC (red markers and line) and C (blue markers and line) eddies found in 2008 and 2014 in the Western
Mediterranean
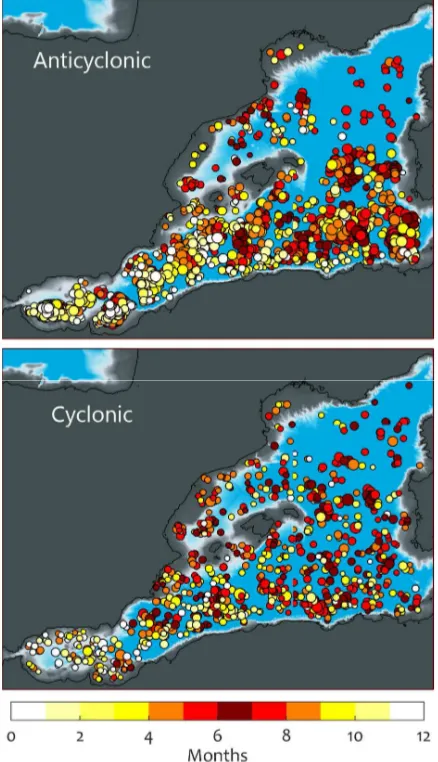
Figure 9. Spatial distribution of mesoscale eddy manifestations found in the fields of SST in 2011-2013 in the westernmost part
of the Western Mediterranean
A similar analysis was performed for the westernmost part of the Western Mediterranean as well, for the area located to the west from the islands Corsica and Sardinia. This time we used again the L3S SST product obtained in 2011-2013. In these SST images, a total of 1489 AC and 782 C eddy manifestations were detected. Centres of eddies found upon this analysis are shown in Figure 9. Similar to the results obtained for the entire Western Mediterranean (Figure 5), AC eddies were especially frequently detected in the vicinity of the southern coast of the basin (Figure 9, upper panel). Cyclonic eddies discovered upon this analysis were distributed more evenly in space (Figure 9, lower panel). The number of both AC and C manifestations found is decreasing from south to north.
The trajectories of eddy centres of those eddies which were observed more than once are presented in Figure 10. In this scheme, it is particular easy to observe the locations where big anticyclones stayed for particularly long time.
Figure 10. Tracked movements of AC (red arrows) and C (blue arrows) eddies in the westernmost Western Mediterranean
The spatial scale of eddies found in this region is similar to ones discovered in the entire Western Mediterranean (Figure 7). The values of the seasonally averaged eddy diameter for AC and C eddies obtained for the westernmost part are also similar to those found for the entire Western Mediterranean and shown in Figure 8. Such plot is presented in Figure 11.
Finally, a closer consideration got eddies of the Liguro-Provençal Basin as well. This time a monosensor L3C SST product was used. The time coverage of this analysis is mostly from 2014 to 2016.
The resulting schemes of spatial distribution of eddies in this area can be seen in Figure 12. We note that most AC eddies were attributed to the northern parts of the Western and Eastern Corsican Currents (Figure 12, upper panel). Locations of cyclones were more related to strong thermal fronts rather than to the main currents of the region of interest. For that reason, location of C eddies are quite correlated with the pathway of the meandering Northern Current within which strong thermal fronts occur (Figure 12, lower panel).
Figure 12. Spatial distribution of mesoscale eddy manifestations found in the fields of SST in 2014-2016 in the
Liguro-Provençal Basin
Due to lower potential and kinetic energy available in the Liguro-Provençal Basin comparing to, e.g., the Alboran Sea and Algerian Basin, the spatial scale of eddies in this area was smaller than in the entire Western Mediterranean (Figure 7). The corresponding histogram of eddy diameters for the Liguro-Provençal Basin is presented in Figure 13. Similar to the previous cases considered (Figures 8 and 11), during the warm period of year the average eddy size was greater than during the cold period.
Figure 13. Absolute counts of eddy diameters for AC and C eddies detected in the SST imagery of the Liguro-Provençal
Basin
3.4 Submesoscale Eddies
In order to be able to observe the smaller spatial scales as well (namely submesoscale eddies), we analysed SAR images of the Western Mediterranean as well. Eddy manifestations with eddy diameter not exceeding approx. 15 km were considered submesoscale.
Unlike visible-range and infrared images, in SAR imagery water circulation features are manifesting through changes in the sea surface roughness. At moderate wind speeds (up to about 5 m s -1), eddies usually appear in SAR images due to the presence of
natural films on the sea surface which act as passive tracers of surface currents (Johannessen et al. 1996; Gade et al., 2013). Such surfactants dampen the small-scale surface roughness, thereby causing slick areas on the sea surface and reducing the radar backscatter (Alpers and Hühnerfuss, 1989).
At wind speeds exceeding 5 m s-1, the dark patches manifesting surfactant films in SAR images tend to disappear (Dokken and Wahl, 1996). At higher wind speeds, eddies are seen in SAR imagery mainly as a result of wave/current interactions in the zones of current shear, which look like bright curved lines.
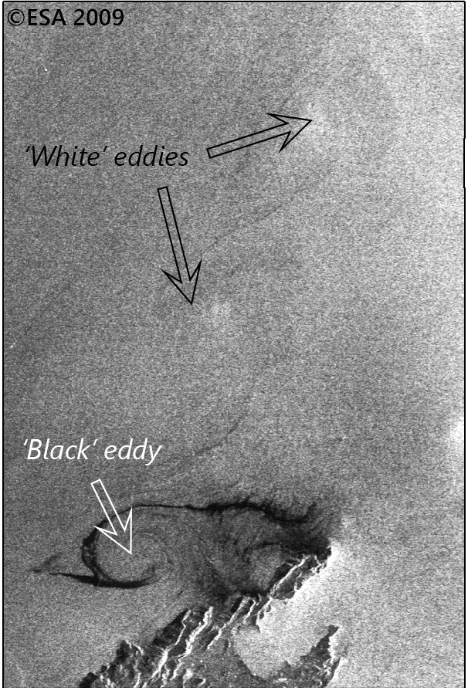
For the convenience sake, hereafter the first type of eddy manifestation is referred to as ‘black’ eddies, while the second, ‘white’ eddies. In Figure 14, an example of ‘black’ and ‘white’ eddies manifested in an Envisat ASAR image of the Balearic Sea is presented. This image was acquired on 16.08.2009 at 10:04 UTC. In the fragment presented, there is a chain of three cyclonic eddies with diameter of about 10 km, which came into being presumably due to influence of the northern spit of the island Mallorca on the hydrodynamic instability of Northern Current (Figure 14).
Figure 14. A chain of two ‘white’ eddies and one ‘black’ eddy observed to the north from the island Mallorca
The spatial distribution of ‘black’ and ‘white’ eddies detected in Envisat ASAR images in 2009-2011 is illustrated by Figure 15. ‘Black’ eddies were found practically everywhere in the Western Mediterranean except for the area of the Sicily Channel and the central part of the Tyrrhenian Sea (Figure 15, upper panel). Decreased density of eddies is also observed in the region to the south-east from the Gulf of Lion, where strong wind-induced mixing frequently occurs.
Location of the highest density of ‘white’ eddies encountered is found in the area to the north-east from the Balearic Islands. Noteworthy that ‘white’ eddies in this region were found not only during the cold period as it is typical for ‘white’ eddies, but during the warm season as well (Figure 15, lower panel). Reasons for such increased ‘white’ eddy activity in this region still need to be discovered. Surprisingly, despite particular strength and energetic surface currents in this area, in the zone of the Atlantic water propagation, there were not so many ‘white’ eddies found.
In the schemes in Figure 15, there is also a seasonal difference in the spatial pattern of distribution of eddies that can be traced. Thus, during the warm season, ‘black’ eddies were found mostly in the northern part of the Western Mediterranean, while during the cold period of year they were prevailingly observed in the area along the southern coast (Figure 15, upper panel). At less extend, this tendency is valid for ‘white’ eddy manifestations as well (Figure 15, lower panel).
Figure 15. Spatial distribution of submesoscale eddies found in the Envisat ASAR imagery in 2009-2011
Unlike the case with mesoscale eddies, it is not so easy to trace seasonal variability of submesoscale eddy activity in the Western Mediterranean. Quite well-developed submesoscale eddies were found throughout the entire year. The greatest quantities of ‘black’ eddies, which manifestation in SAR is less dependent on the wind conditions than that of ‘white’ eddies, were observed in the period from August to November. Due to favourable wind conditions happening during the cold season, most ‘white’ eddies were observed from September to March.
If we take into account the ‘performance’ of spirals of submesoscale eddies, we notice that best-developed vortical structures are still observed during the warm period of year, at least in the northern half of the Western Mediterranean. An example of densely-packed well-developed submesoscale eddies can be found in Figure 16, where a fragment of Envisat ASAR WS image captured on 30.09.2009 at 09:50:23 UTC is shown.
Figure 16. Submesoscale turbulent field in the area to the north-east from the Gulf of Lion, Envisat ASAR, 30.09.2009
CONCLUSIONS
In this study, different datasets of satellite imagery have been analysed aimed at gaining a better insight into surface circulation of the Western Mediterranean. The study revealed quite strong eddy activity at both meso- and submesoscales. Among mesoscale turbulent features, significant seasonality of surface water stirring in the region of interest was observed with the maximum occurring during the warm season and the minimum, during the cold one. Submesoscale vortices were observed during all seasons, but most well-developed eddies were encountered during late summer – early autumn.
ACKNOWLEDGEMENTS
This research was supported by the University of Liege and the EU in the context of the FP7-PEOPLE-COFUND-BeIPD waves by surface films: A new look at an old problem. Journal of Geophysical Research, 94(C5), pp. 6251–6265.
Barale, V. 2008: The European Marginal and Enclosed Seas: An Overview. In: Remote Sensing of the European Seas, V. Barale and M. Gade (Eds.), Springer, Heidelberg, pp. 3–22.
Dokken, S.T. and Wahl, T., 1996. Observations of spiral eddies along the Norwegian Coast in ERS SAR images. FFI Rapport 96/01463. Kjeller, Norway: Norwegian Defence Research Establishment.
Escudier, R., Renault, L., Pascual, A., Brasseur, P., Chelton, D., and Beuvier, J., 2016. Eddy properties in the Western Mediterranean Sea from satellite altimetry and a numerical simulation. Journal of Geophysical Research Oceans, 121, pp. 3990–4006, doi:10.1002/2015JC011371.
Gade, M., Byfield, V., Ermakov, S., Lavrova, O., and Mitnik, L., 2013. Slicks as indicators for marine processes. Oceanography, 26(2), pp. 138-149.
Isern-Fontanet, J., García-Ladona, E., and Font, J. 2006. Vortices of the Mediterranean Sea: An altimetric perspective. Journal of Physical Oceanography, 36, pp. 87–103.
Johannessen, J.A., Shuchman, R.A., Digranes, G., Lyzenga, D.R., Wackerman, C., Johannessen, O.M., and Vachon, P.W., 1996. Coastal ocean fronts and eddies imaged with ERS-1 synthetic aperture radar. Journal of Geophysical Research, 101(C3), pp. 6651–6667, doi:10.1029/95JC02962.
Karimova, S., 2014. Hydrological fronts seen in visible and infrared MODIS imagery of the Black Sea. International Journal of Remote Sensing, 35(16), pp. 6113-6134.
Karimova, S., 2016. Observation of the surface circulation of the Mediterranean Sea from space. Proc. ESA Living Planet Symposium 2016. 9-13 May 2016, Prague, Czech Republic. SP-740. August 2016. ESA Communications, ESTEC, PO Box 299, 2200 AG Noordwijk, The Netherlands.
Karimova, S., 2017. Observations of asymmetric turbulent stirring in inner and marginal seas using satellite imagery. International Journal of Remote Sensing, 38(6), pp. 1642-1664.
Karimova, S. and Gade, M., 2016. Eddies in the Western Mediterranean seen by spaceborne radar. Proc. IGARSS 2016. 10-15 July 2016, Beijing, China.
Millot, C., 1999. Circulation in the Western Mediterranean Sea. Journal of Marine Systems, 20, pp. 423-442.
Pascual, A., Buongiorno Nardelli, B., Larnicol, G., Emelianov, M., and Gomis, D., 2002. A case of an intense anticyclonic eddy in the Balearic Sea (western Mediterranean). Journal of Geophysical Research, 107(C11), 3183.
Redondo, J.M., Matulka, A., Platonov, A., Sekula, E., and Fraunie, P., 2013. Eddy measurements, coastal turbulence and statistics in the Gulf of Lions. Ocean Science Discussions, 10, pp. 55–81.