32
population and sample of the study, the method of data collection and research instruments, data collection procedure,data analysis procedure.
A.Research Design
This study is quantitative research. Quantitative research is deals with questions of relationship, cause and effect, or current status that researchers can answer by gathering and statistically analyzing numeric data.40
The design of this study is correlation design. It is usedto find outwhetherthere is correlation, searched the level of correlation then the clarity obtained from the theory.41
B.Population and Sampleof the Study 1. Population
Irianto opinioned that a population consists of every number of group that researcher would like to study.42Beside, according to McMillan population is a larger group to whom results can be generalized.43
Based on the definition above, it is can be concluded that population is the group to which the researcher would like the result of a study to be generalized. It includes all individuals which has certain characteristic.
40Donal Ary, (et, all), “Introduction to Research in Education (Eight edition)….. p.39. 41
Sambas Ali Muhidin and Maman Abdurahman, Analisis korelasi, Regresi, dan Jalur dalam Penelitian, Bandung : Pustaka Setia, 2007p.105.
42
Agus, Irianto, Bahan Ajaran Statistik Pendidikan,(Jakarta: Depdikbud, 1989), p. 18 43
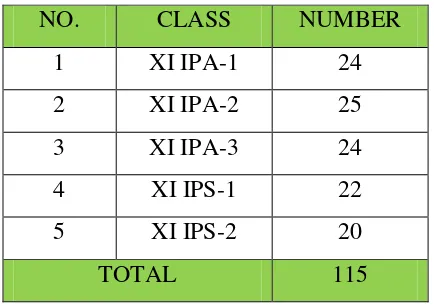
In this study the population is the eleventh class of SMA Muhammadiyah-1 Palangka Raya in academic year 2015/2016. The population consisted of 115 students.
Table 3.1
Number of First Year Students in SMA Muhammadiyah Palangka Raya
NO. CLASS NUMBER
1 XI IPA-1 24
2 XI IPA-2 25
3 XI IPA-3 24
4 XI IPS-1 22
5 XI IPS-2 20
TOTAL 115
2. Sample
According to arikunto, sample is some or represent of population that is researched.44It is a group selected from population for observation in a study.
The writer chose 24 students of XI IPA-2as sample of study by using cluster sampling. Cluster sampling is using a key word placed in the center of a
page (or board), a student’s (or teacher) jots down all the free associations
students give related to the word, cluster sampling similar words.45
44
Suharsimi Arikunto, Prosedur penelitian Suatu Pendekatan Praktek,(Jakarta: PT. Asdi Mahastya,2002), p.131.
45
C.Research Instrument 1. Research Instrument
a. Multiple Choice
According to Arikunto research instrument is a device used by the researcher while collecting data to make his work become easier get the better result complete and systematic in order to make the data easy to be processed.46 In this research, the writer used a test method as the instrument. McMillan stated that “test is an instrument that requires subjects to complete
a cognitive task by responding to a standard set of questions.47”To get the empirical data of the students’ mastery insimple past tense and their ability
in translating past narrative text, the writer administered two kinds of tests, namely grammar test and translation test. As Harmer stated, for many years multiple choice questions were considered to be an ideal test instrument for
measuring students’ knowledge of grammar and vocabulary.48Both of the
tests were in written form. In grammar test, the writer used multiple choice tests. The reason for using multiple choice tests were the technique of scoring is easy and it was more practical for the students to answer. The multiple choices item consists of premise and a set of alternative answers. Premise known as the stem is presented as in complete statement, which the students asked to select only one true answer. The writer gave 50 items of
46
Suharsimi arikunto, op. cit, p. 136 47
James H, McMillan, op. cit, p. 16067
48
Lenka Žlábková, Testing Grammar: Using Multiple Choice Testsversus Translation,
multiple choices as the instrument to collect the data. The student did the test for 60 minutes .(Appendix8)
b. Research Instrument Try Out
The quality of the data, whether it is good or bad, is based on the instrument to collect the data. A good instrument must fulfill two important qualifications. Those are valid and reliable. So, before the test is used as an instrument to collect the data, it will be try out first to the students in other classes. Students gave 60 minutes in doing the test. The writer gave 50 items of try out to class XI IPA-3 students that consists of24 students. The writer makes an analysis to find out the validity and reliability and index difficulty (Appendix 4, 5, 6) of the item of the try out. All of them to decide which items should be used in making instrument.
2. Instrument Validity
a. Content Validity
Validity is a standard or criterion that shows whether the instrument is valid or not. A test is valid to the extent that it measure what it claims to measure.49The writer also measured item validity (Appendix 4) to calculate the validity of instrument of each item the writer used the product-moment formula:
… (1)50
49
Donald Ary, Introduction to research in Education, (New york: CBS College Publishing, 1985), p. 143
50
Suharsimi Arikunto, Prosedur Penelitian, ( Jakarta: Rineka Cipta, 2002),p. 146
rxy = 𝑁 𝑋𝑌−
( 𝑋)( 𝑌)
Where:
rxy = Coefficient of correlation between x and y variable or validity of
each item
N = The number of students/subjects participating in the test
Σx = The sum of score in each item
Σx2
= The sum of the square score in each item
Σy = The sum of total score from each students
Σy2
= The sum of square total score from each students
Σxy = The sum of multiple of score from each student with the total
score in each item
Furthermore, it was calculate using Test-t calculation below:
Where:
t = the value of t observed
r = the coefficient of the result of t observed n = number of students.51
To know the level of validity of instrument, the value of was interpreted based on the qualification of validity as follows:
51
Riduan.2004. Metode dan Teknik Menyusun Tesis, Bandung: Alfaberta, p. 100.
txy>t-table = Valid txy<t-table= Not Valid
t observed =
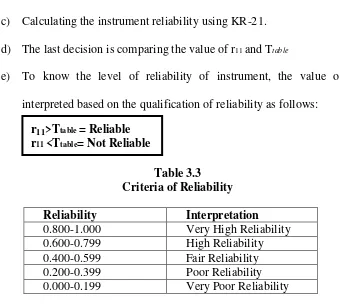
Table 3.2. Criteria of Validity Analysis the instrument approximately believed to be used as the tool collecting the data because it is regarded well. The reliable instrument will give believed data. To know the reliability of the instrument test, the writer will used formula as follows:
Where:
r11 = Reliability of instrument
k = the number of items
M = the mean score for all the testers S = the standard deviation of the test score The steps in determining the reliability of the test are: a) Making tabulating of tester’s scores.
b) Measuring the mean of the testers’ scores with the formula :
c) Calculating the instrument reliability using KR-21. d) The last decision is comparing the value of r11 and Ttable
e) To know the level of reliability of instrument, the value of was interpreted based on the qualification of reliability as follows:
Table 3.3 Criteria of Reliability
Reliability Interpretation
0.800-1.000 Very High Reliability
0.600-0.799 High Reliability
0.400-0.599 Fair Reliability
0.200-0.399 Poor Reliability
0.000-0.199 Very Poor Reliability
The measurement of instrument try out reliability is known and the whole numbers of test item are reliable and can be used as the instrument of the study.(Appendix 5)
4. Difficulty Level
a. Index Difficulty
The index difficulty (or facility value) of an item simply shows how easy or difficult the particular item proved test (Appendix 6). To know the level of difficult of test, the writer will use formula as follows:
F.V = Index of the difficulties R = The number of correct answer N = The total of the students
r11>Ttable = Reliable r11 <Ttable= Not Reliable
FV=
RF.V 0,00 – 0,30 = Difficult 0,30- 0,70 = fair 0,70 – 100 = easy D.Data Collection Procedure
Procedure of collection data is very crucial in a research. It consists of many ways or steps to get the data needed.
1. Preparation
a. The writer chose the place of the study.
b. The writer asked permission to carry out this study. c. The writer created the research instrument.
d. The writer conducted the instrument tryout in the classthat has been determined.
e. The writer analyzed the result of research instrument tryoutto examine the validity, reliability, and index difficulty of the instrument.
2. Implementation
a. The write gave the students two kinds of tests, simple past tense test and translating past narrative text test.
b. The writer asked the students to answer the tests. The time was 60 minutes.
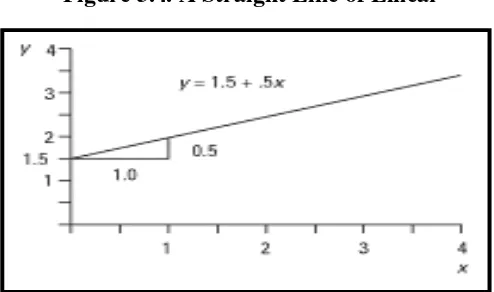
E.Linear Regression
One of condition before analyze the data by using product moment correlation is both of variable has linear association.52 To describe of linear association between quantitative variables, a statistical procedure called regression often is used to construct a model. Regression is used to assess the
contribution of one or mere “explanation” variable to one “response” variable.
It also can be used to predict the value of one variable based on the values of others. Where there is only one independent variable and when the correlation can be expressed as a straight line, the procedure is called simple linear regression.
Figure 1 gives an example of the linear regression line. Figure 3.4. A Straight Line of Linear
Exploring linear data used to understand the data. For some relation there is clearly an independent, or operating, variable and dependent, or response, variable-for example, time and distance. The choice when fitting lines does not always depend on the physical relation between the operating
52
and response variable.53 Any straight line in two-dimensional space can be represented by this equation:54
Where:
Ŷ : the variable on the vertical axis,
x : the variable on the horizontal axis,
a : the y-value where the line crosses vertical axis (often called the intercept), and
b : the amount of change in y corresponding to a one-unit increase in x (often called the slope).
Where Ŷ is the variable on the vertical axis, X is the variable on the
horizontal axis, a isthe Y-value where the line crosses vertical axis (often called the intercept), and b is the amount of change in y corresponding to a one-unit increase in X(often called the slope). The coefficient a and b can be calculated by the following formula:55
53
Exploring Linear Data, (taken From)
http://illuminations.nctm.org/LessonDetail.aspx?id=L298 (online on June 20, 2015) 54
Hartono.2011.Statistik Untuk Penelitian…, p. 157. 55Ibid
Ŷ = a + bX
a
=
( 𝑌) ( 𝑋2) − ( 𝑋) ( 𝑋𝑌)
𝑛 𝑋2− ( 𝑋2)
b =
𝑁 𝑋𝑌− ( 𝑋) ( 𝑌)F. Data Analysis Procedures
To analyze the data of research, the writer has some steps. There are: 1. Collecting the data
In the first step, the writer collected the data about the simple past tense and translatingpast narrative text. So, the writer gave the text to the object of the study.
2. Identifying the data
In this step, the writer checked the correct and incorrect of test. 3. Classifying the data
The writer made classifying of the data. There are two kinds of data; in simple past tense test and translating past narrative text test.
4. Analyzing the data
To analyze the data, the writer used the formula as below: a. Calculated the student’s score
The writer calculated the student’s score by using formula:
Where: S = The score
n = The number of correct answer N = The number of question.56
56
Depdibut.2004. Kurikulum Pedoman Khusus Bhasa Inggris, Jakarta, Direktorat Jendral Agama Islam.
b. Find out the correlation coefficient
∑XY = amount of multiplication result between X score Y score
∑X = amount of all X score
∑Y = amount of all Y score.57
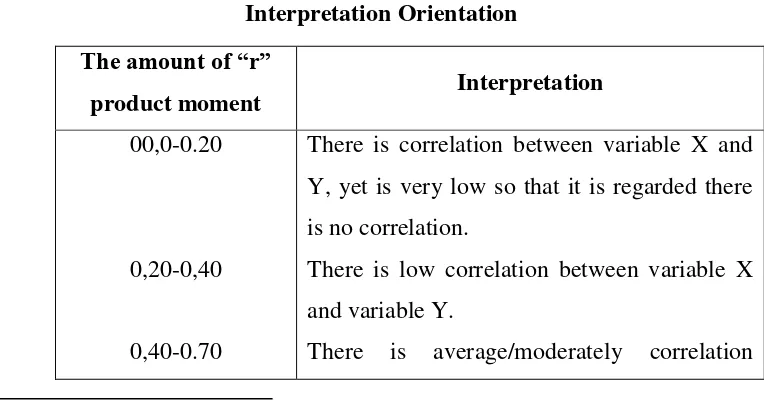
c. Make interpretation
To know how the correlation of the variables is, the value of rxyis
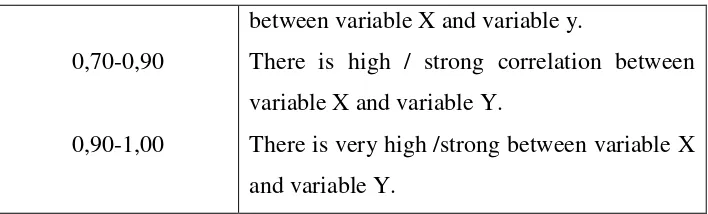
consulted with interpretation correlation as below follows: Table 3.5
There is average/moderately correlation
57
Anas Sudijono. 2003. Pengantar Statistik Pendidikan, Jakarta: Raja Gravendo Persada, p.94.
rxy = 𝑁 𝑋𝑌−
( 𝑋)( 𝑌)
0,70-0,90
0,90-1,00
between variable X and variable y.
There is high / strong correlation between variable X and variable Y.
There is very high /strong between variable X and variable Y.
After the writer found the index number correlation r observed, the writer make interpretation by consultation with “r table”, in the first step, the
writer found degree of freedom. Degree of freedom (df) is the number of observation free to very around a constant parameter. Each inferential statistic has a defined procedure for calculating its degree of freedom, which are used to determine the appropriate critical values in statistical table for determining the probabilities of observed statistics.58Then, to know how the correlation of the variables is, the value of rxy is consulted
with interpretation correlation as below follows:The writer found the result
of index correlation number “r” product moment toward the table of “r”
product of result with seeking the degree of freedom (df) with the formula:
Where;
df = degree of freedom N = number of case
nr = the amount of variable.59
58
Donald Ary, Introduction to research in Education…, p. 640. 59
Anas Sudijono. 2003. Pengantar Statistik Pendidikan…., p. 103.
Next, the writer checked the table of product moment index that created by Pearson to find the degree of freedom significance level. It is used to decide which one hypothesis is accepted, and which one is refused. If “r” observe value is higher than “r” product moment index, Ha is
accepted. Meanwhile, if the “r” observe is lower than “r” product moment index, Ho is accepted.
To know contribution variable X to variable Y, the writer used the following formula;
Where:
KP = determinant coefficient score r = correlation coefficient score.60 5. Evaluating
The writer evaluated the result of the study. It discussed about the factors that influence the result of the study and the relation of the theory and the result of the result. The writer found the evidence that corroborate or disagree.
60
Riduan. 2004. Metode dan Teknik Menyusun Tesis…, p. 138.