Capital structure is a mix of debts and equities used by a company to finance its investment. Debt offers benefit of tax shield from interest expenses that can be deducted in calculating company income tax. Unfortunately, company can not use debts in unlimited amount because it will lead to risk of bankcrupt. Therefore, company needs to establish a target (unobserved) capital structure which will optimize the value of the firm. The purpose of this study is to investigate the determinant of capital structure and ownership in public listed companies in Indonesia Stock Exchange using Time-Series Cross-Section Regression (TSCSREG) and supported with a balanced panel data. Data used are financial statements of 228 public listed companies from group of eight industry sectors. Research finding confirms that tax shield and fixed financial burden are significantly influence the capital structure and state ownership also significantly influence the capital structure of the state owned enterprises.
© 2013 IRJBS, All rights reserved. Keywords:
capital structure,
determinant capital structure, debt equity ratio,
time-series cross-section regression, balanced panel data,
ownership,
Indonesia Stock Exchange
Corresponding author: [email protected]
Arief Tri Hardiyanto
*, Noer Azam Achsani
**, Roy Sembel
***,
Tb. Nur Ahmad Maulana
*****,**,****Institut Pertanian Bogor, Bogor ***IPMI International Business School, Jakarta
A R T I C L E I N F O A B S T R A C T
INTRODUCTION
Capital structure is a mix of debts and equities used by a company to finance its investment activity (Laux, 2011). Theoritically, the corporate financing policy should be directed to achieve optimal capital structure; the capital structure that will maximize the value of the firm. The company may issue a variety of debts in many proportions and try to get a combination of debts and equities which will maximize the value of the firm (Bhole dan Makanud, 2004). The choice of combination of debt and
equity depends on some factors. Some of capitals structures theories explain determinants of capital structure and state that the combination of debt and equity used depend on the cost and benefit of debt and equity. Determination of capital structure is important because the financing choice that make up capital structure will influence on profitability (Pandey, 2004), value of the firms (Koslowsky, 2009) and the cost of capital and investment decisions (Al-Qaisi, 2010).
Vol. 6 | No. 1 ISSN: 2089-6271
Ownership and Determinants Capital Structure
of Public Listed Companies in Indonesia:
Debt offers financial benefits in the form of tax shield. It is a tax saving from interest expense of debts that can be deducted in the calculation of corporate income tax. The increase amount of debts will lead to the increasing amount of company tax shield (Atiyet, 2012; Matemilola and Banny-Ariffin, 2011). However, the company can not obtain such benefits in unlimited amount. The huge amount of debt will be able to drive the company into bankruptcy due to inability of the company to meet the obligation to pay interest and principal installment, that in most cases they are fixed. In financial distress condition, companies are experiencing financial difficulties to fulfill their obligations which could lead companies to go bankrupt (Ilman et al., 2011). Indicator to determine the existence of financial distress includes delays in delivery of ordered goods, reduction in the quality of the product, loss of customer confidence, and the inability to meet company’s operating costs and losses. The phenomenon of a public company which is experiencing financial distress evidenced from the existence of companies that is delisted from the stock market (Pranowo, 2010).
In the development of capital structure theory appears Pecking Order Theory (POT) formulated by Donaldson in 1961 (Manurung, 2011). The POT concerns the order of source financing used by a company. Investment will be financed mainly from internal funds. If it is not enough, the company will issue debt to finance it. Equity is used as a backup source of financing. In 1969, Stiglitz proposed Trade-Off Theory (TOT) which focus on trade-off between tax shield benefit derived from debt’s interest expense and cost of using excessive debt. Based on this theory, the company will attempt to select a certain level of capital structure to balance costs and benefits of debt.
Dynamic capital structure theory was initialy put forward in 1986 by Zwiebel (Khalid, 2011). According to Zwiebel, a company choose a debt in voluntarily with its limitations to develop the
company in the future. The next development of the capital structure theory presented by Fischer et al. in 1989 who develops a dynamic capital structure. This theory seeks to overcome the drawbacks of the static model that does not take into account the possibility of restructuring the capital structure in response to changes in the value of assets that possibly occur at all times. Flannery and Rangan (2006) did a research to determine targeted capital structure using partial adjustment model. The model indicates that companies have a targeted capital structure and some of them close to one third gaps of actual debt and its target every year. Mukherjee and Mahakud (2010) find specific company variables of size, intangible assets, and profitability as important variables in determining target capital structure and the speed of adjustment. Jiang et al. (2010) stated that products competition have significant influence to the deviation of existing capital structure and targeted capital structure. The tighter competitions lead to the smaller capital structure deviation. Clark et al. (2010) gave empirical evidence to strengthen the conclusion that companies do adjustment to achieve target capital structure. They concluded that 26.395 companies in 40 countries made adjustment to target capital structure.
The research on the influence of ownership to capital structure showed different results. Companies controlled by state as a majority shareholder have higher leverage compared to companies controlled by individual shareholders (Li et al., 2011; Okuda and Nhung, 2012). Ruan et al. (2011) found an unlinier relationship between ownership and the firm value and capital structure. Garcia-Teruel and Martinez-Solano (2010) stated that state owned company tends to have a conservative capital structure policy, therefore state owned company will use debts financing prudently.
OECD (2012) predicted that Indonesia will has GDP growth rate of 5.3% between 2011 to 2030 and will stand at the third rank in the world after India’s average GDP growth of 6.7% and China of 6.6%. In the long term perspective of 2011 to 2060, Indonesia’s average GDP growth rate is predicted to remain high at 4.1%, slightly above the China average growth of 4%, and will be in the second rank after India that was estimated to have an average GDP growth of 5.1%. Price Waterhouse Copper (2013) supports OECD estimation and predicted that Indonesia will stand in the 11th position of the world economy in 2030 and will increase to stand in 8th in 2050. This prediction will possibly attract international investors. They will put attention on the research that concerning Indonesia to support their investment policy.
Previous capital structure researches base on the data of listed companies in the Indonesia Stock Exchange were done mostly on a certain industry sector. Margaretha and Ramadhan (2010), Santika and Sudiyatno (2011), Saadah and Prijadi (2012) studied determinants of capital structure in manufacturing industry sector. Kesuma (2009) investigated the same topic in the real estate companies and connected capital structure to the stock price. Wardiman (2012) did a research on the implementation of Pecking Order Theory in palm oil companies. Ruslim (2009) tested Pecking Order Theory in LQ-34 companies. Therefore, research on capital structure in entire public listed companies in Indonesia will fill the gap of the empirical research on capital structure.
The research aims to investigate determinants that significantly influence capital structure. It also tests the influence of ownership on capital structure in listed companies in the Indonesia Stock Exchange. The research will give benefit to the corporate management, financial regulator, and financial researchers. The future research which can be developed includes the influence of debt issuance to the company share price and the impact of economic crisis in 2008 on capital
structure. The rest of the paper will be organized as follows: Research Hypotheses; Data and Methodology that consists of data, regression model and estimation technique, operational variables; Results and Discussion; Managerial Implication, and Conclusion.
Research Hypotheses
Hypotheses of the research are formulated based on theory and previous empirical research findings.
H1: There is a positive relationship between company size and company capital structure.
This hypothesis is derived from empirical research findings that the company capital structure will increase along with the increase of company total assets [Flannery and Rangan, 2006; Bhaird and Lucey, 2010; Muzir, 2011; Kouki and Said, 2012]. A company with big amount of total assets will have appropriate access to financial market that provides long term debts. A small size company prefers to get short term debts when it needs internal fund.
H2: There is a positive relationship between company net fixed assets and company capital structure
This hypothesis is derived from empirical research findings that the company capital structure will increase along with the increase of company net fixed assets (Flannery and Rangan, 2006; Bhaird and Lucey, 2010; Kouki and Said, 2012). A company with big amount of net fixed assets will have appropriate access to financial market that provides long term debts because it possible to offer more tangible assets as debts collaterals.
H3: There is a positive relationship between tax benefit from interest expenses and company capital structure
findings that a company will increase its debts along with the increase of tax benefits from interest and financial expenses [Brierley and Bunn, 2005; Hull, 2006].
H4: There is a negative relationship between cash flow volatility and company capital structure
This hypothesis is derived from risk management theory that high cash flow volatility reflects high risk of net cash flow insufficiency. This will reduce the company ability to pay fixed interest and financial expenses and will decourage company to raise debts.
H5: There is a negative relationship between interest and financial expenses and company capital structure
This hypothesis is derived from empirical research findings that big amount of interest and financial expenses that a company has will lead to financial distress. High interest expenses will reduce the company ability to raise debts.
H6: There is a positive relationship between the amount of intangible assets and company capital structure
This hypothesis is derived from empirical research findings that a lot of money that a company spends for research and development, patents, trade mark, and goodwill will send a signal to public that the company will produce new products or make innovations on old products, therefore need a lot of money to finance it.
H7: There is a negative relationship between state ownership and company capital structure
This hypothesis is based on the fact that the company owner has authority to control company operations, such as in determining policy of capital structure employed by a company [Al-Najjar and Taylor, 2008; Zaroni, 2009; Lakshmi, 2009; Gurunlu
and Gursoy, 2010; Su, 2010; Zuoping, 2011; Phung and Le, 2013; Ganguli, 2013], and tate owned company tends to be conservative in forming capital structure. Therefore, the state owned company tends to use interest bearing debts prudently. (Garcia-Teruel and Martinez-Solano, 2010).
METHODS
Data
The data used in this research is secondary data from quarterly and annually financial statements of public listed company. The annual financial statements are financial statements audited by a public accounting firm; therefore the validity, accuracy, and consistency of the data used are reliable, while the quarterly financial report is unaudited statements. Quarterly financial statement data is used to determine the variable of volatility of cash flows while the annual financial statements are used to determine the other capital structure determinants.
The population of entire research data is public companies listed in the Indonesia Stock Exchange by December 30, 2011 amounted to 442 companies. They are grouped into nine industrial sectors. The screening process is done by excluding companies that:
a. Comes from the banking, financial services, insurance, and related financial (industrial sector classification 8), because the capital structure of financial sector company is regulated by the government.
b. Have a negative total equity and debts value. c. Do not have complete research variables
Infrastructure, Utility, and Transportation sector 20 companies (8,8%), and Trade, Services, and Investment sector 52 companies (22,8%).
Regression Model and Estimation Technique
Testing on capital structure determinants and the influence of ownership on company capital structure is implemented by using Time-Series Cross-Section Regression (TSCSREG ). This procedure requires a set of balanced panel data consists of time-series observation on each cross-section unit (Bayrakdaroglu et al., 2013). Regression model is as follows.
DRit = α + Σβk Xkit + eit (1)
Note:
DRit : Debt Ratio
α : Constanta
βk : Coefficient of determinants capital
structure
Xkit : Determinants of capital structure
eit : Error terms
Detail of main capital structure determinants include company size, fixed assets, tax benefit, cash flow volatility, fixed burden, and intangible assets. The variable of ownership is stated in dummy variable. These determinants are representing the trade-off theory of capital structure. Based on the variables used, the regression model equation stated on number (1) can be written as follows.
DRit = α + β1 SIZEit + β2 FIXAit + β3 TAXit
SIZE : Company size in term of log natural total assets
FIXA : Ratio of fixed assets to total assets TAX : Ratio of tax shield to total interest
bearing debts
SDCF : Log natural standard deviation cash flow INTR : Ratio interest expenses to total interest
bearing debts
INTA : Ratio intangible assets to total assets DOWN : Dummy for ownership
β : Regression coefficient of variables
α : Constanta e : Error term
Dummy ownership factor consists of dummy number 1 for state ownership (state owned enterprises) and dummy number 0 for non state ownership.
Operationalization of Variables
Research variables include independent variable consist of company size, net fixed assest, tax benefit, cash flow volatility, fixed charge, intangible
assets, and ownership. Dependent variable is debt
ratio; ratio of total debts and sum of total debts and total equities. Total debts consist of interest bearing short term and long term debts.
Size is log natural of company total assets. Fixed
asset is ratio of fixed assets to total assets. Fixed assets are tangible assets used to support company operational activities, such as land, building, machinery, and vehicle. The bigger size and fixes assets that the company has the greater capability
of the company to raise debts. Tax benefit is
ratio of tax shield to total interest bearing debts. Tax shield is the amount of tax benefit received by company from using debts. The amount of tax benefit is calculated from interest expenses multiply by company income tax rate. The greater tax shield that the company gets from its income tax calculation, it will push the company to
increase the level of interest bearing debts. Cash
term of interest expenses. Fixed charge is ratio of total interest expenses and other financial expenses to total interest bearing debts. The fixed charge has negative correlation to the amount of debts. The more fixed charges that the company has the less ability for the company to increase
debts. An intangible asset is ratio of intangible
assets to total assets. Intangible assets include patent, trade mark, and research and development expenses. Company that has bigger amount of intangible assets tends to has bigger ability to raise debts because of its high possibility to explore the intangible assets to increase sales.
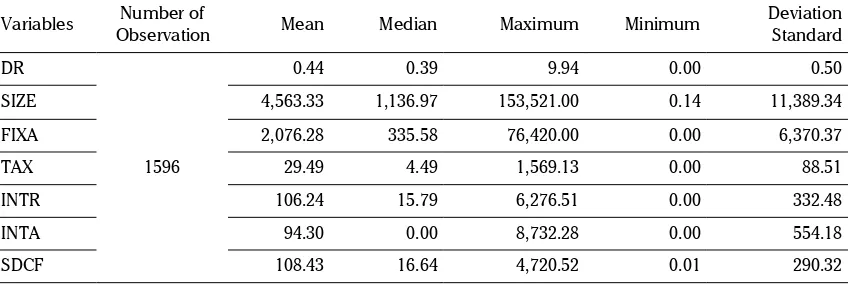
RESULTS AND DISCUSSIONS Descriptive Statistic
Descriptive Statistic on variables data used is presented on Table 1.
Capital Structure Determinants Analysis
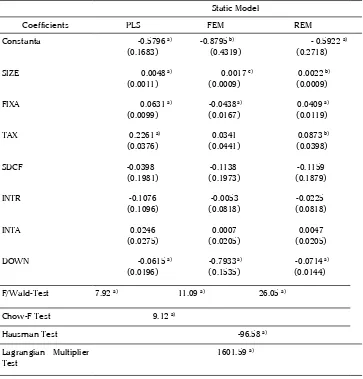
Determinants variable tested are total assets (SIZE), fixed assets (FIXA), tax shield from interest expenses (TAX), net cash flow volatility (SDFC), interest expenses (INTR), and intangible assets (INTA). Those variables reflect trade-off between cost and benefit of debts financing. Testing also includes ownership variable using a dummy data (DOWN).
Table 2 shows estimation results on regression coefficients by using panel data in static model. Three estimation methods used in panel data
analysis are Pooled Least Square (PLS), Fixed Effect Method (FEM), and Random Effect Method (REM).
Overall, three estimation methods produce good results. It showed on coefficients sign and significant level produced by each method. Coefficients sign of all variables used are similar except fixed assets variable (FIXA) in FEM. But, significance level of variable in each method is varying. Cash flow volatility (SDCF), interest expense (INTR), and intangible assets (INTA) are not significant in all three methods. TAX variable is significant in PLS and REM method but it is not significant in FEM. The rest of variables are significant in all of three methods.
To determine the best method that is expected to give best result in term of variation of estimation results, validity, and the good fitness among three estimation models, we implement Chow test, Hausman test, and Lagrangian Multiplier test.
Testing to choose the best method between PLS and FEM is done by Chow test. The result of Chow test concludes that FEM is better than PLS method. Statistic value of Chow test is 9.12 and significant
at α = 1%. Hausman test is used to choose the
best method between FEM and REM. It used to test the null hypothesis that difference in coefficients between FEM and REM is not systematic. Hausman
test shows a value of -96.58 and significant at α
Variables Observation Number of Mean Median Maximum Minimum Deviation Standard
DR
1596
0.44 0.39 9.94 0.00 0.50
SIZE 4,563.33 1,136.97 153,521.00 0.14 11,389.34
FIXA 2,076.28 335.58 76,420.00 0.00 6,370.37
TAX 29.49 4.49 1,569.13 0.00 88.51
INTR 106.24 15.79 6,276.51 0.00 332.48
INTA 94.30 0.00 8,732.28 0.00 554.18
SDCF 108.43 16.64 4,720.52 0.01 290.32
Table 1 Descriptive Statistic
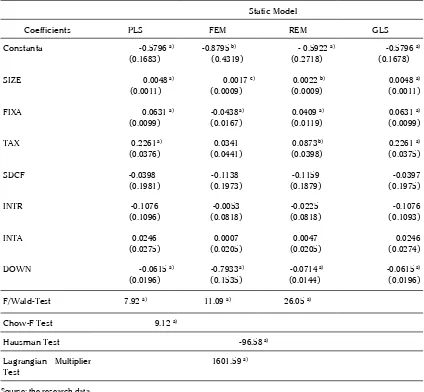
= 1% and concludes that model fitted on these data fails to meet the asymptotic assumptions of Hausman test. In this case, we encountered a case in which the Hausman was not well defined. Therefore, we suggest seeing the estimator for a generalized test, which is Generalized Least Squares (GLS) regression.
The result of cross-sectional time-series GLS regression is presented in Table 3.
The GLS method also concludes that the panels are homoskedastic and no autocorrelation. The estimation result shows that TAX is determinant
variable that has a biggest significant influence on capital structure (DE) of a company. This supports the existence of Trade-Off Theory.
Company Size. Estimation on the total assets (SIZE) produces coefficient of +0.0048. The positive sign on the coefficient gives the meaning that one unit increase in total assets of the company, cateris paribus, will make the value of debt ratio go up by 0.0048. This is in consistent with the expectations of the research hypotheses. Thus, the hypothese is accepted and it can be concluded that firm size has a positive and significant influence on the capital structure. The estimation result supports
Table 2 Estimation Results from Panel Data of Static Capital Structure Static Model
Coefficients PLS FEM REM
Constanta -0.5796 a)
(0.1683) -0.8795
b)
(0.4319) - 0.5922
a)
(0.2718)
SIZE 0.0048 a)
(0.0011) 0.0017
c)
(0.0009) 0.0022
b)
(0.0009)
FIXA 0.0631 a)
(0.0099) -0.0438
a)
(0.0167) 0.0409
a)
(0.0119)
TAX 0.2261 a)
(0.0376) (0.0441) 0.0341 0.0873
b)
(0.0398)
SDCF -0.0398
(0.1981) (0.1973) -0.1138 (0.1879) -0.1159
INTR -0.1076
(0.1096) (0.0818) -0.0053 (0.0818) -0.0225
INTA 0.0246
(0.0275) (0.0205) 0.0007 (0.0205) 0.0047
DOWN -0.0615 a)
(0.0196) -0.7933
a)
(0.1535) -0.0714
a)
(0.0144)
F/Wald-Test 7.92 a) 11.09 a) 26.05 a)
Chow-F Test 9.12 a)
Hausman Test -96.58 a)
Lagrangian Multiplier
Test 1601.59
a)
Source: the research data Notes:
the previous researchs finding that includes firm size as a significant determinant of capital structure.
SIZE significance value (p-value) of 0.000 which is
less than the significance level α = 10%, indicating
that the total assets significantly affect the company’s capital structure. The use of debt by a company that aims to optimize the tax benefits over the interest expense of the debt, according to the trade-off theory, are significantly affected by the total assets of the company.
In the finance theory, the amount of financing
needed is influenced by the amount of investment that is part of the total assets. The increased need of investment will inevitably increase the amount of financing. Financing sources consist of external sources of debts and internal sources of equity. This means that an increase in investment (total assets) may increase the debt ratio because the company prefer to finance the investment with debt that by equity.
Fixed Assets. Fixed assets are tangible assets owned by the company, are used for normal operating activities, and have a useful life of more than one year. Fixed assets are part of the total
Table 3 Estimation Results from Panel Data of Static Capital Structure
Source: the research data Notes:
a) Significant at confident level of 1%, b) Significant at confident level of 5%, c) Significant at confident level of 10%, ( ) Standard Deviation
Static Model
Coefficients PLS FEM REM GLS
assets. Therefore, the effect of changes in fixed assets to the debt ratio is expected to be similar to the effect of changes in estimated total assets to the debt ratio. The estimation of the fixed asset variable (FIXA) produces a coeffficient of +0.0631. Positive sign on this coefficient gives the sense that an increase in one unit of the company’s fixed assets, cateris paribus, will make DER increase by 0.0631. This is consistent with the expectation hypotheses of the study.
The increasing debt ratio means that the increase in the amount of debt is greater than the increase in the amount of equity. Associated with a significant increase in fixed asset, the increasing debt ratio indicates that the addition of fixed assest is mostly finance by debt. This is understandable, because financing with interest bearing debt has a consequences that the company has to pay interest within a specified period. Therefore, the company will use debt financing sources to finance investment (fixed assets) that will generate returns ijn term of cash flow to pay interest charges. Capital budgeting theory states that investment decisions will be approved if the return on investment is greater than the cost of funds. Fixed assets significance value (p-value) of 0.000
which is less than the significant level α = 1%,
indicating that the fixed assets are significantly affect the company’s capital structure.
Tax Benefit. Estimation of variable tax benefits (TAX) produces a coefficient of +0.2261. Positive sign on the coefficient means that one unit increase in tax shield, cateris paribus, will increase the company debt ratio by 0.2261. This is consistent with the hypotheses expectations. The increase in the value of debt ratio means that the increase in the amount of debt is greater than the increase in equity. Associated with a significant increase in the tax shield, the company will seek to raise debt in order to get a greater tax benefit.
Significant value of tax savings variable (p-value of 0.000) which is smaller than the significance
level of α = 1%, gives the meaning that tax shield
is very significant affect the company’s capital structure. This supports the trade-off theory of capital structure. The company tends to increase the level of debts to get more benefit in the form of tax savings derived from interest expense that can be deducted in the calculation of corporate income tax.
Standard Deviation of Cash Flow. Standard deviation of cash flow reflects cash flow volatility. High volatility of net cash flow will increase the risk of cash flows availability required to support the company’s operations. Estimation on standard deviation of cash flow (SDCF) gives a coefficient of -0.0398. The negative sign of the coefficient means that an increase in one standard deviation unit cash flows, cateris paribus, will reduce the company debt ratio by 0.0398. This is consistent with expectations of the research hypotheses.
The amount of debts, interest payments, and installment debt will directly affect the changes in the value of cash flows. High cash flow volatility will lead to the high risk that the company can not fulfill the obligation to pay interest and installment debt. Therefore, high volatility will encourage companies to lower the company’s debt level. Significant value of the net cash flow deviation variables (p-value) of 0.840 which is larger than
the significance level at α = 10%, means that the
volatility of cash flow are not significantly affect the company’s capital structure.
charges that arise from the company’s debt that consists of various types such as bank loans, bonds, promissory notes, and debt either dominated in rupiah and/or foreign currency. The more debts used by company the more interest expenses the company has to pay and the more tax shield that the company will get. On the other hand, the greater amount of interest expenses will create a risk of financial distress for the company because it faces difficulty to pay the interest and other financial expenses.
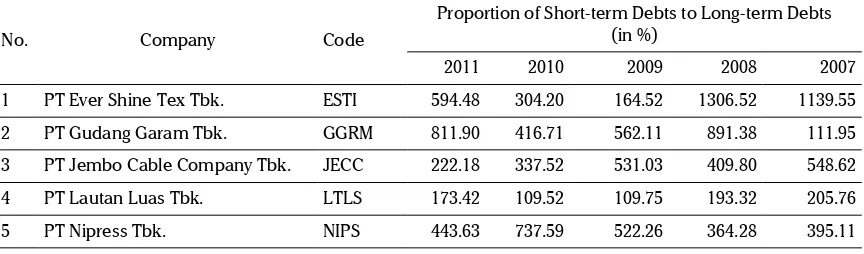
In general, companies use long-term debt to finance long-term investments. Some companies such as PT Charoen Pokphand Indonesia Tbk., PT Telekomunikasi Indonesia (Persero) Tbk., PT Indonesia Air Transport Tbk., and PT Jasa Marga (Persero) Tbk., PT Medco Energi International Tbk. follow such a pattern of debt financing. The main benefit of the pattern is the alignment (matching) between the cash outflow for the payment of interest and principal debt with cash inflows generated from investments (Ariff and Hassan, 2008). To finance operations and current assets, companies generally rely on short-term financing in the form of non-interest-bearing debts such as accounts payable and advance payments and short-term interest-bearing debt such as bank loans and debt notes.
However, there are some companies that use short-term debt in the amount or proportion that in greater than the amount or proportion of long-term debt. Examples of such companies are presented in Table 4.
The major risk of financing pattern that using short-term debt greater than long-term debt is the possibility of mismatch between the need of cash outflow to pay interest and principal of debt to cash inflow that come from long-term investments. This mismatch will give a financial burden impact to the company that can drive the company into financial distress.
Significant value of interest expense variable (p-value of 0.325) which is bigger than the
significance level at α = 10%, gives the meaning
that the effect of interest expense on the company capital structure is not significant.
The fact that there are companies adopt a policy of using interest bearing debt in a relatively high level can be analyzed from the standpoint of incentives for using of debt. High debt level creates incentives for management to be more efficient. With the obligation for the company to provide funds to pay debt principal and interest on the debt, the company is forced to use fund from debts efficiently. The company will not approve expenditures that are not useful, such as various ceremonial activities and official travels that are not necessary. Companies that have high debt levels are likely to be more streamlined in organizational structure because management should trim fat structures that do not provide added value for the company. On the other hand, companies with low debt levels and has a large net cash flow has a tendency to waste funds.
Intangible Assets. Intangible assets consist of patents, goodwill, or mining claim that has no physical form. Intangible assets are presented in the balance sheet as long-term assets and are valued at book value that is cost minus accumulated amortization (Belkaoui, 2013; Kieso et al., 2013). Because intangible assets are often difficult to be assessed accurately, it has a possibility that the fair (market) value of intangible assets differ from the value specified in the Balance Sheet (Brigham and Daves, 2004). Although intangible assets do not have a clear physical value such as buildings or machinery plant, the asset may have a very high value and can be a major factor supporting the company’s long-term success.
the company debt ratio by 0.0246. This is consistent with the hypotheses expectation. Significant value of intangible assets variable (p-value of 0.371)
which is higher than the significance level at α =
10%, means that the influence of intangible assets on the company’s capital structure is not significant. Companies that have large intangible assets have great potential to be able to obtain a sales / profits on an ongoing basis, making it easier for companies to obtain funds from either debt or equity.
Ownership. Estimation of the ownership variable (DOWN) results a coefficient of -0.0615. The negative sign on the coefficient gives a meaning that the State ownership on a public company, in this case the State Owned Enterprises (SOE), cateris paribus, will give impact on the decrease of debt ratio by 0.0615. In other word, state-owned enterprises have a lower debt ratio compared to the non-SOE companies. This is consistent with the hypothese expectations of the study.
However, the estimation result of this study differs from some of the previous studies results which concluded that the company controlled by the State tends to have higher debt level than companies owned by the non-State (Li et al., 2011; Okuda and Nhung, 2012; Jamalabadi et al. 2013). They stated that the company controlled by the state has a favorable position to reduce agency costs that accompany in the process of acquisition debt. This happens because the public company controlled by the State have a privilege to borrow from the State-owned Bank, even after the
company was privatized and listed on the stock exchange (Okuda and Nhung, 2012). However, the level of ownership by the State greater than 51% can destroy the value of the company (Meca, 2011).
Significant value of ownership variable (p-value) of 0.002 which is smaller than the significance
level at α = 1%, indicates that the effect of state
ownership on capital structure is significant. As a company owned by the State, SOE policy on capital structure is still influenced by the government. The Ministry of SOE is acting as representative of the Government as a major shareholder of SOE.
The total number of SOE in the study is 9 companies or 3.94% of the total companies surveyed, or 55% of the total 18 state enterprises that have sold their shares to the public up to December 31, 2011. Average debt ratio of SOEs in the period of 2005 - 2011 per sector and its comparison with the average of the corresponding industrial sector is presented in Table 5.
Table 5 shows that the average debt ratio of SOE for 7 years from 2005 to 2011 is smaller than the mean of each group debt ratio of SOE, except PT Adhi Karya (Persero) Tbk. which has an average debt ratio greater than the average debt ratio in sector 6 of property and real estate sector, sub-sector construction and building. Overall, the average debt ratio of all public listed SOEs of 0.3228 was also lower than the overall average debt ratio companies studied of 0.4378.
No. Company Code
Proportion of Short-term Debts to Long-term Debts (in %)
2011 2010 2009 2008 2007
1 PT Ever Shine Tex Tbk. ESTI 594.48 304.20 164.52 1306.52 1139.55
2 PT Gudang Garam Tbk. GGRM 811.90 416.71 562.11 891.38 111.95
3 PT Jembo Cable Company Tbk. JECC 222.18 337.52 531.03 409.80 548.62
4 PT Lautan Luas Tbk. LTLS 173.42 109.52 109.75 193.32 205.76
5 PT Nipress Tbk. NIPS 443.63 737.59 522.26 364.28 395.11
Government as the majority shareholder of SOEs controls the operation of SOEs through various policies issued by the Ministry of State Enterprises. Policies related to the performance of SOEs include SOEs Ministerial Decree Number: Kep-100/MBU/2002 on Rating System of State Owned Enterprises Performance. Based on the decree, SOE performances are assessed from three indicators namely financial, operational, and administration indicators. One of financial indicator used for the assessment of performance is the ratio of equity capital to total assets. The highest performance score for this indicator is obtained when the ratio of state-owned enterprises reached 30% to 40%. The second highest score was obtained when the SOE can manage their own capital to assets ratio in the range of 40% to 50%.
The Regulation is corroborated by the Decree of the Minister of SOEs Number: Kep-59/MBU/2004 dated June 15, 2004 on the Management Contract of Board of Directors Candidate for State Owned Enterprises. As per the decision, candidates for the Board of SOEs that have passed the fit and proper test must sign a contract before the designated appointment as member of the Board of Directors of SOEs. In the management contracts, certain financial indicators are set as targets to be
achieved, including indicators of equity to total assets ratio.
The performance appraisal policy is believed to affect the strategic and operational policies of SOEs in managing its business. SOE management will strive to get the best performance by meeting the established targets for various indicators of the performance evaluation. One of the financial policies that will be considered is the determination of the company’s capital structure. Indicators that affect the capital structure are the ratio of equity to total assets ratio. Management companies will seek to maintain the equity to total assets ratio in the range of 30% to 50% to obtain optimal assessment scores.
Although the Decree of the Minister of SOEs Number: Kep-100/MBU/2002 is not intended for public listed SOE and the SOE regulated by a separate law, in practice the policy is expected to remain as a reference for the management of SOEs in managing the performance of the company. In 2013, the Ministry of SOEs issued a letter Number: S-08/S.MBU/2013 dated January 16, 2013 on Delivery of Guidelines for KPI Determination and Assessment Criteria of Performance Excellence on SOEs. This guidance is issued to replace the
No. SOEs Company Code SectorCode Mean of DER
SOEs Industry
1 PT Aneka Tambang Tbk. ANTM 2 0.2270
0.4699
2 PT Bukit Asam Tbk. PTBA 2 0.1543
3 PT Timah Tbk. TINS 2 0.2144
4 PT Indofarma Tbk. INAF 5 0.2781
0.2990
5 PT Kimia Farma Tbk. KAEF 5 0.1167
6 PT Adhi Karya Tbk. ADHI 6 0.6262 0.3174
7 PT Jasa Marga Tbk. JSMR 7 0.5586
0.5640
8 PT Gas Negara Tbk. PGAS 7 0.5553
9 PT Telekomunikasi Indonesia Tbk. TLKM 7 0.3790
Total 0.3455 0.4378
Decree of the Minister of SOEs Number: Kep-100/MBU/2002, and apply to all state-owned enterprises.
Thus, the results of this study indicate that the state-owned enterprises in Indonesia are more concerned with the achievement of financial performance as a measure of management’s success in managing SOEs compared to the SOEs privilege to borrow loans from the State-owned bank. Listed SOEs are deemed healthy company that has a capacity to borrow loan not only from the State-owned bank but also from the non-government bank or other financing sources.
MANAGERIAL IMPLICATIONS
Corporate managers can optimize tax benefits derived from the company’s use of debt by selecting debts as major sources of corporate financing. However, managers must consider bankruptcy costs arising from the use of excessive debt. Therefore, it is very important for managers to be able to estimate the target capital structure of the company and make it as a guide in formulating corporate financing policies.
The Ministry of State Owned Enterprise as a representative of the state ownership in SOEs can use these results as a basis for policy making
of SOEs performance assessment. The Ministry of State Owned Enterprise can perform further research for the same topic to all state enterprises or based on industry sector classifications. Financial researchers can use these research findings as references for further research on capital structur especially on the determinants of capital structure.
CONCLUSION
This study aims to analyze the determinants of capital structure of listed companies in Indonesia and the effect of state ownership on capital structure of listed SOEs. The estimation results of testing the determinants of capital structure using a static model that include a variable of ownership indicate that tax shield, company size, and fixed assets have a significant and positive effect on capital structure. Interest expense has a negative effect on capital structure but it is not significant. This supports the existence of the trade-off theory in the formation of capital structure in Indonesia. Estimation of the ownership variables produces a significant negative sign which indicate that the State ownership has a significant influence on the formation of capital structure in the State-owned enterprise. SOEs tend to have a lower debt ratio compared to the non-State owned company.
R E F E R E N C E S
Al-Qaisi K. (2010). The capital structure choice of listed firms on two stock markets and one country. Business Review. 16(2). Al-Najjar B. & Taylor P. (2008). The relationship between capital structure and ownership structure. Management Finance.
34(12): 919-933.
Ariff M. & Hassan T. (2008). How capital structure adjusts dynamically during financial crises. Corporate Finance Review. 13(3):11-24.
Belkaoui A.R. (2013). Accounting Theory. 5th ed. London (UK): Thomson Learning 2004.
Bhaird C.M. & Lucey B. (2010). Determinants of capital structure in Irish SMEs. Small Business Economy. 35:357–375. Bhole L M & Mahakud J.( 2004). Trends and Determinants of Corporate Capital Structure in India: A Panel Data Analysis.
Finance India 18, 1: 37-55.
Bodie Z, Kane A, Marcus AJ. 2008. Investment. 7th ed. Boston (US). Mc Graw Hill.
Central Bureau of Statistic. (2012, February 15). Pertumbuhan Ekonomi Indonesia. Berita Resmi Statistik. No. 13/02/Th. XV, February 6, 2012. Retrieved from http://www.bps.go.id/brs file/pdb_06feb12.pdf.
Flannery M.J. & Rangan K.P. (2006). Partial adjustment toward target capital structures. Journal of Financial Economics. 79:469 -506.
Garcia-Teruel P J & Martinez-Solano E P. (2010). Ownership structure and debt maturity: new evidence from Spain. Review Quantitative Financial Accounting. 35:473–491
Ganguli S.K. (2013). Capital structure - does ownership structure matter? Theory and Indian evidence. Studies in Economics and Finance. 30(1):56-72.
Gurunlu M. & Gursoy G. (2010). The influence of foreign ownership on capital structure on non-financial firms: evidence from Istambul Stock Exchange. IUP Journal of Corporate Governance. 19(4).
Huang B.Y., Lin C.M., & Huang C.M. (2011). The influences of ownership structure: evidence from china. The Journal of Development Areas. 45(1):209-227.
Hull R.M. (2007). A capital structure model. Investment Management and Financial Innovations. 4(2):8-26.
Ilman M, Zakaria A, & Nindito M. (2011). The influences of micro and macro variabels toward financial distress condition on manufacture companies listed in Indonesia Stock Exchange. Proceeding. The 3rd International Conference on
Humanities and Social Science. Prince of Songkla University.
Jamalabadi H.R.R, Zereshki A.D. & Shoroki M.R. (2013). Investigating the relationship of the effect of government ownership and main shareholders on finance structure of companies. Interdisciplinary Journal of Contemporary Research in Business. 5(1):94-104.
Kesuma, A. (2009). Analisis faktor yang mempengaruhi struktur modal serta pengaruhnya terhadap harga saham perusahaan real estat yang go publik di Bursa Efek Indonesia. Jurnal Manajemen Kewirausahaan. 11(1):38-45.
Khalid, S. (2011). Financial reforms and dynamics of capital structure choice: a case of publically listed firms of Pakistan. Journal of Management Research. 3(1).
Kieso, D.E., Weygandt, J.J., & Warfield, T.D. (2013). Intermediate Accounting. 15th ed. New York (US): John Wiley and Sons Inc.
Koslowsky, D. (2009). The relation between capital striucture and expected return. [disertasi]. Manitoba (CA): The University of Manitoba.
Kouki, M. & Said, H.B. ( 2012). Capital structure determinants: new evidence from French panel data. International Journal of Business and Management. 7(1):214-229.
Lakshmi, K. (2009). Ownership Structure and Capital Structure: Evidence from Indian Firms. SSRN Working Paper Series. Laux, J. (2011). Topics in finance Part V – capital structure. American Journal of Business Education, 4, 79-88.
Li, K., Yue, H., & Zhao, L. (2011). Ownership, institutions, and capital structure: evidence from China. Journal of Comparison Economy. 37:471-490.
Manurung, A.H. (2011). Metode Penelitian: Keuangan, Investasi, dan Akuntansi Empiris. Jakarta (ID). PT Adler Manurung Press.
Margaretha, F. & Ramadhan, A.R.( 2010). Faktor-faktor yang mempengaruhi struktur modal pada manufaktur di Bursa Efek Indonesia. Jurnal Bisnis Akuntansi. 12(2):119-130.
Meca, E.G. & Ballesta, J.P.S.( 2011). Firm value and ownership structure in the Spanish capital market. Corporate Governance. 11(1): 41-53.
Muzir, E. (2011). Triangle relationship among firm size, capital structure choice and financial performance. Journal of Management Research. 11(2):87-98
Organisation Economic Cooperation and Development. (2012). Looking to 2060: Long-term global growth prospects. Economic Policy Papers. (3).
Okuda, H. & Nhung, L.T.P. (2012). Capital Structure and Investment Behavior of Listed Companies in Vietnam: An Estimation of the Influence of Government Ownership. Internationl Journal of Business and Information. 7(2): 137-164.
Pandey, I.M. (2004). Capital structure, profitability and market structure: evidence from Malaysia. The Asia Pacific Journal of Economics & Business. 8(2):78-94.
Pranowo, K. (2010). Corporate financial distress perusahaan public (non financial companies) di Indonesia [disertasi]. Bogor (ID): IPB.
Phung, D.N. & Le,T.P.V. (2013). Foreign ownership, capital structure and firm performance: empirical evidence from Vietnamese listed firms. IUP Journal of Corporate Governance . 12(2):40-58.
Price Waterhouse Copper Economics. (2013, January). World in 2050- The BRICs and beyond: prospects, challenges and opportunities. Retrieved from https://www.pwc.com/en_GX/gx/world-2050/assets/pwc-world-in-2050-report-january-2013.pdf.
Ruan, W., Tian, G., & Ma, S. (2011). Managerial ownership, capital structure, and firm value: evidence from China’s civilian-run Firms. Australia Accounting Business Financial Journal. 5(3): 6.
Saadah, S. & Prijadi, R. (2012). Capital structure’s dynamic responses to exogenous variabels: a case of listed manufacturing firms in Indonesia. International Journal of Financial Research. 3(2).
Santika, R.B. & Sudiyatno, B. (2011). Menentukan struktur modal perusahaan manufaktur di Bursa Efek Indonesia. Dinamika Keuangan dan Perbankan. 3(2):172-183.
Su, L.D. (2010). Ownership structure, corporate diversification and capital structure. Evidence from China’s publicly listed firms. Management Decision. 48(2): 314-339.
Wardiman, A. (2012). Analisis struktur modal perusahaan kelapa sawit [disertasi], Bogor (ID): Intitut Pertanian Bogor. Zaroni (2009). Pengaruh kepemilikan pemerintah, kepemilikan asing, dan pergantian CEO terhadap kinerja keuangan Badan
Usaha Milik Negara setelah diprivatisasi. Retrieved from http://juzz71.wordpress.com/2009/10/13/ .