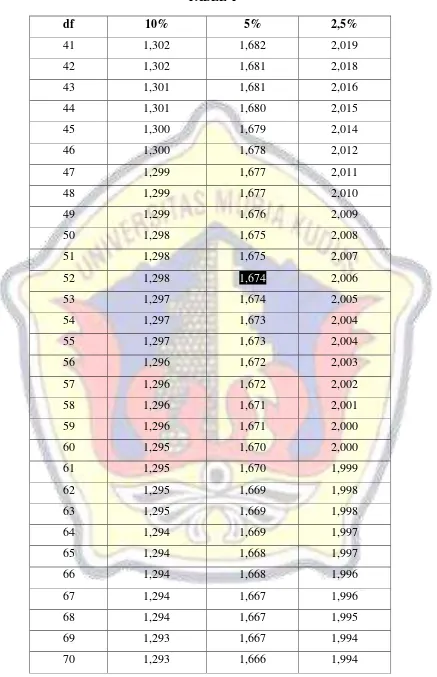
LAMPIRAN 1
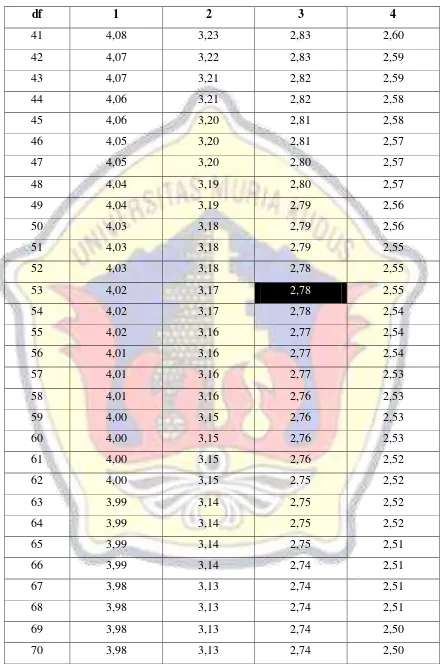
LAMPIRAN 2
FREKUENSI GAJI
Frequencies
Statistics
Frequency Table
X1_1
Frequency Percent Valid Percent
Cumulative Percent
Valid 1.00 1 1.8 1.8 1.8
Frequency Percent Valid Percent
Cumulative Percent
Valid 3.00 11 19.3 19.3 19.3
4.00 34 59.6 59.6 78.9
5.00 12 21.1 21.1 100.0
Total 57 100.0 100.0
Frequency Percent Valid Percent
Cumulative Percent
Valid 3.00 9 15.8 15.8 15.8
4.00 27 47.4 47.4 63.2
5.00 21 36.8 36.8 100.0
Total 57 100.0 100.0
X1_4
Frequency Percent Valid Percent
Cumulative Percent
Valid 3.00 14 24.6 24.6 24.6
4.00 27 47.4 47.4 71.9
5.00 16 28.1 28.1 100.0
FREKUENSI INSENTIF
Frequencies
Statistics
Frequency Table
X2_1
Frequency Percent Valid Percent
Cumulative Percent
Valid 3.00 9 15.8 15.8 15.8
4.00 30 52.6 52.6 68.4
5.00 18 31.6 31.6 100.0
Total 57 100.0 100.0
X2_2
Frequency Percent Valid Percent
Cumulative Percent
Frequency Percent Valid Percent
Cumulative Percent
Valid 2.00 2 3.5 3.5 3.5
Frequency Percent Valid Percent
Cumulative Percent
Valid 2.00 2 3.5 3.5 3.5
Frequency Percent Valid Percent
Cumulative Percent
Valid 2.00 3 5.3 5.3 5.3
3.00 14 24.6 24.6 29.8
4.00 25 43.9 43.9 73.7
5.00 15 26.3 26.3 100.0
FREKUENSI KINERJA KARYAWAN
Frequencies
Statistics
Frequency Table
Y_1
Frequency Percent Valid Percent
Cumulative Percent
Valid 3.00 8 14.0 14.0 14.0
4.00 25 43.9 43.9 57.9
5.00 24 42.1 42.1 100.0
Total 57 100.0 100.0
Y_2
Frequency Percent Valid Percent
Cumulative Percent
Valid 3.00 13 22.8 22.8 22.8
4.00 25 43.9 43.9 66.7
5.00 19 33.3 33.3 100.0
Total 57 100.0 100.0
Y_3
Frequency Percent Valid Percent
Valid 3.00 8 14.0 14.0 14.0
4.00 37 64.9 64.9 78.9
5.00 12 21.1 21.1 100.0
Total 57 100.0 100.0
Y_4
Frequency Percent Valid Percent
Cumulative Percent
Valid 2.00 2 3.5 3.5 3.5
Frequency Percent Valid Percent
Cumulative Percent
Valid 2.00 1 1.8 1.8 1.8
3.00 12 21.1 21.1 22.8
4.00 31 54.4 54.4 77.2
5.00 13 22.8 22.8 100.0
FREKUENSI IDENTITAS RESPONDEN
Frekuensi Jenis Kelamin
Frequencies
Statistics
Jenis_kelamin
N Valid 57
Missing 0
Jenis_kelamin
Frequency Percent Valid Percent
Cumulative Percent
Valid Laki-laki 43 75.4 75.4 75.4
Perempuan 14 24.6 24.6 100.0
Total 57 100.0 100.0
Frekuensi Pendidikan
Frequencies
Statistics
Pendidikan
N Valid 57
Missing 0
Pendidikan
Frequency Percent Valid Percent
Cumulative Percent
Valid D3 13 22.8 22.8 22.8
S1 41 71.9 71.9 94.7
SMA 3 5.3 5.3 100.0
Frekuensi Masa Kerja
Frequencies
Statistics
Masa_kerja
N Valid 57
Missing 0
Masa_kerja
Frequency Percent Valid Percent
Cumulative Percent
Valid 1 - 5 tahun 30 52.6 52.6 52.6
6 - 10 tahun 27 47.4 47.4 100.0
HASIL REGRESI
Regression
Descriptive Statistics
Mean Std. Deviation N
Kinerja_karyawan 20.2982 1.47557 57
Gaji 16.1053 1.60005 57
Insentif 20.0351 1.80243 57
Correlations
Kinerja_karyawa
n Gaji Insentif
Pearson Correlation Kinerja_karyawan 1.000 .523 .620
Gaji .523 1.000 .259
Variables Entered/Removed
Model
Variables Entered
Variables
Removed Method
1 Insentif, Gajia . Enter
Model Summaryb
Model R R Square
Adjusted R Square
Std. Error of the
Estimate Durbin-Watson
1 .725a .526 .509 1.03445 1.984
a. Predictors: (Constant), Insentif, Gaji b. Dependent Variable: Kinerja_karyawan
ANOVAb
Model Sum of Squares df Mean Square F Sig.
1 Regression 64.146 2 32.073 29.972 .000a
Residual 57.784 54 1.070
Total 121.930 56
a. Predictors: (Constant), Insentif, Gaji b. Dependent Variable: Kinerja_karyawan
Coefficientsa
Model
Unstandardized Coefficients
Standardized Coefficients
t Sig.
B Std. Error Beta
1 (Constant) 5.996 1.854 3.234 .002
Gaji .359 .089 .389 4.011 .000
Insentif .426 .079 .520 5.359 .000
a. Dependent Variable: Kinerja_karyawan
Residuals Statisticsa
Minimum Maximum Mean Std. Deviation N
Predicted Value 17.7593 23.0237 20.2982 1.07026 57
Residual -2.96299 1.61482 .00000 1.01581 57
Std. Predicted Value -2.372 2.547 .000 1.000 57
Std. Residual -2.864 1.561 .000 .982 57