AGRIVITA Journal of Agricultural Science. 2016. 38(3): 282-295
IMPLICATION OF GENE ACTION AND HERITABILITY UNDER STRESS
AND CONTROL CONDITIONS FOR SELECTION IRON TOXICITY TOLERANT IN RICE
Yudhistira Nugraha 1,2), Sintho Wahyuning Ardie 2), Suwarno 1), Munif Ghulamahdi 2) and Hajrial Aswidinnoor 2*)
1) Indonesian Agency for Agricultural Research and Development Jl. Pasar Minggu Jakarta 12540, Indonesia
2) Department Agronomy and Horticulture, Faculty of Agriculture, Bogor Agricultural University (IPB) Jl. Meranti Kampus Darmaga Bogor 16680, Indonesia
*) Corresponding author E-mail: [email protected]
Received: December 2, 2015 /Accepted: July 29, 2016 ABSTRACT
Iron toxicity is major constraint of rice production in irrigated-lowland. The Improvement of tolerant rice cultivar to iron toxicity requires the information of some genetics parameters related to selected characters. This study was aimed to estimate gene action and heritability of the grain yield and its component under iron-toxic stress and control field conditions in rice. The iron-toxic tolerant rice cultivars, Pokkali and Mahsuri were crossed with the sensitive cultivar, Inpara5 to develop six generation populations. The breeding materials were grown in the iron toxicity site and control in Taman Bogo, Lampung Indonesia in the wet season from December 2013 to March 2014. The sensitive parent and BC1P1 had lower stress tolerance index (STI) compared to the tolerant parent F1, F2 and BC1P2. The grain yield and its component were fitted to the best model in five parameters which were more prominent with interactive epistasis of duplicate and comple-mentary gene action. The heritability’s under control were more higher compared to iron toxicity stress condition. Delaying selection to later generations and combining with the shuttle breeding between stressed and controlled environments were the best strategy for improving the grain yield and tolerance to iron toxicity in rice.
Keywords: epistasis; generation means analysis; Joint scale test; leaf bronzing stress; tolerance index
INTRODUCTION
Rice is an important crop for Indonesian because it is not only just a staple food but also a strategic commodity that has a significant role on
the economic, political and social-life. Indonesian government needs to insure the self-sufficient of rice by increasing rice production, which more than 51.7% of rice production is produced in Java Island (Statistics Indonesia, 2015). The remaining areas of Indonesian paddy field are located outside Java, which they are predominantly as an old-weathered soil or Ultisols soil (Prasetyo & Suriadikarta, 2006) and tidal swampy-land (Muhrizal, Shamshuddin, Fauziah, & Husni, 2006). One of the characteristic of these soils is abundant of iron-oxide in mineral soil formation. During flooded conditions where most of rice is cultivated, this soil mineral can be changed into ferrous ion (Fe2+). This formation is more soluble and ready to be uptaken by plant and resulting a toxic condition to rice plant when it is excessive. The Fe2+ concentrations in the soil solution that can affect lowland-rice yields are ranging from 10 to >5000 mg L–1 (Becker & Asch, 2005). However, it is generally considered that a soil solution concentration of 300 mg water-soluble Fe L–1 can be a critical limit for appearing of iron toxicity symptom in low-land rice (Fageria, Santos, Barbosa Filho, & Guimarães, 2008).
Typical symptom iron toxicity in rice is called a leaf bronzing, a reddish spots discoloration starting from the tips spreading to the basal part, resulted stunted plant height, low tiller number, and poorly developed root system (Dobermann & Fairhurst, 2000). In acute case eventually causes the damaging of plant and contributes to a 12-100% yield loss (Audebert & Sahrawat, 2000). Rice-based affected areas to iron toxicity can be found at most of rice production country in humid-tropic region as much as 7 million ha (Becker & Asch, 2005).
Cite this as: Nugraha, Y., Ardie, S. W., Suwarno, Ghulamahdi, M. & Aswidinnoor, H. (2016). Implication of gene action and heritability under stress and control conditions for selection iron toxicity tolerant in rice. AGRIVITA Journal of Agricultural Science, 38(3), 282-295. http://doi.org/10.17503/agrivita.v38i3.740
Accredited: SK No. 81/DIKTI/Kep/2011
Yudhistira Nugraha et al.: Implication of Gene Action and Heritability Under Stress and Control Conditions………
Meanwhile, in Indonesia there is no recent data about the total area of low-land rice affected to iron toxicity, but Ismunadji (1990) roughly estimated about 1 million ha, which predominantly consisted with acidic soil and tidal swampy land. Since it is quit huge areas, it is greatly important to increase rice production of these areas to meet the growing demand of rice in Indonesia.
The best way to minimize the iron toxicity effect in rice is using tolerant cultivar (Stein, Lopes, & Fett, 2014). Most of the modern semi-dwarf high yielding rice cultivars were sensitive to iron toxicity (Wade, Fukai, Samson, Ali, & Mazid, 1999), whereas the tolerant varieties were mostly identified as a land race and wide species (Onaga, Egdane, Edema, & Abdelbagi, 2013). Introducing the iron toxicity tolerant traits into modern cultivars is very important to develop simultaneously a high yield and tolerant to iron toxicity cultivars.
In the breeder point of view, the estimation of genetics parameters such as, heritability, gene action and correlation among characters’ are very important in order to formulate the most advan-tageous breeding procedures. The genetic studies on iron toxicity both using classical and molecular approach in rice were reported referring to complex inheritance and govern by many genes (Dufey, Hakizimana, Draye, Lutts, & Bertin, 2009; Dufey et al., 2015; Shimizu, 2009; Wan, Zhai, Wan, & Ikehashi, 2003; Wu et al., 2014). Those genetics studies mostly were conducted only under one site environment in the controlled greenhouse or the iron-toxic stress conditions in the field, but they never compared to the controlled environments.
The generation mean analysis has been the most powerful to estimate genetics para-meter, since it gives additional information about the epitasis interactions (Kearsey & Pooni, 1996). Various genetic analysis using generation mean analysis by comparing between the stress and control conditions have been reported in many crops and different stresses such as, salinity stress in chick pea (Samineni et al., 2011), down mildew resistant in muskmelon (Shashikumar, Pitchaimuthu, & Rawal, 2010), anthracnose stalk resistant rot in maize (Matiello et al., 2012) and drought tolerance in wheat (Said, 2014). However, there are no reports on genetic study of iron toxicity tolerance in rice by comparing two or more environments. Considering that in some regions, the iron toxic soils are not easily
accessible for conducting field screening, in Indonesia e.g. Sumatera, Kalimantan and Papua where it is far from research center. It is, therefore, very important for comparing the genetic parameters from the generation mean analysis under various environments. The result from this genetics study would lead the breeder to answer the question should the selection be done under the stressed condition or in-house experimental farm or under control condition.
This study was extrapolated the inheritance of some agronomy and the grain yield traits under natural field condition with high iron concentration and control sites. The populations of crosses Pokkali, an iron-tolerant variety with robust development of seedling type (Engel, Asch, & Becker, 2012) and excluder-tolerant type (Wu et al., 2014) and Mahsuri, an iron toxicity tolerant varieties well known in Indonesia (Suhartini & Makarim, 2009) were used to in generation mean analysis (Mather & Jinks, 1982). The information of this current study would improve the understanding of inheritance of iron toxicity tolerance in rice as well as facilitate planning possible breeding programs. In this study gene action, heritability, and correlation among related traits were measured.
MATERIALS AND METHODS
Plant Materials and Experimental Site
The rice variety Pokkali and Mahsuri were used as tolerant parents to iron toxicity, while Inpara5 as sensitive parent. The varieties were crossed in a resulting of populations each composed of six generations per cross the parents (P1, P2), F1, F2 and two backcrosses of the F1 to the parents (BCP1, BCP2). Pokkali is rice variety introduced from India and it has been reported tolerant to iron toxicity (Engel, Asch, & Becker, 2012; Wu et al., 2014) and tolerant to salinity as well (Gregorio et al., 2002). Mahsuri is commonly used as tolerant check variety for iron toxicity screening in the field, originally from Malaysia (Suhartini & Makarim, 2009; Utami & Hanarida, 2014), and the sensitive parent, Inpara5, is semi-dwarf plant type that had been designed as the NILs of IR64 that inserting a submergence tolerance gene, SUB1 (Septiningsih et al., 2015).
Yudhistira Nugraha et al.: Implication of Gene Action and Heritability Under Stress and Control Conditions………
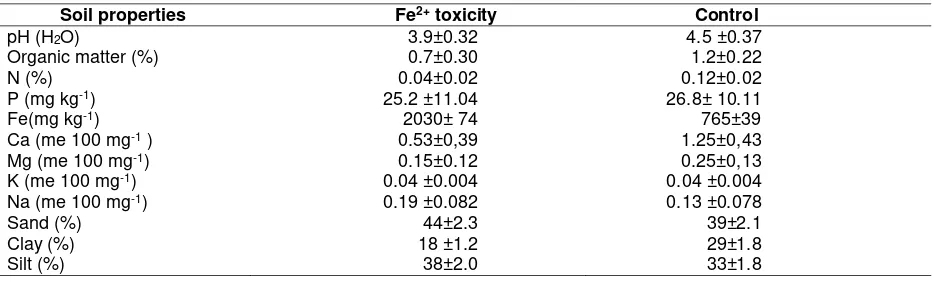
season from December, 2013 to March, 2014. The experiment site has Af climate-type (Köppen-Geiger classification), average temperature is 26.9oC, and annual rainfall is 2,143 mm. Two plots were used for iron toxicity site and control site. The iron toxicity site has been identified as a natural Fe toxicity when it is flooded. Variations in soil iron content between the two plots were expected due to position difference in the topo-sequence. Four soil samples from the field (each a composite of at least three sub-samples) are showed in Table 1.
Experimental Design and Cultural Practices Common agronomic practices for rice growing, including plowing, harrowing, and flooding was done both in the experimental site. The basal fertilizer was broadcasted at the rate of 46 kg N ha-1 and 36 kg P
2O5 ha-1 and 45 kg K2O ha -1. The N fertilizer application was given additionally at 3 weeks after transplanting at the rate of 23 kg N ha-1. The iron toxic plot was kept submerged at depth 10-15 cm water to prevent oxidation of Fe2+ to Fe3+. The observed parameters were measured to 20 of F1, 100 of BC1P1, and BC1P2 and 250 of F2 population.
Data Recording, Measurement and Analysis Each plant in all population was tagged and given a number to make sure that the measurement of all observed characters was indicated to the same plant. The leaf bronzing score (LBS) was scored non-destructively at 6 weeks after transplanting for leaf bronzing using the SES developed by IRRI (IRRI, 1996). Plant height was determined by measuring the height
from base of the shoot to the highest tip of panicle. The grain per plant was hand-threshed of all panicles. The filled grains were separated and counted to weights for determining 100-grain weight. The grain yields then were adjusted to a moisture concentration of 14% of fresh weight. The grain numbers were defined by divided the grain yield per plant with its respective 100-grain weight per 100.
A joint-scale test was performed using chi-square goodness of fit with three degrees of freedom as described by (Cavalli, 1952). When the three-parameters individual-scaling model did not show conformity of additive dominance (i.e. with values different from zero), a six-parameter scaling model was performed as:
m = ½P1+½P2 + 4F2– 2B1– 2B2
[d]= ½P1– ½/P2; = 6B1 + 6B2– 8F2– F1– 1½P1– 1½P2
[i] = 2B1 + 2B2– 4F2 [j] = 2B1– P1– 2B2+P2
[l] = P1 + P2 + 2F1 + 4F2– 4B1– 4B2
This equation includes the contribution of a digenic epistasis (nonallelic interaction). The test provides estimates for three parameters mid-parent m, additive effect [d], dominance effect but also provides estimates for three epistasis parameters; additive x additive [i]; additive x dominance [j] and dominance x dominance [l]. A
significant level (P ≤ 0.05) was used to compare
all components. The three- and six-parameter models were developed as described by Mather & Jinks (1982).
Table 1. Soil chemical analysis in two distinct site with iron and non-iron toxicity in Taman Bogo Experimental Station
Soil properties Fe2+ toxicity Control
pH (H2O) 3.9±0.32 4.5 ±0.37
Organic matter (%) 0.7±0.30 1.2±0.22
N (%) 0.04±0.02 0.12±0.02
P (mg kg-1) 25.2 ±11.04 26.8± 10.11
Fe(mg kg-1) 2030± 74 765±39
Ca (me 100 mg-1 ) 0.53±0,39 1.25±0,43
Mg (me 100 mg-1) 0.15±0.12 0.25±0,13
K (me 100 mg-1) 0.04 ±0.004 0.04 ±0.004
Na (me 100 mg-1) 0.19 ±0.082 0.13 ±0.078
Sand (%) 44±2.3 39±2.1
Clay (%) 18 ±1.2 29±1.8
Yudhistira Nugraha et al.: Implication of Gene Action and Heritability Under Stress and Control Conditions………
Broad-sense heritability was estimated using the method described by Fehr (1987) as h2
bs = σ2g/ (σ2g + σ2e). The estimate of genetic variance (σ2g) is equal to the variance of F
2
generation (σ2 F
2) minus the environmental variance (σ2e). In this formula:
σ2
e= [nP1σ2P2 + nP2σ2P2 + nF1 σ2F1]/Ne Where:
nP1= number of plants of sensitive parents (P1) nP2=number of plants of resistant parents (P2) nF1= number of plants of F1 generations
Ne= effective population size, where Ne = nP1 + nP2 + nF1, i.e. number of P1, P2 and F1, respectively
The method used to estimate narrow-sense heritability was adapted from (Fehr, 1987) as:
h2
ns= [2(σ2 F2) –(σ2BC1+ σ2 BC2)/σ2F2 Where:
σ2 F
2 = variance among F2individuals
σ2BC
1= variances of BCP1 generations
σ2BC
2= variances of BCP2 generations
Correlation between related traits was performed using simple Pearson correlation.
The statistical analyses were done using SAS/STAT® version 9.1. (SAS Institute, 2004). The SAS listing program for the scaling test of three and six parameters and heritability analysis were developed by Gusti N. Adi-wibawa (Supplemental data 2).
RESULTS AND DISCUSSION
The Means and Stress Tolerant Index among Generations
In the field, iron toxicity symptom did not immediately affect the growth of rice plants upon transplanting. The plants showed the leaf-bronzing symptom at the 4-week stage in the field and affected the growth and grain yield compared to normal condition. This observation indicated that the appearances of leaf bronzing depends on the present of ferrous iron as a result from microorganism reducing activity in the soil (Weber, Achenbach, & Coates, 2006) and accumulation of ferrous in the active tissue of the rice plant as a result of iron uptake and transpirations (Pereira et al., 2013).
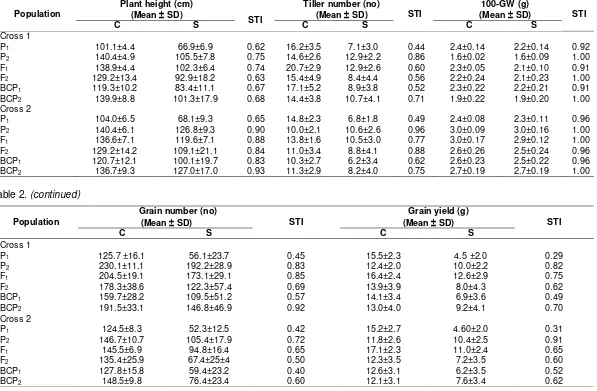
The means and standard errors for parents, F1, F2 and backcross generations under iron toxicity and control condition are presented in Table 2. Both parents showed contrasting performance under different environment except for, tiller number in Cross 1 and 100-grain weight in Cross 2 both in control condition. The F1 of both crosses had mean value between the superior and lower parents in all environments, except for grain yield, which presented the heterobeltiosis in this generation. The mean value of F2 were also between the parents but lower than that of the F1 in all experiment and crosses. In general, mean of BC to superior parent were greater than the mean of BC to the lower parent and F1 in all the crosses and environments. The transgressive segregations from the mean value were observed in the population of F2, BC1P1 and BC2P2, indicating a contrasting used parent in the crosses.
The cross population of Inpara5 x Pokkali had high STI index in most of characters in all generation compared to cross population of Inpara5 x Mahsuri, except for number of grain. The highest STI in both of crosses (Table 2) was revealed in the 100-grain weight indicating that this characters less effected by iron toxicity conditions ranging from (0.91-1.00). Both of tolerant parents, Mahsuri and Pokkali displayed more adaptability to stress condition by performing higher STI compared to sensitive parent, Inpara5 in all characters. Meanwhile, the STI of F1 generation were between the two contrasting parents indicating the presence of mid-parent heterotic in all characters. Iron toxic stress condition showed more affected in most observed characters at the BC1P1 as well as its sensitive parent and vice-versa for the BC1P2 generation. Gene Action
Yudhistira Nugraha et al.: Implication of Gene Action and Heritability Under Stress and Control Conditions………
additive [d] and dominance [h] indicating partially dominant to the alleles that decreasing grain weight. For this cross, additive [d] gene effects were the most important factor (p<0.001) contributing to the genetic control, while dominance (h] gene effects were also significant but smaller in magnitude.
For the other characters in different
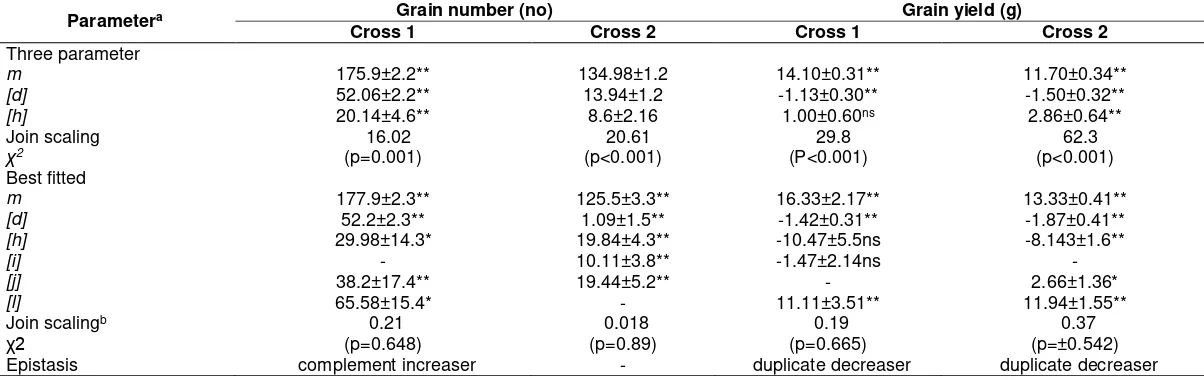
crosses and environment, the significant χ2 obtained from the joint-scaling tests suggested that the three-parameter model was not adequate in explaining the variability present and thus other more complex models were necessary to accommodate the presence of epistasis. These characters best fitted to five parameters model involving mixed epistasis interaction of additive x additive [i], additive x dominance [j], dominance x dominance [l], in addition to additive [i] and dominance [i] components but these were depending on the crosses and environments (Table 3 and Table 4).
For the number of grain and grain yield of Cross 1 and Cross 2, and 100-grain of Cross 2 under iron toxicity condition the best-fit model were epistasis interaction additive x dominance [j] and dominance x dominance [l], in addition to additive [i] and dominance [i] and the largest gene effect was to dominance x dominance. This type of interactive epistasis also presented in control condition for tiller number, grain yield of both Crosses and 100-grain weight, where its magnitude of gene effect were duplicate pointing towards the iron-sensitive parent. Tiller number of all cross under control condition and 100-grain weight of Cross 2 under all environment had best-fitted using five model parameters involving of additive x dominance [j], dominance x dominance [l], in addition to additive [i] and dominance [i]. The Cross 1 had positive magnitude in interactive of dominance x dominance [l] and opposite direction with dominance [d] indicating duplicate decreasers epistasis was present in the gene effect while in the Cross two was the interactive dominance x dominance [l] had same direction with dominance [d] indicating the gene effect was duplicate increasers. The complementary epistasis was found only in plant height under iron toxic condition (Table 3) and grain number of the Cross 1 under control condition (Table 4).
For all other traits, except for plant height of iron stress condition and grain number under
control condition, the interactive model dominance x dominance effects [l] were significant and had opposite sign to those of dominance effects alone [h], indicating the presence of a duplicate type of epistasis. This type of epistasis and higher magnitudes of [h] and [l] in the population has implication in reducing the efficiency of selection. Under this condition the selection would be effective after late generations once a high level of gene fixation is attained for the traits showing significant gene interactions. Signs associated with different estimates of epistasis indicate the direction in which gene effects influence the population mean. Kearsey & Pooni (1996) proposed the association or dispersion of genes in the parents based on signs of dominance [h] and interactive gene effects of dominance x dominance [l]. In this present study, the signs of [h] in most of traits were negative both in Fe toxicity and control which suggested that a large influence of the recessive parent. Such dispersion with more recessive genes compared to dominant genes has been observed in three from six crosses of spring wheat under manganese toxicity condition (Moroni, Briggs, Blenis, & Taylor, 2013). For the other characters presented of interactive effect of [i], [j] and [l] resulting an epistasis gene of duplicate and complementary (Table 3 and Table 4). The type of epistasis depending on the cross, environment and sometime resulting interaction between both of them (Cao et al., 2001). This gene action complexity indicated that improvement of the characters studied would be moderately difficulty as compared to the situation pertaining had an additive-dominance model (best from a breeders point of view) provided the best fit. This situation is even more complicated when dominance effects are more important than additive effects, as was the case rice, a self-pollinated crop in this experiment.
Yudhistira Nugraha et al.: Implication of Gene Action and Heritability Under Stress and Control Conditions………
Table 2. Mean, deviation and stress tolerance index (STI) per plant of population P1, P2, F1, F2, BC1P1 and BC1P2 of rice seedling of Inpara5 x Mahsuri (Cross 1) and Inpara5 x Pokkali (Cross 2) under iron toxicity and control condition
Population
Plant height (cm)
(Mean SD)
STI
Tiller number (no)
(Mean SD) STI
100-GW (g)
(Mean SD) STI
C S C S C S
Cross 1
P1 101.1±4.4 66.9±6.9 0.62 16.2±3.5 7.1±3.0 0.44 2.4±0.14 2.2±0.14 0.92
P2 140.4±4.9 105.5±7.8 0.75 14.6±2.6 12.9±2.2 0.86 1.6±0.02 1.6±0.09 1.00
F1 138.9±4.4 102.3±6.4 0.74 20.7±2.9 12.9±2.6 0.60 2.3±0.05 2.1±0.10 0.91
F2 129.2±13.4 92.9±18.2 0.63 15.4±4.9 8.4±4.4 0.56 2.2±0.24 2.1±0.23 1.00
BCP1 119.3±10.2 83.4±11.1 0.67 17.1±5.2 8.9±3.8 0.52 2.3±0.22 2.2±0.21 0.91
BCP2 139.9±8.8 101.3±17.9 0.68 14.4±3.8 10.7±4.1 0.71 1.9±0.22 1.9±0.20 1.00
Cross 2
P1 104.0±6.5 68.1±9.3 0.65 14.8±2.3 6.8±1.8 0.49 2.4±0.08 2.3±0.11 0.96
P2 140.4±6.1 126.8±9.3 0.90 10.0±2.1 10.6±2.6 0.96 3.0±0.09 3.0±0.16 1.00
F1 136.6±7.1 119.6±7.1 0.88 13.8±1.6 10.5±3.0 0.77 3.0±0.17 2.9±0.12 1.00
F2 129.2±14.2 109.1±21.1 0.84 11.0±3.4 8.8±4.1 0.88 2.6±0.26 2.5±0.24 0.96
BCP1 120.7±12.1 100.1±19.7 0.83 10.3±2.7 6.2±3.4 0.62 2.6±0.23 2.5±0.22 0.96
BCP2 136.7±9.3 127.0±17.0 0.93 11.3±2.9 8.2±4.0 0.75 2.7±0.19 2.7±0.19 1.00
Table 2. (continued)
Population
Grain number (no)
(Mean SD) STI
Grain yield (g)
(Mean SD) STI
C S C S
Cross 1
P1 125.7 ±16.1 56.1±23.7 0.45 15.5±2.3 4.5 ±2.0 0.29
P2 230.1±11.1 192.2±28.9 0.83 12.4±2.0 10.0±2.2 0.82
F1 204.5±19.1 173.1±29.1 0.85 16.4±2.4 12.6±2.9 0.75
F2 178.3±38.6 122.3±57.4 0.69 13.9±3.9 8.0±4.3 0.62
BCP1 159.7±28.2 109.5±51.2 0.57 14.1±3.4 6.9±3.6 0.49
BCP2 191.5±33.1 146.8±46.9 0.92 13.0±4.0 9.2±4.1 0.70
Cross 2
P1 124.5±8.3 52.3±12.5 0.42 15.2±2.7 4.60±2.0 0.31
P2 146.7±10.7 105.4±17.9 0.72 11.8±2.6 10.4±2.5 0.91
F1 145.5±6.9 94.8±16.4 0.65 17.1±2.3 11.0±2.4 0.65
F2 135.4±25.9 67.4±25±4 0.50 12.3±3.5 7.2±3.5 0.60
BCP1 127.8±15.8 59.4±23.2 0.40 12.6±3.1 6.2±3.5 0.52
BCP2 148.5±9.8 76.4±23.4 0.60 12.1±3.1 7.6±3.4 0.62
Remarks: N= control condition; S= stress condition; STI= stress tolerance index; ± = standard deviation of means
287
Yudhis
tira
N
ugraha
e
t al
.:
Im
plic
a
tion
o
f Gene
A
c
tio
n
and
H
eri
tabilit
y
U
nder
S
tres
s
and
C
on
trol
C
ondit
ions
Yudhistira Nugraha et al.: Implication of Gene Action and Heritability Under Stress and Control Conditions………
Parametera Plant height (cm) Tiller number (no) 100-grain weight (g)
Cross 1 Cross 2 Cross 1 Cross 2 Cross 1 Cross 2
Epistasis complement increaser - duplicate increaser duplicate decreaser - duplicate decreaser
Table 3. (continued)
Parametera Grain number (no) Grain yield (g)
Cross 1 Cross 2 Cross 1 Cross 2
Three parameter Epistasis duplicate decreaser duplicate decreaser duplicate decreaser duplicate decreaser
Remarks: a Mean m, additive [d], dominance [h], additive x additive [i], additive x dominance [j], dominance x dominance [l],
bχ2 test with 1 df for the 5 parameters model, *, and ** significantly different t-test from zero at 0.05, and 0,01, respectively, NS, non- significant,
±, standard deviation of means
Yudhistira Nugraha et al.: Implication of Gene Action and Heritability Under Stress and Control Conditions………
Parametera Plant height (cm) Tiller Number (no) 100-grain weight (g)
Cross 1 Cross 2 Cross 1 Cross 2 Cross 1 Cross 2
Three parameter
m 120.65±0.69** 121.86±0.91** 14.34±0.43** 11.05±0.29** 2.02±0.01** 2.69±0.01**
[d] 19.75±0.69** 17.43±0.87** 1.26±0.42** -1.94±0.28** -0.42±0.01** 0.27±0.01**
[h] 18.02±1.18** 13.98±1.77** 4.17±0.76** 1.30±0.51* 0.28±0.02** 0.04±0.03ns
Join scaling χ2
NS NS 34.6
(P<0.001)
53.1 (p<0.001)
NS 96.5
(p<0.001) Best fitted
m - - 15.40±0.48** 12.42±0.35** - 2.73±0.01**
[d] - - 0.80±0.48ns -2.42±0.35** - 0.30±0.01**
[h] - - -4.63±2.10* -7.68±1.36** - -0.58±0.08**
[i] - - - -
[j] - - 3.54±2.03ns 2.72±1.19* - -0.36±0.08**
[l] - - 9.98±2.11** 9.06±1.28** - 0.83±0.10**
Join scalingb
χ2 - - (p=0.647) 0.21
0.19 (P=0.663)
- 0.96
(p=0.321)
Epistasis - - duplicate decreaser duplicate decreaser - duplicate decreaser
Table 4. (continued)
Parametera Grain number (no) Grain yield (g)
Cross 1 Cross 2 Cross 1 Cross 2
Three parameter
m 175.9±2.2** 134.98±1.2 14.10±0.31** 11.70±0.34**
[d] 52.06±2.2** 13.94±1.2 -1.13±0.30** -1.50±0.32**
[h] 20.14±4.6** 8.6±2.16 1.00±0.60ns 2.86±0.64**
Join scaling χ2
16.02 (p=0.001)
20.61 (p<0.001)
29.8 (P<0.001)
62.3 (p<0.001) Best fitted
m 177.9±2.3** 125.5±3.3** 16.33±2.17** 13.33±0.41**
[d] 52.2±2.3** 1.09±1.5** -1.42±0.31** -1.87±0.41**
[h] 29.98±14.3* 19.84±4.3** -10.47±5.5ns -8.143±1.6**
[i] - 10.11±3.8** -1.47±2.14ns -
[j] 38.2±17.4** 19.44±5.2** - 2.66±1.36*
[l] 65.58±15.4* - 11.11±3.51** 11.94±1.55**
Join scalingb
χ2 (p=0.648) 0.21
0.018 (p=0.89)
0.19 (p=0.665)
0.37 (p=±0.542)
Epistasis complement increaser - duplicate decreaser duplicate decreaser
Remarks: a Mean m, additive [d], dominance [h], additive x additive [i], additive x dominance [j], dominance x dominance [l],
bχ2 test with 1 df for the 5 parameters model, *, and ** significantly different t-test from zero at 0.05, and 0,01, respectively, NS, non- significant,
±, standard deviation of means
Tabel 4. Joint scaling test with three parameter model (m, [d], [h]) and estimates of the components of the six generation means of fitted to a six parameter model of rice population from the cross of Inpara5 x Mahsuri (Cross 1) and Inpara 5 x Pokkali (Cross 2) under control condition in the field
289
Yudhis
tira
N
ugraha
et
al
.:
Im
pli
c
at
ion
of
Gene
Ac
tio
n
and
H
eri
tabilit
y
U
nder
St
re
s
s
and
C
on
trol
C
ondit
ions
……….
Yudhistira Nugraha et al.: Implication of Gene Action and Heritability Under Stress and Control Conditions………
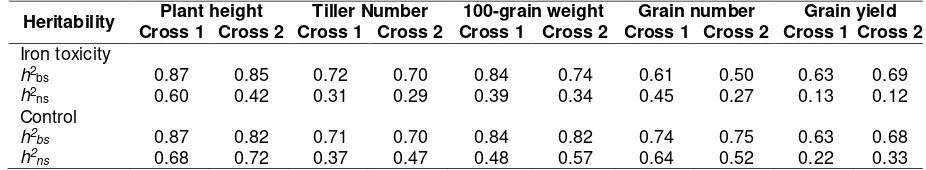
Heritability
Broad-sense heritability (h2bs) and narrow-sense heritability (h2
ns) of two crosses under control and iron toxicity condition are shown in Table 5. Most of characters in the two crosses had similar for board-sense heritability under iron toxicity and control condition ranging from 0.68 to 0.87. The Cross 1 showed slightly higher of h2bs compared to Cross 2, except for the grain yield. For the narrow-sense heritability under iron toxicity condition was lower (3% to 23%) compared to control condition indicating the environment influenced on the genetic variance of the parents and their offspring. Lower heritability under stresses condition was also reported in most of characters in soy bean in acidic soil (Kuswantoro, Basuki, & Arsyad, 2011) and wheat in drought condition (Said, 2014). This phenomenon indicted that the variation of stressed site was larger compared to the control condition. Iron concentration in the soil solution can be vary in same topo-sequence because of difference of soil profile, other nutrient availability, and reduced microbial activity (Becker & Asch, 2005).
The difference of soil conditions of the two plots, probably contributed to lower value of estimated of broad-sense heritability and narrow-sense heritability in the iron-stress condition compared to normal condition. Meanwhile, the narrow-sense heritability had lower compared to broad sense heritability in both conditions. This was caused by lower proportion of heritable variance (additive variance) compared to total genetics variance, which could be explained also by a complex gene action in the in heritance of most of characters. The broad-sense heritability measures the proportion of genetics variance to total
phenotypic variance, while narrow-sense heritability measures the proportion additive variance (heritable variance) to total genetic variance (Fehr, 1987).
This research also described the relation-ship of stress index and heritability, where the less affected to stress in particular characters the higher the estimates of heritability. An example was found in 100-grain weight of the Cross 1, which the STI was near to 1 and the h2bs 84%. This relation also related to its gene action, which simple additive-dominant model was fit for explaining the mode of inheritance (Table 3 and Table 4). The grain weight is related to consumer preference involving dimension and shape of the grain. Since the inheritance relatively simple to get desirable grain weight the selection can be done whether under control or iron toxic condition. The simple gene effect and high heritability in grain weight was also reported in genetic study in rice for blast resistant (Divya et al., 2014) and salinity tolerance (Mohammadi, Mendioro, Diaz, Gregorio, & Singh, 2014).
Correlation among Characters of F2 Population Relationship of leaf bronzing Score (LBS), plant height, tiller number, 100-grain weight were estimated in the F2 population under iron toxicity stress and control. Variation of LBS was only found under toxicity condition. We included this character in correlation analysis but not in the previous genetics parameters analysis because it does not meet requirement the control distribution data. LBS was highly negative correlated grain yield, 100-grain weight, plant height in Cross 2, while the Cross 1 only in the grain yield.
Table 5. Heritability estimates for some characters under iron toxicity site and control in two crosses
Heritability Plant height Tiller Number 100-grain weight Grain number Grain yield
Cross 1 Cross 2 Cross 1 Cross 2 Cross 1 Cross 2 Cross 1 Cross 2 Cross 1 Cross 2 Iron toxicity
h2bs 0.87 0.85 0.72 0.70 0.84 0.74 0.61 0.50 0.63 0.69
h2ns 0.60 0.42 0.31 0.29 0.39 0.34 0.45 0.27 0.13 0.12 Control
h2bs 0.87 0.82 0.71 0.70 0.84 0.82 0.74 0.75 0.63 0.68
h2ns 0.68 0.72 0.37 0.47 0.48 0.57 0.64 0.52 0.22 0.33
Yudhistira Nugraha et al.: Implication of Gene Action and Heritability Under Stress and Control Conditions………
Table 6. Simple correlation among characters in F2 individuals under iron toxicity and control condition in two crosses
Characters Iron Toxicity Control
LB PH TN HG GN GY PH TN HG GN GY
LB 1.00 -0.26** -0.04 -0.36** -0.25** -0.24** - - - - -
PH -0.10 1.00 0.17 0.55** 0.88** 0.34** 1.00 0.15 0.52** 0.17 0.05
TN -0.06 0.16 1.00 -0.02 -0.13 0.53** 0.15 1.00 -0.02 0.30** 0.05
HG -0.09 -0.41** 0.08 1.00 0.60** 0.36** -0.17 -0.11 1.00 0.04 -0.09
GN -0.29 0.11 0.20* -0.36** 1.00 0.17 0.67 -0.19 -0.48** 1.00 -0.01
GY -0.27** 0.08 0.32** -0.41** 0.89** 1.00 0.31** 0.84** -0.01 0.16 1.00
Remarks: LB= Leaf Bronzing Score, PH= plant height, TN= tiller number, HG= 100-grain weight, GY= grain yield; The r coefficient above the horizontal is Cross of Inpara5 x Pokkali and r coefficient under the horizontal is Cross of Inpara5 x Mahsuri; * and ** are significant of t-test at 0.05 and 0.01, respectively
The grain yield was correlated positively in all characters in the Cross2 except for grain number, while in the Cross 1 was correlated only with the plant height and grain number under toxicity condition (Table 6). Meanwhile under control condition, the positive correlation of grain yield was found only in the Cross 1 with plant height and tiller number. A significant positive correlation of plant height with 100-grain weight was found in Cross 1 both under iron toxicity (r=0.55**) and control (r=0.52**) condition, while for the Cross 2 was found in different direction (iron toxicity =-0.44**, control=-0.17). The grain number of Cross 1 correlated negatively with 100-grain weight both under iron toxicity and control condition.
Implication for Selection Iron Toxicity Tolerant in Rice
Improvement grain yield in iron toxicity affected area needs effective and efficient breeding methods. In this study revealed that the estimated heritability indicated under control conditions had greatest genetics improvement compared to iron-stress condition. Meanwhile, under both stress and control sites showed that the Cross 1 had the greatest chance of genetic improvement in all characters observed under iron-toxic condition, while the Cross 2 had the greatest chance under control condition. This result suggested that successful of breeding program could be under the influence of environment, stressing the importance of the appropriate selection breeding site, wheater it was under stress or control conditions.
The parents that were used in this study had some characteristics not only related to Fe toxicity tolerance but also the other important traits, for example Pokkali was reported tolerance
to salinity (Gregorio et al., 2002), Mahsuri is a Malaysian traditional variety that reported small with high-density grain (Suhartini & Makarim 2009). Meanwhile, the sensitive parent, Inpara5 is semi-dwarf plant type that inserting a submergence tolerance gene, SUB1 (Septiningsih et al., 2015). The aim of this cross is to combine those important traits as well as iron toxicity tolerant into the agronomical farmer accepted plant type like Inpara5. Hence, based on those characteristic of the parents, combining Fe toxicity tolerance with other important traits can be done concurrently, resulting a multi-tolerance stress rice variety.
Yudhistira Nugraha et al.: Implication of Gene Action and Heritability Under Stress and Control Conditions………
favor gene for good agronomy performance, yield components and grain yield. Thus, this selection can be done in normal condition. Meanwhile, under iron toxic-location or other stressed location can be done for selection of the tolerant-stress progenies.
This study also reported some characters that related to degree of tolerance under iron toxicity condition. The scoring method using visualization of leaf bronzing has been developed by IRRI using standard evaluation system for rice (IRRI, 1996) to score the degree of tolerance and used in the breeding program. It has been reported that under field condition each visual symptom score increase was associated with a yield loss of approximately 400 kg ha−1 (Audebert & Fofana, 2009). Thus, it was considered that leaf bronzing score (LBS) as a relevant trait for the screening of tolerance to Fe toxic conditions as described significant correlation between LBS and grain yield in this study (Table 6). However, the genetics analysis needs quantitative data that could not fulfilled by LBS. Hence, the other characters that might had relationship with the tolerance is needed. It was found that tiller number, number grains for the Cross 1, while for the Cross 2, plant height, tiller number, 100-grain weight could be used as a selection criteria for both of grain yield and LBS in the two crosses under iron toxicity condition.
The linked DNA markers selection can be used to select the rare recombinants and combined the favorable alleles. However, some QTLs studies for Fe toxicity tolerance have been reported low association with phenotypical traits, indicating that challenges to localize the marker with several hundred genes involved making difficult for application in breeding program (Dufey et al., 2015). The present data, apart from being a starting point for further investigation of the genetic control of tolerance to iron toxicity in rice, could be useful for the development of an effective breeding program that might develop tolerant varieties. This research also supports the breeder in the screening of rice to iron toxicity in the field before genetic dissection of QTLs on iron toxicity tolerance could be applied in the development of marker-assisted selection breeding.
CONCLUSION
The experiment of genetics study for some agronomy characters and grain yield under iron toxicity condition and control condition identified
tolerant parents, Mahsuri and Pokkali displaying high value of STI compared to sensitive parent, Inpara5 in all characters. The mid-parent heterotics in F1 STI were also found in all characters. The STI of F2 generation was between the two parents; while the STI value of the back crosses generation (BC1P1 and BC1P2) followed the direction of their recurrent parent.
The grain yield and others agronomical characters were not fitted to simple model of additive-dominance, indicating the presence of allelic interaction. Further analysis revealed that the five parameter models with epistasis duplicate and complementary gene action were fitted to explain the gene action model. The direction of most characters toward decreasers with high interactive of dominant x dominant. The estimates
heritability’s under control condition were higher compared to iron toxicity condition. Meanwhile, under both sites show that the Cross 1 had the greatest chance of genetic improvement in all characters observed under iron toxicity condition, while the Cross 2 had the greatest chance under normal condition. This result suggests that the successful of breeding program is influenced by the appropriate selection of the parents and selection environment. Delaying the selection to later generations by maintaining larger populations combined with the shuttle breeding selection in normal condition for accepted-agronomical traits could be proposed as the best breeding strategy for improving yield and tolerance to iron toxicity.
ACKNOWLEDGEMENT
The authors deeply acknowledge to Dr. Nafisah, Ms. Trias Sitaresmi and Mr. Subardi for technical help. This study was supported by a grant from the Indonesian Budget Implementation (DIPA) of Indonesian Agency for Agricultural Research and Development 2013/2014.
REFERENCES
Audebert, A., & Fofana, M. (2009). Rice yield gap due to iron toxicity in West Africa. Journal of Agronomy and Crop Science, 195(1), 66–76. http://doi.org/10.1111/j.1439-037 X.2008.00339.x
Audebert, A., & Sahrawat, K. L. (2000). Me-chanisms for iron toxicity tolerance in lowland rice. Journal of Plant Nutrition, 23(11-12), 1877–1885. http://doi.org/10. 1080/01904160009382150
Yudhistira Nugraha et al.: Implication of Gene Action and Heritability Under Stress and Control Conditions………
- Conditions and management concepts. Journal of Plant Nutrition and Soil Science, 168(4), 558-573. http://doi.org/ 10.1002/jpln.200520504
Cao, G., Zhu, J., He, C., Gao, Y., Yan, J., & Wu, P. (2001). Impact of epistasis and QTL × environment interaction on the developmental behavior of plant height in rice (Oryza sativa L.). Theoretical and Applied Genetics, 103(1), 153–160. http: //doi.org/10.1007/s001220100536 Cavalli, L. L. (1952). An analysis of linkage in
quantitative inheritance. In E. C. R. Reeve & C. H. Waddington (Eds.), Quan-titative inheritance (pp. 135-144). London: HMSO.
Divya, B., Biswas, A., Robin, S., Rabindran, R., & Joel, A. J. (2014). Gene interactions and genetics of blast resistance and yield attributes in rice (Oryza sativa L.). Journal of Genetics, 93(2), 415–424. http://doi. org/10.1007/s12041-014-0395-7
Dobermann, A. & Fairhurst, T. H. (2000). Rice: Nutrient disorders & nutrient management. Singapore: Potash & Phosphate Institute. Dufey, I., Draye, X., Lutts, S., Lorieux, M.,
Martinez, C. & Bertin, P. (2015). Novel QTLs in an interspecific backcross Oryza sativa × Oryza glaberrima for resistance to iron toxicity in rice. Euphytica, 204(3), 609-625. http://doi.org/10.1007/s10681014- 1342-7
Dufey, I., Hakizimana, P., Draye, X., Lutts, S., & Bertin, P. (2009). QTL mapping for biomass and physiological parameters linked to resistance mechanisms to ferrous iron toxicity in rice. Euphytica, 167(2), 143–160. http://doi.org/10.1007/ s10681-008-9870-7
Engel, K., Asch, F., & Becker, M. (2012). Classification of rice genotypes based on their mechanisms of adaptation to iron toxicity. Journal of Plant Nutrition and Soil Science, 175(6), 871–881. http://doi.org/ 10.1002/jpln.201100421
Fageria, N. K., Santos, A. B., Barbosa Filho, M. P., & Guimarães, C. M. (2008). Iron toxicity in lowland rice. Journal of Plant Nutrition, 31(9), 1676-1697. http://doi.org/ 10.1080/01904160802244902
Fehr, W. R. (1987). Principles of cultivar develop-ment, vol. 1: Theory and technique. New York: McGraw-Hill.
Gregorio, G. B., Senadhira, D., Mendoza, R. D., Manigbas, N. L., Roxas, J. P., & Guerta, C. Q. (2002). Progress in breeding for salinity tolerance and associated abiotic stresses in rice. Field Crops Research, 76(2-3), 91–101. http://doi.org/10.1016/ S0378-4290(02)00031-X
IRRI. (1996). Standard evaluation system for rice (4th ed.). Manila: International Rice Research Institute.
Ismunadji, M. (1990). Alleviating iron toxicity in lowland rice. Indonesian Agricultural Research and Development Journal, 12(4), 67-72. Retrieved from https:// www.cabdirect.org/?target=%2fcabdirect %2fabstract%2f19926783506
Kearsey, M. J. & Pooni, H. S. (1996). The genetical analysis of quantitative traits. London: Chapman & Hall.
Kuswantoro, H., Basuki, N., & Arsyad, D. M. (2011). Inheritance of soybean pod number trait on acid soil. AGRIVITA Journal of Agricultural Science, 33(2), 119–126. Retrieved from http://www. agrivita.ub.ac.id/index.php/agrivita/article /view/53/56
Li, Z. K., Luo, L. J., Mei, H. W., Wang, D. L., Shu,
Q. Y., Tabien, R., … Paterson, A. H.
(2001). Overdominant epistatic loci are the primary genetic basis of inbreeding depression and heterosis in rice. I. Biomass and grain yield. Genetics, 158(4), 1737–1753. http://doi.org/10.11 26/science.32.827.627
Mather, K. & Jinks, J. L. (1982). Biometrical genetics: The study of continuous variation (3rd ed.). London: Chapman and Hall. Matiello, R. R., Brunelli, K. R., Lopes, M. T. G.,
Morello, R. M. S. C., Silva, H. P. da, & Camargo, L. E. A. (2012). Inheritance of resistance to anthracnose stalk rot (Colletotrichum graminicola) in tropical maize inbred lines. Crop Breeding and Applied Biotechnology, 12(3), 179–184. http://doi.org/10.1590/S1984-70332012 000300003
Yudhistira Nugraha et al.: Implication of Gene Action and Heritability Under Stress and Control Conditions………
Moroni, J. S., Briggs, K. G., Blenis, P. V. & Taylor, G. J. (2013). Generation mean analysis of spring wheat (Triticum aestivum L.) seedlings tolerant to high levels of manganese. Euphytica, 189(1), 89-100. http://doi.org/10.1007/s10681-012-0714-0 Muhrizal, S., Shamshuddin, J., Fauziah, I., & Husni, M. A. H. (2006). Changes in iron-poor acid sulfate soil upon submergence. Geoderma, 131(1-2), 110–122. http://doi. org/10.1016/j.geoderma.2005.03.006 Onaga, G., Egdane, J., Edema, R., & Abdelbagi,
I. (2013). Morphological and genetic diversity analysis of rice accessions (Oryza sativa L .) differing in iron toxicity tolerance. Journal Crop Science Biotechnology, 16(1), 53–62. http://doi. org/10.1007/s12892-012-0104-0
Pereira, E. G., Oliva, M. A., Rosado-Souza, L., Mendes, G. C., Colares, D. S., Stopato, C. H., & Almeida, A. M. (2013). Iron excess affects rice photosynthesis through stomatal and non-stomatal limitations. Plant Science, 201-202(1), 81–92. http:// doi.org/10.1016/j.plantsci.2012.12.003 Prasetyo, B. H., & Suriadikarta, D. A. (2006).
Karakteristik, potensi, dan teknologi pengelolaan tanah ultisol untuk pengembangan pertanian lahan kering di Indonesia [Characteristics, potential, and management of ultisols for agricultural upland development in Indonesia]. Jurnal Litbang Pertanian, 25(2), 39–47. Retrieved from http://pustaka.litbang. deptan.go.id/publikasi/p3252061.pdf Reynolds, M. P., Trethowan, R. M., van Ginkel,
M. & Rajaram, S. (2001). Application of physiology in wheat breeding. In M. P. Reynolds, J. I. Ortiz-Monasterio & A. McNab (Eds.), Application of Physiology in Wheat Breeding (pp. 2-10). Mexico: CIMMYT.
Said, A. A. (2014). Generation mean analysis in wheat (Triticum aestivum L.) under drought stress conditions. Annals of Agricultural Sciences, 59(2), 177–184. http://doi.org/10.1016/j.aoas.2014.11.003 Samineni, S., Gaur, P. M., Colmer, T.,
Krishnamurthy, L., Vadez, V., & Siddique,
K. (2011). Estimation of genetic com-ponents of variation for salt tolerance in chickpea using the generation mean analysis. Euphytica, 182, 73-86. http:// doi.org/10.1007/s10681-011-0496-9 SAS Institute. (2004). SAS/STAT 9.1 user’s
guide. Retrieved from https://support. sas.com/documentation/onlinedoc/91pdf /sasdoc_91/stat_ug_7313.pdf
Septiningsih, E. M., Hidayatun, N., Sanchez, D. L., Nugraha, Y., Carandang, J.,
Pamplona, A. M., … Mackill, D. J. (2014).
Accelerating the development of new submergence tolerant rice varieties: The case of Ciherang-Sub1 and PSB Rc18-Sub1. Euphytica, 202(2), 259–268. http:// doi.org/10.1007/s10681-014-1287-x Shashikumar, K. T., Pitchaimuthu, M., & Rawal,
R. D. (2010). Generation mean analysis of resistance to downy mildew in adult muskmelon plants. Euphytica, 173(1), 121–127. http://doi.org/10.1007/s10681-010-0132-0
Shimizu, A. (2009). QTL analysis of genetic tolerance to iron toxicity in rice (Oryza Sativa L.) by quantification of bronzing score. Journal of New Seeds, 10(3), 171-179. http://doi.org/10.1080/15228860903 064989
Statistics Indonesia. (2015). Harvested area, yield rate and production of food crops by province (dynamic) [Data file]. Retrieved from https://www.bps.go.id/Subjek/view/ id/53#subjekViewTab3-
Stein, R. J., Lopes, S. I. G., & Fett, J. P. (2014). Iron toxicity in field-cultivated rice: Contrasting tolerance mechanisms in distinct cultivars. Theoretical and Experimental Plant Physiology, 26(2), 135–146. http://doi.org/10.1007/s40626-014-0013-3
Yudhistira Nugraha et al.: Implication of Gene Action and Heritability Under Stress and Control Conditions………
Utami, D. W., & Hanarida, I. (2014). Evaluasi lapang dan identifikasi molekuler plasma nutfah padi terhadap keracunan Fe [Field evaluation and molecular identification of rice germplasms for Fe toxicity]. Jurnal AgroBiogen, 10(1), 9–17. Retrieved from http://biogen.litbang.pertanian.go.id/terbi tan/pdf/Jurnal Agrobiogen 10-1/Dwinita W Utami.pdf
Wade, L. J., Fukai, S., Samson, B. K., Ali, A., & Mazid, M. A. (1999). Rainfed lowland rice: Physical environment and cultivar requirements. Field Crops Research, 64(1-2), 3–12. http://doi.org/10.1016/ S0378-4290(99)00047-7
Wan, J., Zhai, H., Wan, J., & Ikehashi, H. (2003). Detection and analysis of QTLs for ferrous iron toxicity tolerance in rice, Oryza sativa L. Genome Research, 131(2), 201–206. http://doi.org/10.1023/ A:1023915710103
Weber, K. A., Achenbach, L. A., & Coates, J. D. (2006). Microorganisms pumping iron: Anaerobic microbial iron oxidation and reduction. Nature Reviews. Microbiology, 4(10), 752–764. http://doi.org/10.1038/ nrmicro1490
Wu, L. B., Shhadi, M. Y., Gregorio, G., Matthus, E., Becker, M., & Frei, M. (2014). Genetic and physiological analysis of tolerance to acute iron toxicity in rice. Rice (New York, N.Y.), 7(8), 1–12. http://doi.org/10.1186/ s12284-014-0008-3
![Table 3. Joint scaling test with three parameter model (m, [d], [h]) and estimates of the components of the six generation means of fitted to Yudhistira Nugraha ……………a six parameter model of rice population from the cross of Inpara5 x Mahsuri (Cross 1) and toxicity condition in the fieldet al.: Implication of Gene Action and Heritability Under Stress and Control Conditions Inpara 5 x Pokkali (Cross 2) under iron](https://thumb-ap.123doks.com/thumbv2/123dok/2828270.1690286/7.842.110.722.101.293/components-generation-yudhistira-population-condition-implication-heritability-conditions.webp)