Jurnal Bina Praja 9 (1) (2017): 83-99
Jurnal Bina Praja
e-ISSN: 2503-3360 p-ISSN: 2085-4323
http://binaprajajournal.com
Empirical Study of Critical Success Factors
for E-Government Implementation in Indonesia
Based on Factor Analysis Approach
Darmawan Napitupulu
*Research Center of Quality System and Testing Technology Indonesian Institute of Sciences
Gedung 417, Jl. Kw. Puspiptek, Muncul, Setu, Kota Tangerang Selatan, Banten 15314, Indonesia
Received: 2 February 2017; Accepted: 17 April 2017; Published online: 31 May 2017
DOI: 10.21787/jbp.09.2017.83-99
Abstract
Many people assume that e-Government is merely a technological problem while in fact non-technological factors
also influence it, even tend to be more dominant. Without a comprehensive evaluation covering non-technological as -pects, e-Government implementation will fail. This study aims to determine the various factors that affect the implemen-tation of e-Government. The research method used is a survey of several government agencies and the data is analyzed
by a quantitative approach, namely factor analysis to confirm success factors that have been obtained in previous syn -thesis studies (Napitupulu, 2014). The results of the empirical statistical research indicate there are 39 valid and reliable success factors, both technological and non-technological factors in e-Government implementation. Furthermore, these
success factors can be classified into four components, namely resource components, levers, values, and impacts. It is
expected that all the success factors that have been proven empirically can be accommodated by government agencies, especially in the district/city level to support the successful implementation of e-Government in Indonesia.
Keywords: E-Government, Success Factors, Empirical, Factor Analysis, Quantitative
I. Introduction
E-government is a governance that uses information and telecommunication technology to improve government performance, as well as to fulfill the public need for transparency and accountability of government financial information with the aim of achieving good governance.
Two main features that must be found in the e-Government system are availability and accessibility. First, e-Government services and transactions must be available 24 hours a day, 7 days a week (non-stop). Users are free to choose where and from which they wish to connect with the government to conduct various transactions or interaction mechanisms. It also enables communities and businesses to be flexible in accessing services outside government hours. Second, e-Government is very dependent on the accessibility of services available on the website. If the service is inaccessible,
then it can be said e-Government is unsuccessful or will experience failure (Sami & Mohd, 2012).
governments to face challenges in this information age (OECD, 2003; UNDP-APDIP, 2003).
The benefits of e-Government by Kumar et al. (2007) are:
• A better public service to the public where information can be provided 24 hours a day 7 days a week and information can be obtained from various channels (Portal, Email, etc.) without having to be physically present at government offices
• Improved relationships between government, business, and general public
• Community empowerment through easily accessible information
• More efficient government implementation where coordination between government agencies can be done easily through various channels.
Many people assume that e-Government is just a technology problem, meaning that the paradigm in the field is that to understand the implementation of e-Government only limited to creating websites. Even the existing websites are far from informative media (Napitupulu, 2015). Even worse, by installing a computer, it is already called e-Government. While in fact there are many plans and processes that need to be done. Due to the errors of the paradigm, it makes the implementation of e-Government, especially in Indonesia, fails (Supangkat & Negara, 2006).
Based on Heeks (2006) research, most e-Government projects, especially in developing countries, experienced a failure rate of up to 85%, while success rate only reached 15%. Failure is classified as a partial failure, which reaches 50% and total failure, which reaches 35%. What referred to as the total failure is if the e-Government project is never implemented or already implemented but suddenly canceled; While the partial failure is the main objectives of the project are not achievable and/or there are many unsuitable results.
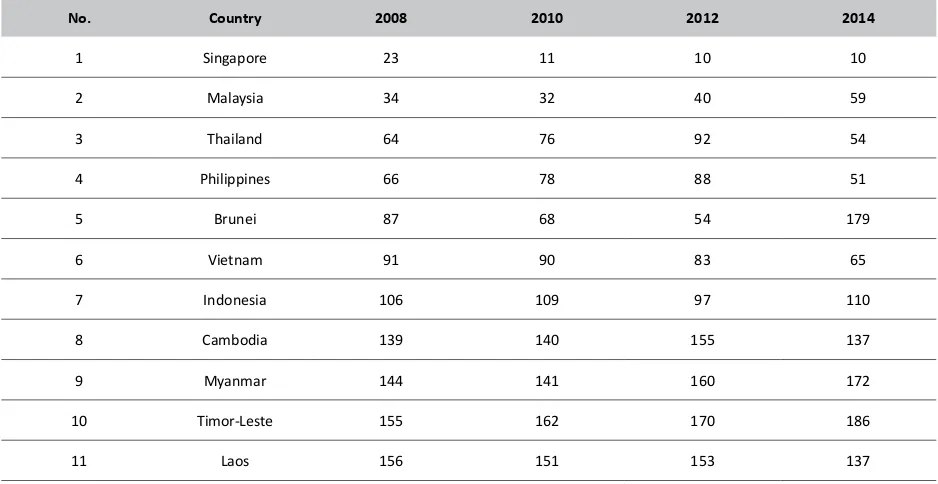
In addition, Gartner (2002) also stated that more than 60% of all e-Government initiatives fail or are far from desired expectations. Added to the 2003 survey by UNDESA (United Nations Department of Economics and Social Affairs) that the failure rate of e-Government project failures in developing countries is around 60-80%. Standish Group (2009) reported a decline in success rate; only 32% of ICT projects are said to be successful on time, on cost, and functional. Some 44% of projects have delays, over cost, and do not meet specified specifications and functions while 24% of projects fail and are never used. Based on e-Government readiness ranking of 2014, Indonesia is ranked 110th below Vietnam, Malaysia, Philippines, and Thailand (UNDESA, 2014) as shown in Table 1.
Survey results and e-Government ratings by West and UNDESA are not much different from that of Waseda University. Based on West (2006), a global e-Government survey shows Indonesia is in position 183 out of 208 countries. Accordingly, the
Table 1.
UNDESA E-Government Survey
No. Country 2008 2010 2012 2014
1 Singapore 23 11 10 10
2 Malaysia 34 32 40 59
3 Thailand 64 76 92 54
4 Philippines 66 78 88 51
5 Brunei 87 68 54 179
6 Vietnam 91 90 83 65
7 Indonesia 106 109 97 110
8 Cambodia 139 140 155 137
9 Myanmar 144 141 160 172
10 Timor-Leste 155 162 170 186
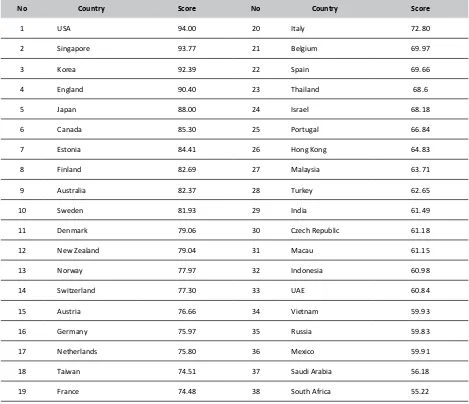
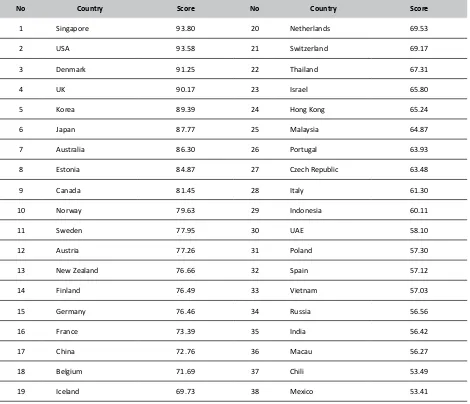
results of the survey in the form of e-Government world rankings by Waseda University respectively worldwide can be presented in Table 2 as follows: and 3 where Table 2 shows the results of the 2014 survey (Waseda, 2014), while Table 3 is the result of E-Government survey by Waseda University in 2015 (Waseda 2015).
Based on Table 2 on e-Government rankings, it can be seen that Indonesia is ranked 32 out of 61 countries that adopt e-Government system (Waseda, 2014). Indonesia is still lagging behind ASEAN colleagues such as Malaysia (27) and Thailand (23). The next survey and e-Government ranking by Waseda University 2015 in Table 3 shows Indonesia rising to 29th out of 63 countries (Waseda, 2015). However, Indonesia’s ranking is still below Malaysia (25) and Thailand (22). Meanwhile, the first rank e-Government also comes from members of ASEAN
countries namely Singapore which has been the 6th time in the first rank in a row since 1999.
If further examined, the speed of e-Government adoption varies between a country and another country where developing countries, including Indonesia, are far behind when compared to developed countries. Measuring the implementation of e-Government is also done at the national level by the Depkominfo through PeGI (The Ranking of e-Government in Indonesia) where its assessment for the provincial level shows unsatisfactory results in which nearly 50% of the total surveyed provinces are still included in the category less (PeGI, 2014). Based on the fact, the implementation of e-Government in Indonesia can be said not yet optimal as expected.
According to some literature, the source of the problem causing the failure of e-Government
Table 2.
Waseda University E-Government Ranking (2014)
No Country Score No Country Score
1 USA 94.00 20 Italy 72.80
2 Singapore 93.77 21 Belgium 69.97
3 Korea 92.39 22 Spain 69.66
4 England 90.40 23 Thailand 68.6
5 Japan 88.00 24 Israel 68.18
6 Canada 85.30 25 Portugal 66.84
7 Estonia 84.41 26 Hong Kong 64.83
8 Finland 82.69 27 Malaysia 63.71
9 Australia 82.37 28 Turkey 62.65
10 Sweden 81.93 29 India 61.49
11 Denmark 79.06 30 Czech Republic 61.18
12 New Zealand 79.04 31 Macau 61.15
13 Norway 77.97 32 Indonesia 60.98
14 Switzerland 77.30 33 UAE 60.84
15 Austria 76.66 34 Vietnam 59.93
16 Germany 75.97 35 Russia 59.83
17 Netherlands 75.80 36 Mexico 59.91
18 Taiwan 74.51 37 Saudi Arabia 56.18
implementation is not always related to technology (Kumorotomo, 2009; Prasojo, 2007; Heeks, 2003). Prasojo reports that 80% of the factors causing e-Government failures are non-ICT (Information and Communication Technology) elements and only 20% are actually caused by ICT factors. According to Heeks (2003), the gap between present reality and e-Government design is summarized as ITPOSMO (Information, Technology, Process, Objective & Values, Staffing & Skill, Management System and Other Resources: Time & Money) where the most dominant Is a non-ICT factor. A study conducted by Altameem (2006) also shows that non-technological aspects are more often the cause of e-Government failures than technological aspects.
By referring to the problems mentioned above, in this study the author aims to get a picture of the successful implementation of e-Government in
Indonesia, which is to conduct studies of CSF (Critical Success Factors) related to the implementation of e-Government. The study of success factors (CSF) is an important issue in the development of e-Government systems (Wood-Harper, 2004). The activity of digging the CFS in e-Government implementation will help e-Government projects succeed, avoiding the possibility of failure that can lead to unexpected consequences (Altameem et al., 2006). Along with that, Al-Shehry (2006) says that identification of CSFs will help a country in implementing e-Government to avoid failure.
A. Critical Success Factors (CSF)
Today’s Critical Success Factors (CFSs) approach is widely used by researchers and consultants in the field of information systems particularly in support of information systems
Table 3.
Waseda University E-Government Ranking (2015)
No Country Score No Country Score
1 Singapore 93.80 20 Netherlands 69.53
2 USA 93.58 21 Switzerland 69.17
3 Denmark 91.25 22 Thailand 67.31
4 UK 90.17 23 Israel 65.80
5 Korea 89.39 24 Hong Kong 65.24
6 Japan 87.77 25 Malaysia 64.87
7 Australia 86.30 26 Portugal 63.93
8 Estonia 84.87 27 Czech Republic 63.48
9 Canada 81.45 28 Italy 61.30
10 Norway 79.63 29 Indonesia 60.11
11 Sweden 77.95 30 UAE 58.10
12 Austria 77.26 31 Poland 57.30
13 New Zealand 76.66 32 Spain 57.12
14 Finland 76.49 33 Vietnam 57.03
15 Germany 76.46 34 Russia 56.56
16 France 73.39 35 India 56.42
17 China 72.76 36 Macau 56.27
18 Belgium 71.69 37 Chili 53.49
strategic planning (Esteves, 2004). Since the Rockard research in the 70s, at least over forty years of research on CSFs has been done and developed. CSFs are a limited number of areas where, if the outcome is satisfactory, will ensure a successful competitiveness for the organization (Amberg, 2005). According to Pinto, CSFs are factors that, when handled, will have a significant effect on the success of a project (Pinto, 1987). At a glance, these definitions are not much different from the concept of Key Success Factor (KSF). In some literature, the terms CSFs and KSF are considered the same and are often used interchangeably (Amberg, 2005).
CSFs are closely related to a goal. Both have different meanings though often considered the same. Goals are targets created to achieve organizational, corporate, or project missions while CSFs are factors that must be well controlled in order for the goal to be achieved. As an analogy, a local government wants to provide quality public services. To achieve these objectives, the local government must know which factors are very influential to the creation of a quality service to the public. These factors may be good planning, competent human resources, adequate financing, etc. A high school student wishes to continue his undergraduate education at University X. In order for his wish to materialize, the student must pass the University of X selection examination exam. He targets to pass the selection test. Surely, he must know what factors are very influential on the graduation. These factors may be the frequency of learning, how to learn, family support, the environment, etc. Factors
that carry this significant influence are CSFs while passing a quality public service selection exam is a goal for the local government’s students.
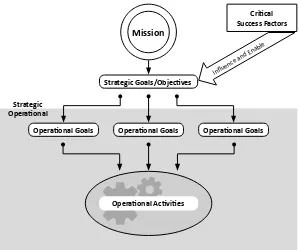
Figure 1 explains how the relationship between CSFs and Goal. The mission of an organization, company, or project contained in strategic goals/objectives to be achieved. Strategic targets are generally long-term targets that need to be downgraded to more specific and short-term operational goals. Furthermore, various operational activities are directed to realize these operational targets. However, the achievement of the mission is not an easy thing. Operational strategies must be determined precisely and clearly. Target (goals), especially operational goals to be achieved, must meet the criteria of SMART (specific, measurable, achievable, realistic, and tangible).
The CSFs approach is built to enable and assist the concerned organization, company, or project in the determination and achievement of clear and precise strategic goals.
Based on the above explanation, CSFs concepts and approaches are still very strong today and can be applied to overcome various challenges, especially in the field of Information System including e-Government because e-Government is also Information System (Heeks, 2006). Elmeziane et al. (2011) stresses the need for CSFs for Information Systems projects. CSFs are also considered a factor in which their presence will determine the success of the ICT project (Gichoya, 2005).
Strategic
Operational
Operational Goals Operational Goals Operational Goals
Mission
Strategic Goals/Objectives
Critical Success Factors
Influence and Enable
Operational Activities
B. Factor Analysis
Factor analysis is the most widely used technique today in various fields or research areas as a means to find relationships between a set of items or among independent variables. Factor analysis is unique among other multivariate statistical procedures developed with the aim of testing hypotheses about the correspondence between observed scores on the variables (manifest), or indicators, and hypothetical constructs (latent or unobserved variables), or factors, allegedly influencing those scores. Over the past few years, there have been thousands of publications related to factor analysis studies (Costello & Osbourne, 2005) so that the impact of factor analysis in terms of the volume of the research literature can not be denied. Factors that cannot be observed are indirectly measured but there is a construct hypothesis used to represent variables (Cattel, 1973). According to Williams, Onsman, & Brown (2010), factor analysis has many uses. First, factor analysis reduces a large number of variables into a smaller set of variables (also called factors) as dimensional reduction. Second, factor analysis can determine the underlying dimensions between measured variables and latent constructs so as to enable the formation and refinement of the theory or hypothesis. Third, factor analysis can provide evidence of empirical validity (Gorsuch, 1983; Hair, 1995; Tabachnick & Fidell, 2007; Thompson, 2004; Williams et al., 2010).
Success or e-Government success is a variable that cannot be measured or observed directly (latent variable) by the researchers because it is abstract so that it can only be observed through observed variable i.e. success factor (CSFs). The success factor is a concept that can be measured or observed directly and the measurement results are varied and real.
Factor analysis is a factor analysis technique in which several factors will be formed in the form of latent variables that cannot be determined before the analysis is done. In principle of factor analysis, the formation of new latent factors or variables is random, which can then be interpreted according to the factors or components or dimensions that are formed. In factor analysis, the researcher does not have knowledge or theory or a hypothesis that arranges the structure of the factors that will be formed, so that it can help build a new theory or hypothesis. Factor analysis has several stages including data collection, variable feasibility assessment, sample adequacy measurement, factor rotation to factor formation as presented in Figure 2. The process of factor analysis tries to find relationships between new variables or factors formed that are mutually independent of one another, so that one or more latent variables can be created or fewer factors than the number
of initial variables that are free or not correlated to each other. So, the inter-formed factors are not correlated to each other. Factor analysis generally developed to explain the existence of a very close correlation between the variables forming factor. For example, if initially there are ten initial variables that are mutually dependent, the explanatory factor analysis may be summarized or formed into only one or two sets of latent variables or new variables. Furthermore, the new set of variables is known by the name of a factor or component or dimension. The factors that are formed still represent or reflect the original variable or the initial variable. Factor analysis focuses on the part of the total variation that can be explained by the joint factor formed, in which the constituent items contribute to the other items forming a set of new variables or factors or components or latent variables.
In this study, also conducted a study of literature on previous research related to the study of success factors in the implementation of e-Government. It turns out that quite a lot of successful factor studies have been done by previous researchers but the overall success factors are scattered in various articles journals and conferences. In addition, there is no agreement on generic success factors that can be adopted by government institutions.
The studies have successfully formulated various success factors that are identified differently from one another but have not provided a complete picture. For example, Gil-Garcia and Pardo (2005) have formulated 23 successful factors (CSF) related to e-Government initiatives. Fortune and White (2006) have formulated 27 successful factors. Meanwhile, Yoon and Chae (2009) have also formulated 15 successful factors related to the implementation of e-Government system. The three research factors of success are Gil-Garcia & Pardo (2005), Fortune & White (2006) and Yoon & Chae (2009) using a qualitative approach i.e. literature review. Other e-Government success factors studies used qualitative approaches, such as interviews conducted by Reinwald & Kraemmergaard (2012), Kim et al (2009) and Luna-Reyes et al (2007) or using grounded theory approaches, such as studies by Zarei & Ghapanchi (2008). Meanwhile, some researchers formulate e-Government success factors with quantitative calculations to analyze the results of questionnaires such as Hung et al (2009) and Lin et al (2011) using Structural Equation Modeling (SEM) approach.
e-Government (Napitupulu, 2014). Furthermore, the 55 successful factors have also been confirmed by experts through expert judgment and leaving only 49 successful factors (Napitupulu & Sensuse, 2014). In this research, the success factors that have been produced will be empirically validated by a quantitative approach using factor analysis. This study will prove or validate the research studies that have been done previously (Napitupulu, 2014) empirically on whether the success factors generated can be applied to government agencies, especially local governments at the district/city level in Indonesia.
II. Method
In this study, a list of previously identified success factors (Napitupulu, 2014) IS empirically validated to prove whether success factors could be applied in Indonesia, especially by government agencies. A total of 49 successful factors from previous research results through expert judgment (Napitupulu & Sensuse, 2014) became the variables used and the focus in this study for empirical validation. All 49 of these success factors can be presented in Table 4.
The process of factor analysis tries to find relationships between new variables or factors formed that are mutually independent of one another, so that one or more latent variables can be created or fewer factors than the number of initial variables that are free or not correlated to each other. Therefore, the inter-formed factors are not correlated to each other.
At a factor analysis, it is generally developed to explain the very close correlation between the constituent variables. For example, if initially there are ten initial variables that are mutually dependent, the explanatory factor analysis may be summarized or formed into only one or two sets of latent variables or new variables or new components or factors. Next, the new set of variables is known by the factor name or component or dimension. The factors that are formed still represent or reflect the original variable or the initial variable. Factor analysis focuses on the part of the total variation that can be explained by the joint factor formed, in which the constituent items contribute to the other items forming a set of new variables or factors or components or latent variables.
In this study, also conducted a study of literature on previous research related to the study of success factors in the implementation of e-Government. It turns out that quite a lot of successful factor studies have been done by previous researchers but the overall success factors are scattered in various articles journals and conferences. In addition, there is no agreement on generic success factors that can be adopted by government institutions.
The research has successfully formulated various success factors that are identified differently from one another but have not provided a complete picture. For example, Gil-Garcia and Pardo (2005) have formulated 23 successful factors (CSF) related to e-Government initiatives. Fortune and White (2006) have formulated 27 successful factors. Meanwhile, Yoon and Chae (2009) have also formulated 15 successful factors related to the implementation of e-Government system. The three research factors of success are Gil-Garcia & Pardo (2005), Fortune & White (2006) and Yoon & Chae (2009) using a qualitative approach ie literature review. Other e-Government success factors studies used qualitative approaches such as interviews conducted by Reinwald & Kraemmergaard (2012), Kim et al (2009) and Luna-Reyes et al (2007) or using a grounded theory approach such as a study by Zarei & Ghapanchi (2008). While some researchers formulate e-Government success factors with quantitative calculations to analyze the results of questionnaires such as Hung et al (2009) and Lin et al (2011) using Structural Equation Modeling (SEM) approach.
The contribution of this research is the methodology that is using two qualitative and quantitative approaches (mix-method). The process of identification of successful e-Government factors with qualitative meta-ethnography approach has been done in previous research (Napitupulu, 2014) which generated 55 generic success factors related to e-Government implementation. Furthermore, the 55 successful factors have also been confirmed by experts through expert judgment and leaving only 49 successful factors (Napitupulu, 2014). In this study, the success factors that have been generated will be empirically validated by a quantitative approach, i.e. factor analysis. This is not visible or severely restricted to earlier studies which mostly use only a single approach. In addition, the position of this research is a synthesis of previous research related to the study of successful factors of e-Government implementation.
The questionnaire designed contains questions on the level of respondent’s approval of each success factor related to the implementation of e-Government contained in Table 3. Based on a previous research (Napitupulu, 2014), there are 49 success factors obtained from the literature identification results. The questionnaire was designed using 5 (five) Likert scales (Sugiyono, 2008) ranging from 1 to 5 (1 indicating “strongly disagree”, 2 = “disagree, 3 =” neutral “, 4 =” agree “and 5 stated “strongly agree”). The total respondents in this study are 237 people, who are employees working in local government at the district/city level from staffs to heads in charge of ICT field, especially e-Government. However, based on the results of questionnaires distribution, there are only 209 questionnaires that can be processed further because there are 18 questionnaires that are not returned and 10 questionnaires are not filled completely. The 28 questionnaires were excluded from further processing and data analysis. The sample size of 209 has met the requirements for performing factor analysis based on existing recommendations (Comrey & Lee, 1992; Gorsuch, 1983; Guilford, 1954; Kline, 1979).
The factor analysis approach is performed to empirically test the previously identified success factors as valid constructs that can represent or explain the success of e-Government. The success of e-Government is a variable that cannot be measured or observed directly (latent variables). This is in accordance with the purpose or usefulness of the factor analysis approach that can find the relationship (interrelationship) between a large number of constructs that are independent of each other so that they can be made into one or more sets of variables or dimensions (factors) fewer than the initial variables called data reduction (Singgih, 2010; William, 2010). In addition, by factor analysis, can be constructed a new hypothesis or theory based on the dimensions built between constructs and latent variables. Factor analysis also provides empirical evidence of constructs that form a latent variable (construct validity) based on measurement results in order to test a theoretical construct in the study
(Singgih, 2010; William, 2010). Therefore, in this research, there will be an evaluation of the validity of the construct so it is expected to obtain a set of valid success factors that can be used to measure the success of e-Government implementation in Indonesia. Processing and data analysis is done with IBM Statistics SPSS ver 22 software tool.
III. Results and Discussion
This section describes step by step approach of factor analysis from data collection, variable feasibility assessment, sample adequacy measurement, factor rotation to factor formation. As mentioned earlier that there are 209 samples of data collected which are processed and analyzed by factor analysis approach. The number of samples considered to be adequate is more than 200 so can be conducted a feasibility assessment variable. But previously, conducted a reliability testing questionnaire based on the value of Cronbach Alpha in which obtained Cronbach Alpha of 0.974. This indicates that the questionnaire is reliable because it meets the minimum requirements of Cronbach Alpha> 0.80 (Cronbach, 1951; Kowsalya, Lakshmi, & Suresh, 2012).
Assessment of the feasibility of variables based on KMO (Kaiser-Meyer-Olkin) scores by the following procedures:
• KMO values range from 0 to 1 indicating whether the variable or sample is feasible or not to be analyzed further. If the KMO value is equal to and greater than half and with significant value (sig) or probability (p) less than half then it is stated that the variable or sample is eligible for further analysis in the factor analysis.
• The hypothesis for significance is
Ho = Samples (variable) is not adequate for further analysis
H1= Samples (variable) is adequate for further analysis
• Criteria by looking at probability: Sig number > 0.05 then Ho is accepted Sig number < 0.05 then Ho is rejected
Table 4.
Variable Feasibility Testing KMO and Bartlett’s Test
Kaiser-Meyer-Olkin Measure of Sampling Adequacy. .903
Bartlett's Test of Sphericity Approx. Chi-Square 9854.675
df 1176
Table 5.
Total Variance Explained
Component
Initial Eigenvalues
Total % of Variance Cumulative %
1 23.513 47.985 47.985
2 2.648 5.404 53.389
3 2.067 4.218 57.606
4 1.618 3.301 60.908
5 1.352 2.759 63.667
6 1.223 2.495 66.162
7 1.153 2.352 68.514
8 1.104 2.253 70.767
9 1.059 2.162 72.929
10 0.994 2.028 74.957
11 0.897 1.831 76.788
12 0.795 1.622 78.410
13 0.728 1.486 79.896
14 0.692 1.413 81.309
15 0.671 1.370 82.679
16 0.646 1.319 83.998
17 0.581 1.186 85.184
18 0.547 1.117 86.301
19 0.505 1.031 87.332
20 0.445 0.909 88.241
21 0.439 0.896 89.137
22 0.420 0.858 89.995
23 0.400 0.817 90.811
24 0.368 0.751 91.562
25 0.365 0.746 92.308
26 0.331 0.675 92.983
27 0.303 0.619 93.601
28 0.282 0.576 94.178
29 0.249 0.508 94.686
The results of the variable feasibility test can be shown in Table 4.
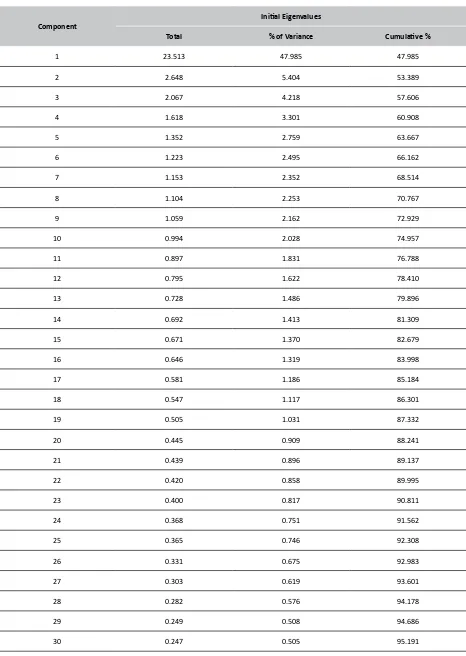
From Table 4 can be seen that the value of KMO and Bartlett’s Test obtained is 0.903 with a significance of 0.000. This Ho is implied to be rejected which means that the sample has been eligible for further analysis in factor analysis. Therefore, the value is above 0.5 and the significance is far below 0.05 (0.000 <0.05). After the sample is considered adequate, then the next in Table 5 presented the Total Variance Explained which shows the number of factors formed from a total of 49 variables.
For egien values indicating the relative importance of each factor in computing the overall variance of the variables analyzed in Table 6.45 shows the composition of the eigen values for the whole (49) variables sorted from the largest to the smallest with the criterion that the eigen value values below 1 are not used in calculating the
number of factors formed. From Table 65.4, it can be seen that there are 9 factors that are formed because they have eigen values above 1 but 40 factors are eigen values below 1 so that the process of factoring stops at 9 factors in which 9 factors is the most optimal amount.
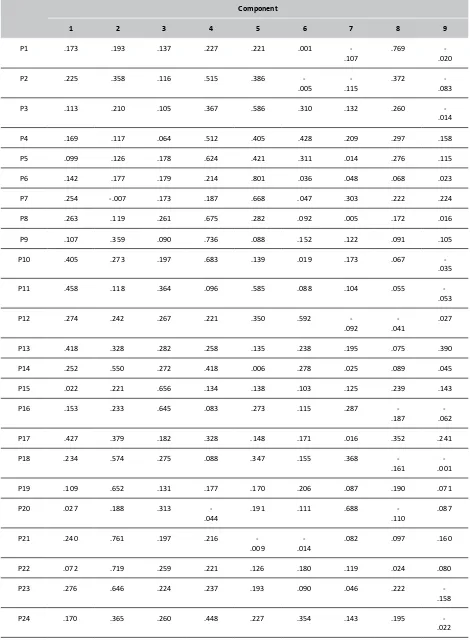
It also shows at this stage that there is a grouping of a number of variables to a particular factor because of the resemblance or similarity of the characteristics of certain variables. Next is the process of forming factors to determine what variables go into which factors based on the rotated Component Matrix. This shows the overall distribution of the 49 variables on the nine factors formed whereby the determination of which variables go into certain factors is done based on the ratio of the correlation between a variable with a certain factor called the loading factor as shown in Table 6 where the variables in the analysis factor Component
Initial Eigenvalues
Total % of Variance Cumulative %
31 0.243 0.495 95.686
32 0.229 0.467 96.152
33 0.202 0.412 96.564
34 0.185 0.378 96.943
35 0.173 0.354 97.296
36 0.162 0.331 97.627
37 0.157 0.321 97.948
38 0.131 0.268 98.216
39 0.125 0.255 98.470
40 0.118 0.242 98.712
41 0.102 0.207 98.920
42 0.096 0.197 99.117
43 0.088 0.179 99.295
44 0.082 0.166 99.462
45 0.072 0.148 99.609
46 0.063 0.129 99.738
47 0.053 0.108 99.846
48 0.043 0.087 99.933
Table 6.
Rotated Component Matrix Factor
Component
1 2 3 4 5 6 7 8 9
P1 .173 .193 .137 .227 .221 .001
-.107
.769
-.020
P2 .225 .358 .116 .515 .386
-.005
-.115
.372
-.083
P3 .113 .210 .105 .367 .586 .310 .132 .260
-.014
P4 .169 .117 .064 .512 .405 .428 .209 .297 .158
P5 .099 .126 .178 .624 .421 .311 .014 .276 .115
P6 .142 .177 .179 .214 .801 .036 .048 .068 .023
P7 .254 -.007 .173 .187 .668 .047 .303 .222 .224
P8 .263 .119 .261 .675 .282 .092 .005 .172 .016
P9 .107 .359 .090 .736 .088 .152 .122 .091 .105
P10 .405 .273 .197 .683 .139 .019 .173 .067
-.035
P11 .458 .118 .364 .096 .585 .088 .104 .055
-.053
P12 .274 .242 .267 .221 .350 .592
-.092
-.041
.027
P13 .418 .328 .282 .258 .135 .238 .195 .075 .390
P14 .252 .550 .272 .418 .006 .278 .025 .089 .045
P15 .022 .221 .656 .134 .138 .103 .125 .239 .143
P16 .153 .233 .645 .083 .273 .115 .287
-.187
-.062
P17 .427 .379 .182 .328 .148 .171 .016 .352 .241
P18 .234 .574 .275 .088 .347 .155 .368
-.161
-.001
P19 .109 .652 .131 .177 .170 .206 .087 .190 .071
P20 .027 .188 .313
-.044
.191 .111 .688
-.110
.087
P21 .240 .761 .197 .216
-.009
-.014
.082 .097 .160
P22 .072 .719 .259 .221 .126 .180 .119 .024 .080
P23 .276 .646 .224 .237 .193 .090 .046 .222
-.158
P24 .170 .365 .260 .448 .227 .354 .143 .195
Component
1 2 3 4 5 6 7 8 9
P25 .299 .276 .502 .248 .078 .104 .061 .351 .357
P26 .248 .276 .345 .212 .192 .172 .381
-.071
.480
P27 .218 .378 .449 .363 .208 .061 .150 .117 .166
P28 .691 .299 .097 .252 .178 .096 .201 .185 .207
P29 .443 .387 .374 .418 .063
-.095
.260
-.067
.138
P30 .295 .420 .573 .113
-.001
.122 .128 .176
-.122
P31 .508 .418 .312 .204 .372 .195
-.059
-.017
.059
P32 .531 .218 .434 .385 .136 .265
-.190
.025 .239
P33 .733 .272 .264 .167 .242 .124
-.124
.082 .105
P34 .547 .285 .111 .377 .098 .339 .038 .274
-.054
P35 .241 .161 .643 .277 .187 .130 .190
-.027
.131
P36 .364 .029 .086 .378 .147 .395 .174 .531 .105
P37 .686 .095 .223 .094 .321 .147 .202 .253
-.177
P38 .200 .223 .412 .183 .276 .088 .378 .401
-.048
P39 .141 .230 .418 .130
-.045
.547 .268 .163 .094
P40 .291 .061 .600 .168 .291 .305 .093 .202 -.049
P41 .243 .269 .426 .126 .315 .392 .234 .151 .124
P42 .288 .212 .436 .104 .366 .089 .212 .275
-.021
P43 .506 .190 .181 .295 .226 .195 .384 .132
-.273
P44 .680 .164 .183 .237 .083 .111 .350 .104 .129
P45 .433 .516
-.015
-.095
.320 .105 .226 .168 .237
P46 .360 .395 .177 .316 .075 .499 .234
-.070
-.061
P47 .091 .389 .458 .018 .110 .446 .232 .032 .325
symbolized by P ranging from P1 to P49.
In Table 6, the figures in the table are factor loadings (FL), which indicate the correlation between a variable with a particular factor. As said before that the grouping of variables into factors is done by looking at the ratio of the correlation of each variable shown by factor loading (FL). Based on Costello & Osbourne (2005) that factor structure has been pure or fit if loading factor greater than 0.3 indicating loading factor has a high enough standard value and indicates convergent validity has been achieved. In addition, according to Kline (1994) & Baloğlu (2008) if factor loading is below 0.3, then the item (variable) that has the loading factor can be discarded or eliminated. Similarly, Hair (1998) suggests that the loading factor of item (variable)> 0.3 is considered significant, factor loading> 0.4 is more important and factor loading> 0.5 is considered very significant. But there really is not an absolute value standard for the cut-off value of factor loading. Therefore, in this study selected the cut-off from factor loading that is 0.4 so factor loading below 0.4 is not included.
However, based on the subsequent rotated Component Matrix, the factor structure formed is not pure or fit because there is still a cross loading item (variable) (one item has a high loading factor of two or more factors formed) and there are two unstable factors because it only consists of two items (variables). According to Costello & Osbourne (2005), the unstable or weak factor is a factor that is formed but fewer than three items are formed. If this happens, based on (Costello & Osbourne, 2005), purifying factor analysis can be done by manipulating the number of factors. Based on the suggestion (Costello & Osbourne, 2005) Hepi, 2009), there is a reduction of factor number from nine factors up to eight factors and so on until it gets a pure or fit factor structure where there is no cross loading items and unstable factors and has high loading factor. (Strong loading factor).
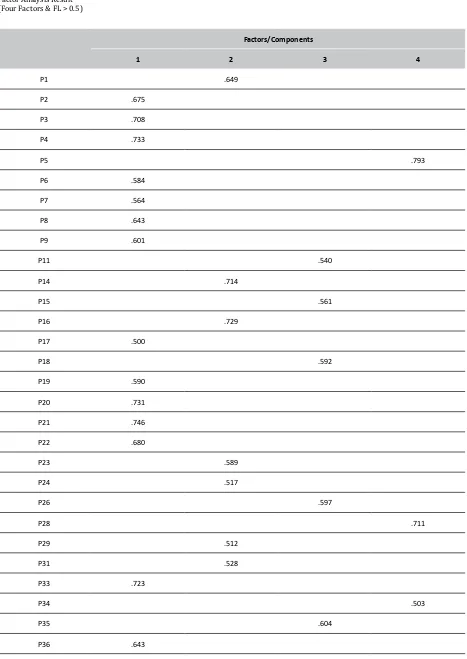
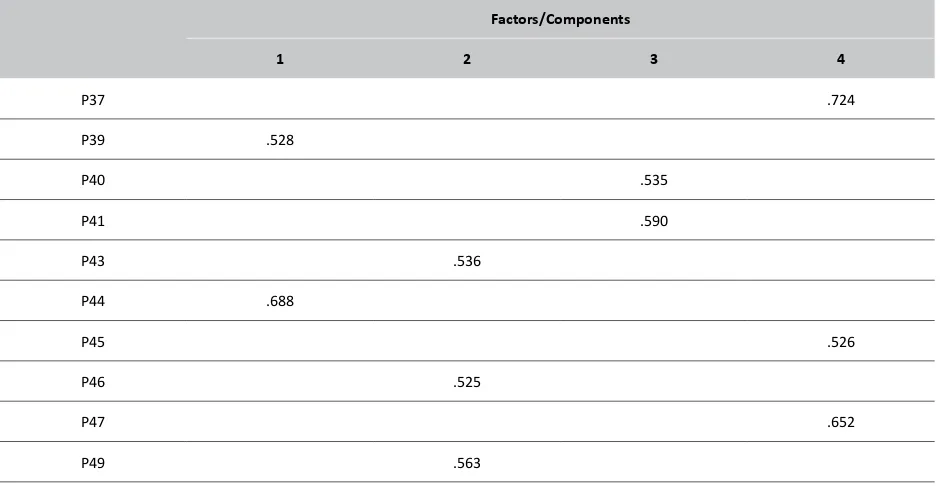
After reducing the number of factors, obtained a fit and stable factor structure, in which the number of factors formed are 4 factors. Following Costello & Osbourne (2005), the resulting factor structure can be presented in Table 7.
According to Costello & Osbourne (2005), to abort the problematic item (variable), it is possible by increasing the loading factor to be increased to
greater than 0.5. Therefore, loading less than 0.5 is not included or discarded. In Table 7 it appears that the factor structure is pure or fit where based on the criteria (factor loading> 0.5) then there are 10 items (variables) removed or eliminated, namely P10, P12, P13, P25, P27, P30, P32, P38, P42, and P48. Thus, there are only 39 variables out of 49 processed factoring (group factoring) variables.
Based on a number of variables obtained by the process of factoring, the factors formed are labeled, in which the first factor as the resources, the second factor as the driver, the third factor as the value, and the fourth factor as the outcome in accordance with Characteristics of items/variables that are inside, which can be presented in Table 8.
Labeling of each factor or component formed is done based on the sub-components present therein and represents the component itself. For example, the sub-components of “good and clear organizational structure”, “sufficient funding”, and “available portal/application” etc are the manifestation of the resources that the government institutions need or have in order to support the successful development of e-Government system in Indonesia. Similarly, other sub-components such as “supportive government policy,”top management support”,” reward & recognition” are the driver components that encourage government agencies to implement e-Government. This applies to the process of naming (labeling) other components or factors.
The four factors or components, formed along with the forming variable, have been empirically proven to represent or explain the picture of the success of e-Government system although the relationship between the four factors need to be conducted further study to know the relation or correlation to the success of e-Government and how the condition of these factors in the field can be accommodated by government institutions to support the successful implementation of e-Government in Indonesia.
However, based on the results of factor analysis conducted, can be shown that the total of 39 successful factors (CSF) of e-Government implementation has been declared valid because it meets the minimum requirements. The test reliability of Cronbach Alpha has applied again to 39 items as the result of factor analysis and obtained Component
1 2 3 4 5 6 7 8 9
P49 .262 .462 .399 .326 .029 .235 .226 .140
Table 7.
Factor Analysis Result (Four Factors & FL > 0.5)
Factors/Components
1 2 3 4
P1 .649
P2 .675
P3 .708
P4 .733
P5 .793
P6 .584
P7 .564
P8 .643
P9 .601
P11 .540
P14 .714
P15 .561
P16 .729
P17 .500
P18 .592
P19 .590
P20 .731
P21 .746
P22 .680
P23 .589
P24 .517
P26 .597
P28 .711
P29 .512
P31 .528
P33 .723
P34 .503
P35 .604
Factors/Components
1 2 3 4
P37 .724
P39 .528
P40 .535
P41 .590
P43 .536
P44 .688
P45 .526
P46 .525
P47 .652
P49 .563
Table 8.
Grouping Results of Factors/Components
Factor/Components
Resources Driver Value Outcome Good and clear
organizational structure Supportive government policy
Better Business Proces Citizen relationship
management
Strong Leadership Good partnership with
other institution User/citizen computer/internet literacy
Self-Sustanaible Revenue
Available Portal/
Application Good project management Supportive cultural environment
Open Government
Training Good change management Trust User Satisfaction
International support Monitoring and evaluation Electronic Transaction Prototype
Enough Funding Top management support
E-Participation Good Governance
Highly Demand of Citizen Good Information quality Re-Usable
Good team skills and
expertise Good outsourcing strategy
Supportive ICT
Infrastructure/service availability
Political support and
stability
Awareness Reward & Recognition
Legal framework
a coefficient of internal consistency reliability (Cronbach Alpha) of 0.970. Reliability test is also performed for each factor (component) that is obtained, namely Cronbach Alpha value 0.907 for resource factor, 0.904 for driver, 0.879 for value, and 0.901 for outcome. This shows that based on the Cronbach Alpha coefficient, it can be said that all items (success factors) have good internal consistency reliability. Thus, the overall success factor can be said to be valid and reliable to measure the success rate of e-Government implementation in Indonesia.
IV. Conclusion
In this research, what have been successfully identified and validated empirically are all 39 valid and reliable factors of success (CSF) related to the implementation of e-Government system in Indonesia. Success factors can be used to measure the extent of application of e-Government in Indonesia.
From the total success factors are classified by factor analysis based on the loading factor> 0.5 to obtain the results of the analysis, also obtained four main factors (components) that affect the success of e-Government in Indonesia, namely the factor of resources, value, driver, and outcome.
Further research suggestions are that we may need further research with a qualitative approach to develop a measurement or implementation model of e-Government system in Indonesia based on validated success factors, to know or explore deeply how the conditions of the factors studied in the field, as well as the relationship between one factor with other factors.
The limitations of this study are that it only uses a quantitative approach to validate the success factors that have been obtained previously.
V. References
Altameem, T., Zairi, M., & Alshawi, S. (2006). Critical Success Factors of E-Government: A Proposed Model for E-Government Implementation. 2006 Innovations in Information Technology. http:// doi.org/10.1109/INNOVATIONS.2006.301974 Baloğlu, N., Karadağ, E., & Karaman, H. (2008). The
Strategic Planning Attitude Scale: A Study of Exploratory and Confirmatory Factor Analyses. Educational Sciences: Theory & Practice, 8(2), 429–437. Retrieved from https://eric. ed.gov/?id=EJ831163
Comrey, A. L., & Lee, H. B. (1992). A First Course in Factor Analysis. New York: Erlbaum.
Costello, A. B., & Osbourne, J. W. (2005). Best Practices in Exploratory Factor Analysis: Four Recommendations for Getting the Most from Your Analysis. Practical Assessment, Research & Evaluation, 10(7), 1–9. http://doi. org/10.1.1.110.9154
Cronbach, L. J. (1951). Coefficient Alpha and the Internal Structure of Tests. Psychometrika, 16(3), 297–334. http://doi.org/10.1007/ BF02310555
Gorsuch, R. L. (1983). Factor Analysis (2nd ed.). L. Erlbaum Associates.
Guilford, J. P. (1954). Psychometric Methods (2nd ed.). McGraw-Hill.
Hair, J. F. (1995). Multivariate Data Analysis with Readings (4th ed.). Prentice Hall.
Hair, J. F. (1998). Multivariate Data Analysis (5th ed.). Prentice Hall.
Kline, P. (1979). Psychometrics and Psychology. Academic Press.
Kline, P. (1994). An Easy Guide to Factor Analysis. Routledge.
Kowsalya, D. N., Lakshmi, V., & Suresh, K. P. (2012). Development and Validation of a Scale to Assess Self-Concept in Mild Intellectually Disabled Children. International J. Soc. Sci. & Education, 2(4), 2223–4934.
Napitupulu, D. (2015). Kajian Faktor Sukses
Factor/Components
Resources Driver Value Outcome Good Planning
Creativity & Innovation
User and Stakeholder involvement
Guidelines for e-Government
Implementasi E-Government Studi Kasus: Pemerintah Kota Bogor. Sistem Informasi, 5(3), 229–236. Retrieved from http://si.its.ac.id/ data/sisfo_data/files/9_vol5no3.pdf
Supangkat, S. H., & Negara, I. M. A. J. (2006). Framework Strategi Implementasi E-Government. Prosiding Konferensi Nasional Teknologi Informasi & Komunikasi Untuk Indonesia. Bandung.
Tabachnick, B. G., & Fidell, L. S. (2007). Using Multivariate Statistics. Pearson.
Thompson, B. (2004). Exploratory and Confirmatory Factor Analysis: Understanding Concepts and Applications. American Psychological Association.