www.elsevier.com / locate / econbase
Department of Agricultural and Resource Economics, Oregon State University, Corvallis, OR 97331-3612, USA b
Department of Economics, Oregon State University, Corvallis, OR 97331-3612, USA Received 7 August 1999; accepted 23 May 2000
Abstract
This paper addresses a paradox noted by Kevin Fox, that ‘using a standard definition of cost efficiency, a multi-product firm may be more efficient in producing each product than any other firm, yet it may not be the most efficient firm overall.’ We show why the paradox arises and how to avoid the paradox. Specifically we use the duality between cost functions and the directional distance function to provide a cost measure of efficiency that is nonparadoxical. 2000 Elsevier Science S.A. All rights reserved.
Keywords: Directional distance function; Efficiency measurement
JEL classification: D24
1. Introduction
1
In a recent paper K.J. Fox (1999) introduced the following paradox: ‘Using a standard definition of cost efficiency, a multi-product firm may be more efficient in producing each product than any other firm, yet it may not be the most efficient firm overall.’ (from the abstract)
The purpose of this paper is to resolve the Fox paradox and show what form of efficiency measures avoid the paradox. Also, based on the duality between the directional input distance function and the cost function we provide a cost measure of efficiency that is paradox free. Intuitively, the Fox paradox arises because the aggregate costs used in his example are additive (as is our proposed measure), but the disaggregated measures are in ratio or multiplicative form.
Following the notation in Fox (1999) we denote the actual cost to firm i51, 2 of producing good i
i 2 ˆ
j51, 2 by C and the minimal cost by C .j j
*Corresponding author. Tel.: 11-514-737-8185; fax:11-541-737-5917.
E-mail address: [email protected] (S. Grosskopf). 1
We are grateful to Kevin Fox and an anonymous referee for their comments. 2
That is, the cost associated with choosing the cost-minimizing input bundle, given input prices. 0165-1765 / 00 / $ – see front matter 2000 Elsevier Science S.A. All rights reserved.
i i i
ˆ
The function F(C , C )j j 5E denotes the efficiency of firm i in producing good j. Fox takes thisj
i i i i
the overall efficiency for firm i is
2i
i i
OE 5F(TC , TC ). (1)
To resolve the Fox paradox we formulate the following consistency condition:
1 2 1 2 1 2
if E1.E and E1 2.E , then OE2 .OE . (2)
This criterion says that if firm 1 is more efficient than firm 2 in producing both goods, then firm 1 should be overall more efficient than firm 2.
This consistency condition is fulfilled if we take
1 1 1 2 2 2
E11E25OE and E11E25OE , (3)
1 2
since then OE .OE .
Condition (3) yields the functional equation
1 1 2 2 1 2 1 2
ˆ ˆ ˆ ˆ
F(C , C )1 1 1F(C , C )1 1 5F(C11C , C1 11C )1 (4)
´
which, see Aczel (1966, p. 215), has the solution
1 1 1 1
ˆ ˆˆ
F(C , C )1 1 5aC11aC1 (5)
ˆ ˆ
where a and a are arbitrary constants. Here we take a51 /V and a5 21 /V, where V stands for value, so that in general, dropping i and j,
ˆ C2C
ˆ ]]
F(C, C )5 V (6)
ˆ
As we can see, (6) is now independent of unit of measurement, it is nondecreasing in C and nonincreasing in C. Moreover, we see that (6) is a ‘difference’ measure of efficiency, which differs from Fox, who assumed F to be a ratio measure as in the traditional Farrell approach. It is easy to show that (6) satisfies our consistency condition (2).
Next we use the duality between the cost function and directional input distance function to generate a cost efficiency measure consistent with (6).
N M
Following Chambers et al. (1996), let g[R be a directional vector. Then the directional input
1
D ( y, x; g)i 5suphb : (x2bg)[L( y)j. (8)
This function corresponds to what Luenberger (1992) calls the ‘benefit’ function. It is a complete characterization of the technology in the sense of
¢
This expression can be formulated as an efficiency measure, namely
C( y, w)2wx
¢
]]]] 5wg D ( y, x; g)i 1AE. (12)
¢
The left hand side of (12) is overall cost efficiency, D ( y, x; g) is technical efficiency and thei residual term AF denotes allocative efficiency.
Focusing on the overall cost efficiency
C( y, w)2wx
]]]]wg , (13)
ˆ
we see that it is consistent with (6) where C( y, w)5C5minimum cost, wx5C5observed cost and
wg5V5value, which we take to be the value of the directional vector g.
3
then substituting into (6) we have
C( y , 0, w)1 2(wx)11C(0, y , w)2 2(wx)2
]]]]]]]]]]]]]wg (18)
3
2
TC2TC
]]]
5 , (19)
wg
which thus avoids the Fox paradox, i.e., in this case the ‘disaggregated’ efficiency measures are consistent with (add up to) the aggregate measure of efficiency, and by definition must agree in ordering the efficiency of observations. For the interested reader we include a numerical example consistent with that in Fox (1999) in Appendix A.
Intuitively, from a ‘functional form’ point of view the Fox paradox arises because the aggregate costs used in his example are additive (as is our proposed measure), but the disaggregated measures are in ratio or multiplicative form. We have shown that if the disaggregated measures are to be consistent with the additive aggregate measure, then both must be additive.
Appendix A
We include a numerical example consistent with that employed in Fox (1999) to illustrate the two approaches.
i i
ˆ
As in the text let C denote minimal or predicted cost of producing good j for firm i and let Cj j i
represent the observed cost for the same firm and good. Let E be the relevant disaggregatedi j i
i ˆ i i ˆ i
efficiency measure: in Fox (1999) Ej5C /C whereas we define it as here Ej j j5Cj2C /V, where wej
i
set V51. In addition, we include the data on shares s used in Fox to arrive at his overall efficiencyj measure. The relevant data are summarized in Table A.1.
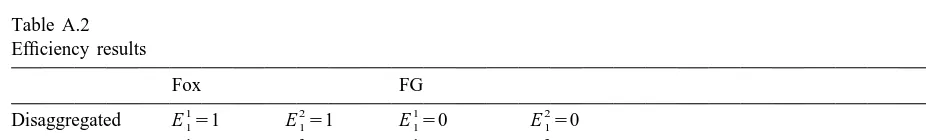
Based on this data we get the following results summarized in Table A.2.
The results in Table A.2 confirm that using the Farrell type efficiency ratio measure to define disaggregated efficiency and a share weighted sum to aggregate can give inconsistent results: using that approach the disaggregated results can suggest that two observations are equally efficient,
Table A.1
whereas the aggregated results suggest that they are not (see the left hand side of the Table under Fox). Using our difference disaggregated measure which is then summed to yield aggregate efficiency yields a consistent ranking of efficiency.
References
´
Aczel, J., 1966. Lectures on Functional Equations and Their Application. Academic Press, New York, London. ¨
Chambers, R.G., Chung, Y., Fare, R., 1996. Benefit and distance functions. Journal of Economic Theory 70, 407–419. Fox, K.J., 1999. Efficiency at different levels of aggregation: public vs. private sector firms. Economics Letters 65 (2),
173–176.