www.elsevier.com / locate / econbase
The long-run relationship between productivity and capital
*
Mark Funk , Jack Strauss
Saint Louis University, Department of Economics 3674 Lindell Blvd. St. Louis, MO 63108, USA
Received 29 April 1999; accepted 25 April 2000
Abstract
Using panel cointegration techniques, we show a cointegrating relationship exists between capital and productivity in 446 manufacturing industries. Panel DOLS and FMOLS estimates reveal that innovations to productivity increase and Granger cause capital movements. 2000 Elsevier Science S.A. All rights reserved.
Keywords: Productivity; Capital; Panel cointegration
JEL classification: O40; C23; O30
1. Introduction
In the standard neoclassical growth model, capital plays a passive role in determining the growth rate of output, since the ultimate driving force is technological progress. Recent work, however, has challenged this view. In a recent paper, Howitt and Aghion (1998) examine the theoretical link between capital accumulation and innovation, and show a complementary and bi-causal relationship between these variables. Their model differs substantially from the neoclassical model, which posits that capital and productivity are orthogonal and contemporaneously unrelated. This paper examines the long-run relationship between productivity and capital and tests two related hypotheses: does productivity drive capital and / or does capital drive productivity?
Examining 446 industries from the NBER manufacturing database, this paper’s contribution to the literature is as follows. First, using panel cointegration methods, we show that a long-run, stable relationship exists between productivity and capital. Second, panel DOLS and FMOLS estimates reveal that a 1% increase in productivity significantly increases capital by 0.13–16%; whereas, a 1% increase in capital generates only a 20.02 to 0.03% increase in productivity. Third, we demonstrate that productivity Granger causes capital, while we find less evidence that capital drives productivity.
*Corresponding author. Tel.: 11-314-977-3844; fax:11-314-977-3897. E-mail address: [email protected] (M. Funk).
Neoclassical growth theory emphasizes that the causation runs from productivity to capital. Industries that experience positive productivity innovations attract capital to equalize returns across industries. Further, without productivity increases to offset diminishing returns, capital growth goes to zero. Conversely, using calibration methods, Greenwood et al. (1997) demonstrate that ‘the introduction of new, more efficient capital goods is an important source of productivity change.’ Their work indicates that capital accounts for a major part of productivity growth. In related work, Hulten (1992) emphasizes capital-embodied technological change as critical for long-run productivity innovations. Klenow (1998), using cross-sectional data from the NBER manufacturing database, stresses a one-way connection from capital to productivity and finds that productivity growth is faster in capital intensive industries. Our paper differs from previous work as we adopt a pooled time-series approach that explicitly accommodates and estimates the dynamic long-run interrelationships in levels while focusing on causality and stability.
2. Data and methodology
The NBER Manufacturing Productivity Database contains productivity and capital data for 448 SIC 4-digit US manufacturing industries from 1958 to 1994, and is downloadable from www.NBER.org. We drop two industries, SIC 2794 and SIC 3292, for lack of observations. We consider total factor productivity (XTP1 in the NBER series) and capital per worker, defined as the real capital stock divided by total employment.
Kao (1999) and McCoskey and Kao (1998) demonstrate two straightforward methods for testing cointegration in a panel setting. The first approach extends the Im et al. (1997) methodology to a cointegration framework, and averages ADF tests on the estimated residuals from individual OLS regressions. The second technique performs a cointegrating Levin and Lin (1993) on the estimated residuals from individual OLS regressions. This procedure restricts the first order autoregressive coefficients to be identical; whereas, the IPS method accommodates for heterogeneity by allowing for different first order autoregressive coefficients. If cointegration exists, then the variables can be estimated using heterogeneous panel DOLS or FMOLS methods [Kao and Chiang, 2000]. The FM estimator is:
where the term Dieu corrects for endogeneity and serial correlation in the individual long-run
*
*
covariance matrix, and xit and yit are adjusted by the long-run covariance matrix to accommodate for heterogeneity. The DOLS method is estimated by:
q2
*
*
*
*
y 5a 1x 9b1
O
c Dx 1v (2)it i it ij it1j it j52q1
where the lead and lagged differences account for possible serial correlation and endogeneity of the errors.
Hsaio (1986), we subtract cross-section means to reduce the aggregate correlation among variables. This procedure is identical to introducing time-specific dummies to account for contemporaneous correlation.
Economists are also concerned with whether the estimated parameters are stable over a relevant time period. Hansen (1992a) explains that prior model instability tests such as CUSUM and CUSUM squared are essentially tests of instability of the intercept alone or of the variance of the regression error. Chow breakpoint tests suffer from arbitrary split sample periods, or if the breakpoint is selected
2
by plotting the residuals (and is conditional on the data) then the conventional x statistics are no longer accurate (Hansen, 1992a).
Hansen (1992b) provides three parameter stability tests of the cointegrating vector. He shows that since parameter constancy may imply a cointegrating relationship, parameter instability and structural change can cause failure of cointegration. Hansen states that the MeanF statistic tests ‘whether or not the specified model is a good model that captures a stable relationship,’ and that the SupF statistic is
1
appropriate for ‘testing a swift shift in regime.’ Work by Andrews (1993) and Andrews and Ploberger (1994) develops the asymptotic distributions for the MeanF and SupF statistics.
3. Results
Im et al. (1997) panel unit root statistics for real capital per worker (k) and productivity (A) are
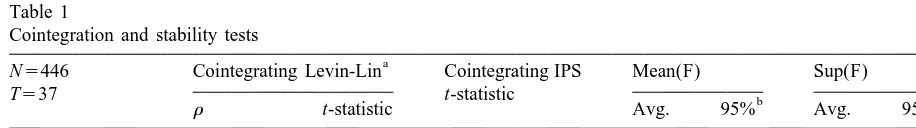
20.60 and 21.47, respectively, and results cannot reject unit root processes. We then test for a long-run relationship. Table 1 presents the cointegration results. The cointegrating Levin-Lin tests clearly reject the assumption of a unit root in the estimated residuals. Results are robust to both specifications, and thus strongly support a cointegrating relationship between capital and productivity. The cointegrating IPS results are less conclusive. Cointegration is supported when capital is the dependent variable, but not when the specification is reversed. Further support for a cointegrating relationship is given by the industry-level MeanF and SupF results, which show that virtually all industries possess stable long-run parameter estimates. Taken together, the three tests confirm that capital and productivity are cointegrated.
Table 1
Cointegration and stability tests
a
N5446 Cointegrating Levin-Lin Cointegrating IPS Mean(F) Sup(F)
T537 t-statistic b b
r t-statistic Avg. 95% Avg. 95%
A5a 1 bi ik1et 20.235** (247.06) 22.14** 1.48 446 4.13 446
k5a 1 bi iA1et 20.151** (234.55) 21.44 1.62 438 4.38 446
a
5% CV5 228.00. **significant at 1% level. b
Number of industries that are stable at the 95% significance level, where the critical value for Mean (F) is 4.57 and Sup (F) is 12.7. The null hypothesis is parameter stability and large values indicate rejection. A is total factor productivity and k is capital per worker.
1
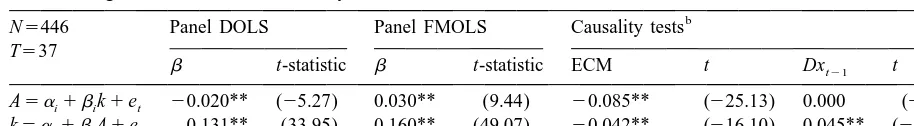
Table 2
a Panel cointegration estimates and causality tests
b N5446 Panel DOLS Panel FMOLS Causality tests T537
b t-statistic b t-statistic ECM t Dxt21 t
A5a 1 bi ik1et 20.020** (25.27) 0.030** (9.44) 20.085** (225.13) 0.000 (20.035)
k5a 1 bi iA1et 0.131** (33.95) 0.160** (49.07) 20.042** (216.10) 0.045** (216.10)
a
The DOLS procedure uses two leads and two lags, and is not sensitive to alternative specifications. b
In row one, Dxt21refers to the lagged change in capital. In row two, Dxt21refers to the lagged change in productivity. **
Significant at 1% level.
FMOLS and DOLS panel cointegration results in Table 2 show that a 1% increase in productivity increases capital 0.13% and 0.16%, respectively. This suggests that capital flows to more productive industries and supports neoclassical theory. A rise in capital has a more ambiguous effect on productivity. FMOLS results show that a 1% increase in capital yields only a .03% increase in productivity; the DOLS results are even smaller and negative. This weak effect differs from the findings of Howitt and Aghion (1998); Klenow (1998) and Greenwood et al. (1997).
Column III reports the causation tests. Since lagged productivity differences explain current capital innovations and capital adjusts to maintain long-run equilibrium, we conclude that productivity Granger-causes capital, since lagged productivity differences explain current capital innovations and capital adjusts to the ECM. The capital to productivity link is less conclusive, for although the ECM is significant, the lagged capital differences do not explain current productivity movements.
4. Conclusion
Our results support a stable long-run relationship between productivity and capital. Panel DOLS and FMOLS cointegration estimates and Granger causality tests demonstrate a strong causal link from productivity to capital, but a less conclusive relationship from capital to productivity. The data demonstrates that productivity innovations attract capital, but that new capital does not necessarily yield productivity increases.
References
Andrews, D.W.K., 1993. Tests for parameter instability and structural change with unknown change point. Econometrica 61, 821–856.
Andrews, D.W.K., Ploberger, W., 1994. Optimal tests when a nuisance parameter is present only under the alternative. Econometrica 62, 1383–1414.
Greenwood, J., Hercowitz, Z., Krusell, P., 1997. Long-run implications of investment-specific technological change. American Economic Review 87, 342–362.
Hansen, B., 1992a. Testing for parameter instability in linear models. Journal of Policy Modeling 14, 517–553.
Howitt, P., Aghion, P., 1998. Capital accumulation and innovation in long-run growth. Journal of Economic Growth 3, 111–130.
Hsaio, C., 1986. Analysis of Panel Data. Cambridge University Press.
Hulten, C., 1992. Growth accounting when technical change is embodied in capital. American Economic Review 82, 964–980.
Im, K.M.H. Pesaran, Shin, Y., 1997. Testing for unit roots in heterogeneous panels, Dept. of Applied Economics Working Paper, Univ. of Cambridge, revised.
Kao, C., 1999. Spurious regression and residual-based tests for cointegration in panel data. Journal of Econometrics 90, 1–44.
Kao, C., and Chiang, M.-H., 2000, On the estimation and inference of a cointegrated regression in panel data, Working Paper.
Klenow, P., 1998. Ideas versus rival human capital: industry evidence on growth models. Journal of Monetary Economics 42, 3–23.
Levin, A., Lin, C., 1993. Unit root test in panel data: asymptotic and finite-sample properties, Discussion Paper 93-56, Dept. of Economics: Univ. of San Diego.