[ 1 7]
Kre˘simir ˘Sega
De partme nt fo r Enviro nme ntal Hygie ne , Ins titute fo r Me dic al Re s e arc h and Oc c upatio nal He alth, Z agre b, Cro atiaTavg – average perc entage of time spent at home S.d. – standard deviation
[ 1 8] Kre ˘s imir ˘Se ga
Distributio ns o f lo ng-te rm ho use ho ld e xpo sure to ammo nia
Enviro nme ntal Manage me nt and He alth
7 / 4 [1 9 9 6 ] 1 7 –2 0
t a k e p la ce in liv in g-r oom s. T h e Ca r t es ia n cr os s -p r od u ct s of con cen t r a t ion d a t a a n d t im e bu d get d a t a w er e ca lcu la t ed , a n d t h eir d is t r i-bu t ion s w er e d et er m in ed . T h e exp os u r es w er e n or m a lized w it h r es p ect t o t im e (p r o-p or t ion of t im e s o-p en t in liv in g-r oom s w a s u sed in exp osu r e ca lcu la t ion ), t o m a k e t h e
r esu lt s com p a r a ble w it h p r op osed exp osu r e lim it va lu e for r es id en t ia l in d oor a ir q u a lit y of 200 µgm–3
[9]. Fou r con cen t r a t ion d a t a gr ou p s (t wo t y p es of h ou seh old s for t h e su m -m er a n d w in t er p er iod s) a n d fou r t i-m e bu d get d a t a gr ou p s gave 16 d iffer en t exp osu r e d ist r i-bu t ion s in a ll.
Table III
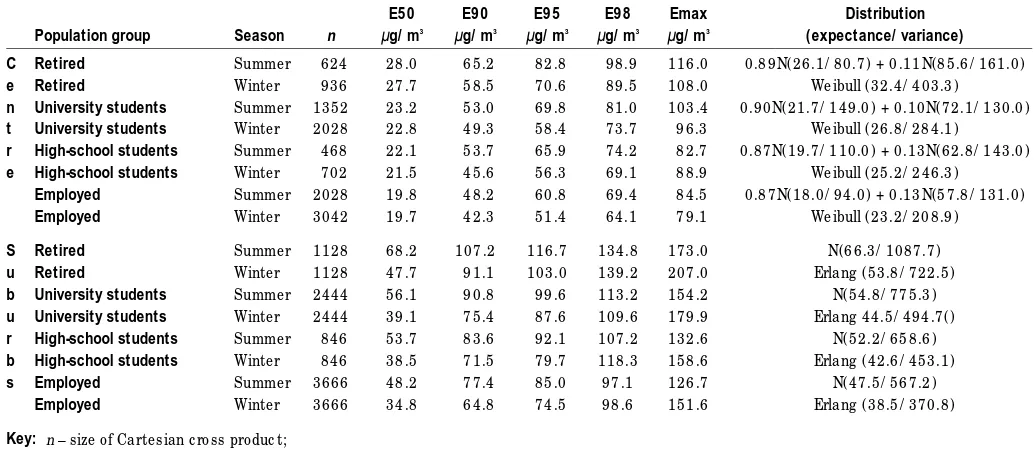
Dis tributio n parame te rs o f ammo nia e xpo s ure at ho me fo r diffe re nt po pulatio n gro ups
E50 E90 E95 E98 Emax Distribution
Population group Season n µg/ m3 µg/ m3 µg/ m3 µg/ m3 µg/ m3 (expectance/ variance)
C Retired Summer 6 2 4 2 8 .0 6 5 .2 8 2 .8 9 8 .9 1 1 6 .0 0 .8 9 N(2 6 .1 / 8 0 .7 ) + 0 .1 1 N(8 5 .6 / 1 6 1 .0 )
e Retired Winter 9 3 6 2 7 .7 5 8 .5 7 0 .6 8 9 .5 1 0 8 .0 Weibull (3 2 .4 / 4 0 3 .3 )
n University students Summer 1 3 5 2 2 3 .2 5 3 .0 6 9 .8 8 1 .0 1 0 3 .4 0 .9 0 N(2 1 .7 / 1 4 9 .0 ) + 0 .1 0 N(7 2 .1 / 1 3 0 .0 )
t University students Winter 2 0 2 8 2 2 .8 4 9 .3 5 8 .4 7 3 .7 9 6 .3 Weibull (2 6 .8 / 2 8 4 .1 )
r High-school students Summer 4 6 8 2 2 .1 5 3 .7 6 5 .9 7 4 .2 8 2 .7 0 .8 7 N(1 9 .7 / 1 1 0 .0 ) + 0 .1 3 N(6 2 .8 / 1 4 3 .0 )
e High-school students Winter 7 0 2 2 1 .5 4 5 .6 5 6 .3 6 9 .1 8 8 .9 Weibull (2 5 .2 / 2 4 6 .3 )
Employed Summer 2 0 2 8 1 9 .8 4 8 .2 6 0 .8 6 9 .4 8 4 .5 0 .8 7 N(1 8 .0 / 9 4 .0 ) + 0 .1 3 N(5 7 .8 / 1 3 1 .0 )
Employed Winter 3 0 4 2 1 9 .7 4 2 .3 5 1 .4 6 4 .1 7 9 .1 Weibull (2 3 .2 / 2 0 8 .9 )
S Retired Summer 1 1 2 8 6 8 .2 1 0 7 .2 1 1 6 .7 1 3 4 .8 1 7 3 .0 N(6 6 .3 / 1 0 8 7 .7 )
u Retired Winter 1 1 2 8 4 7 .7 9 1 .1 1 0 3 .0 1 3 9 .2 2 0 7 .0 Erlang (5 3 .8 / 7 2 2 .5 )
b University students Summer 2 4 4 4 5 6 .1 9 0 .8 9 9 .6 1 1 3 .2 1 5 4 .2 N(5 4 .8 / 7 7 5 .3 )
u University students Winter 2 4 4 4 3 9 .1 7 5 .4 8 7 .6 1 0 9 .6 1 7 9 .9 Erlang 4 4 .5 / 4 9 4 .7 ()
r High-school students Summer 8 4 6 5 3 .7 8 3 .6 9 2 .1 1 0 7 .2 1 3 2 .6 N(5 2 .2 / 6 5 8 .6 )
b High-school students Winter 8 4 6 3 8 .5 7 1 .5 7 9 .7 1 1 8 .3 1 5 8 .6 Erlang (4 2 .6 / 4 5 3 .1 )
s Employed Summer 3 6 6 6 4 8 .2 7 7 .4 8 5 .0 9 7 .1 1 2 6 .7 N(4 7 .5 / 5 6 7 .2 )
Employed Winter 3 6 6 6 3 4 .8 6 4 .8 7 4 .5 9 8 .6 1 5 1 .6 Erlang (3 8 .5 / 3 7 0 .8 )
Key: n – size of Cartesian c ross produc t; Exx – xx perc entage of exposures less than; Emax – maximal exposure;
N – Normal distribution
Ammo nia e xpo s ure (µg/ m3)
0 .0 4
0 .0 3 2
0 .0 2 4
0 .0 1 6
0 .0 0 8
0
Re lative fre que nc ie s
2 0
0 4 0 6 0 8 0 1 0 0
µ
0 .8 7 N(1 8 .0 / 9 4 .0 ) + 0 .1 3 N(5 7 .8 / 1 3 1 .0 )
Figure 1
[ 1 9] Kre ˘s imir ˘Se ga
Distributio ns o f lo ng-te rm ho use ho ld e xpo sure to ammo nia
Enviro nme ntal Manage me nt and He alth
7 / 4 [1 9 9 6 ] 1 7 –2 0
Results
T h e ca lcu la t ed exp osu r e d ist r ibu t ion s for d iffer en t com b in a t ion s of h ou seh old a n d p op u la t ion gr ou p s, for b ot h s ea s on s, a r e p r e-sen t ed in Ta ble III. T h e size of t h e s a m p le for ea ch d ist r ibu t ion (n = t h e p r od u ct of con cen -t r a -t ion d a -t a a n d -t im e bu d ge-t d a -t a -t o-t a ls), m ed ia n (E50) a n d m a xim u m va lu es (Em a x), a s w ell a s t h e va lu es eq u a llin g or exceed in g a cer t a in p er cen t a ge of t h e r es u lt s (Exx%) a r e s h ow n . E m p ir ica l d a t a w er e fi t t ed t o s ever a l t y p es of d is t r ibu t ion s (N or m a l, Logn or m a l,
E r la n g, Ga m m a , Weibu ll). T h e good n ess of fi t w a s t est ed by Kolm ogor ov -Sm ir n ov t est . E a ch d ist r ibu t ion is p r esen t ed w it h it s exp ect a t ion a n d va r ia n ce.
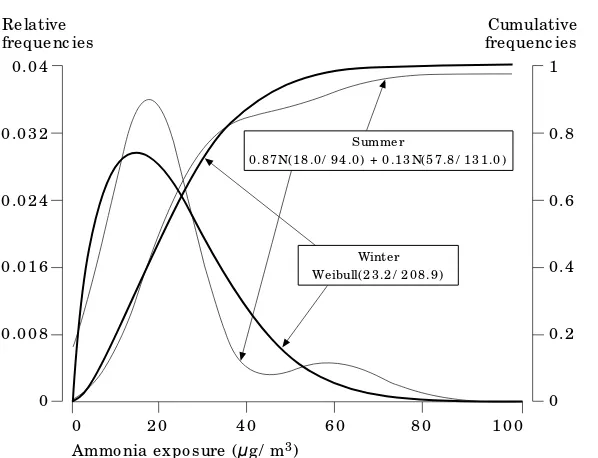
Res u lt s sh ow t h a t aver a ge exp osu r es a r e q u it e low in t h e cit y cen t r e. T h er e w a s n o sign ifi ca n t d iffer en ce b et w een su m m er a n d w in t er r esu lt s. T h e m a in d iffer en ce w a s in t h e sh a p e of d ist r ibu t ion cu r ves. Su m m er r esu lt s w er e b es t fi t t ed by a com b in a t ion of t wo N or m a l cu r ves, r esu lt in g in b im od a l d ist r ibu t ion s (F igu r e 1). T h is b im od a lit y cou ld b e exp la in ed by p os sible sou r ces of
0 .0 4
0 .0 3 2
0 .0 2 4
0 .0 1 6
0 .0 0 8
0 Re lative fre que nc ie s
2 0
0 4 0 6 0 8 0 1 0 0
Ammo nia e xpo s ure (µg/ m3)
Summe r
0 .8 7 N(1 8 .0 / 9 4 .0 ) + 0 .1 3 N(5 7 .8 / 1 3 1 .0 )
Winte r We ibull(2 3 .2 / 2 0 8 .9 )
1
0 .8
0 .6
0 .4
0 .2
0 Cumulative fre que nc ie s
µ
Figure 2
Expo s ure dis tributio ns (e mplo ye d pe o ple , c ity c e ntre )
0 .0 2 5
0 .0 2
0 .0 1 5
0 .0 1
0 .0 0 5
0 Re lative fre que nc ie s
2 0
0 4 0 6 0 8 0 1 2 0
Ammo nia e xpo s ure (µg/ m3)
Summe r N(4 7 .5 / 5 6 7 .2 )
Winte r Erlang(3 8 .5 / 3 7 0 .8 )
1
0 .8
0 .6
0 .4
0 .2
0 Cumulative fre que nc ie s
1 0 0
µ
Figure 3
[ 2 0] Kre ˘s imir ˘Se ga
Distributio ns o f lo ng-te rm ho use ho ld e xpo sure to ammo nia
Enviro nme ntal Manage me nt and He alth
7 / 4 [1 9 9 6 ] 1 7 –2 0
a m m on ia ou t d oor s. Win t er r es u lt s w er e b est fi t t ed by Weibu ll d is t r ibu t ion , s h ow in g a lon ger r igh t t a il. In F igu r e 2 r ela t ive a n d cu m u la t ive d is t r ibu t ion s for s u m m er a n d w in t er p er iod s a r e s h ow n .
Aver a ge exp os u r es in s u bu r b s w er e a b ou t t w ice a s h igh , com p a r ed t o t h os e in t h e cit y cen t r e. Su m m er r esu lt s cou ld b e fi t t ed by N or m a l a n d w in t er r esu lt s by E r la n g d is t r ib -u t ion s. T h e sea son a l d iffer en ce is obv io-u s, s h ow in g h igh er r es u lt s d u r in g s u m m er (F igu r e 3). T h is cou ld b e exp la in ed by m u ch h igh er a ir exch a n ge in t h e h ou s eh old s w it h a m b ien t a ir a s a con seq u en ce of w id ely op en ed w in d ow s d u r in g su m m er.
Discussion and conclusions
Ca lcu la t ed exp os u r e d ist r ibu t ion s va r y a m on g t h em selves in t wo w ay s: a s t h e r es u lt of d iffer en ces a m on g con cen t r a t ion levels a s s es sed for ea ch h ou s eh old t y p e (s ou r ce exist en ce a n d it s st r en gt h ) a n d t im e bu d get d a t a for ea ch p op u la t ion gr ou p. All t h e r es u lt s w er e low com p a r ed t o t h e gu id elin e va lu e of 200 µgm–3
. F r om t h e r es u lt s t h e follow in g ca n b e con clu d ed :
• T h er e is a sign ifi ca n t d iffer en ce b et w een a m m on ia exp osu r e levels in cit y cen t r e a n d s u bu r b s.
• Ou t d oor a m m on ia s ou r ces ev id en t ly con -t r ibu -t e -t o h u m a n exp os u r e in h ou s eh old s. T h e con t r ibu t ion is s ea s on a lly d e p en d en t a n d is h igh er in su m m er b eca u se of n a t u r a l ven t ila t ion t h r ou gh op en w in d ow s.
• Differ en t p op u la t ion gr ou p s exh ib it d iffer -en t exp os u r e d ist r ibu t ion s, a s a con s e-q u en ce of t h e a m ou n t of t im e t h a t m em b er s of a gr ou p sp en d a t h om e.
• Com p a r ison of t h e r es u lt s w it h t h e gu id e-lin e lim it for lon g-t er m exp os u r e t o a m m o-n ia of 200 µgm–3
s h ow s t h a t a m m on ia
exp osu r e d oes n ot p r esen t a n en v ir on m en -t a l p r oblem in Za gr eb.
References
1 Se ga , K., “Dis t r ibu t ion s of lon g-t er m h ou se-˘ h old exp os u r e of d iffer en t p op u la t ion gr ou p s t o n it r ogen d ioxid e”, J ou r n a l of E x p osu re A n a lysis a n d E n v ir on m en ta l E p id em iolog y, Vol. 5, N o. 1, 1995, p p. 35-43.
2 Se ga , K., “For m a ld eh yd e exp osu r e d ist r ibu -˘ t ion s in Za gr eb h ou s eh old s. Is t h er e a n eed for ch a n gin g t h e p r op osed con cen t r a t ion lim it va lu es ?”, S cien tifi c a n d R egu la tor y A sp ects of A ir Qu a lity M a n a gem en t A ir ’95, 7-9 J u n e 1995, St P et er sbu r g, Ru ssia n Fed er a t ion , Ab st r a ct s 227-28.
3 Se ga , K., F u ga ˘s, M. a n d Ka lin i ´c, N., “In d oor˘ con cen t r a t ion levels of select ed p ollu t a n t s a n d h ou s eh old ch a r a ct er is t ics”, J ou r n a l of E x p o-su re A n a lysis a n d E n v ir on m en ta l E p id em iol-og y, Vol. 2 N o. 4, 1992, p p. 477-85.
4 In d oor A ir Pollu tion a s a R elev a n t Fa ctor in H u m a n E x p osu re, J oin t B oa rd Pr oject IM I-Z a g reb -US E PA , Fin a l R ep or t, IMI-I-Za gr eb, 1989. 5 Si ˘s ov i ´c, A. a n d F u ga ˘s, M. “Ap p lica t ion of˘
im p r e gn a t ed fi lt er s t o d et er m in a t ion of sm ok e a n d a m m on ia ”, E n v ir on m en ta l M on itor in g a n d A ssessm en t, Vol. 9, 1987, p p. 101-4.
6 M oh r y, H . a n d Reid el, H .G. (E d s), “Rein h a lt u n g d er Lu ft . VE B Deu t sch er Ver la g fü r Gr u n d -s t offin d u -st r ie”, Leip zig, p. 61.
7 Se ga , K. a n d F u ga ˘s, M., “Tim e bu d get a s a˘ fa ct or r ela t in g in d oor a ir p ollu t ion t o t ot a l h u m a n exp osu r e”, Pr oceed in gs of T h e In ter n a -tion a l Con feren ce – In d oor Clim a te of B u ild in gs, In d oor A ir Qu a lity in Cen tra l a n d E a ster n E u r op e, ˘St r b s k e P leso, 29 Se p t em b er -2 Oct ob er, Slovo Lt d , Br a t islava , 1992, p p. 63-72.
8 Du a n , N. “ St och a st ic m icr oen v ir on m en t m od els for a ir p ollu t ion exp osu r e”, J ou r n a l of E x p osu re A n a lysis a n d E n v ir on m en ta l E p id em iolog y, Vol. 1 N o. 2, 1991, p p. 235-57. 9 “Act a b ou t a ir exch a n ge a n d q u a lit y in