THE APPLICATION OF SUPPORT VECTOR MACHINE (SVM) USING CIELAB
COLOR MODEL, COLOR INTENSITY AND COLOR CONSTANCY AS FEATURES FOR
ORTHO IMAGE CLASSIFICATION OF BENTHIC HABITATS IN HINATUAN,
SURIGAO DEL SUR, PHILIPPINES
J. E. Cubillasa,*, M. Japitanaa,*
aPhil-LiDAR 2.B.14, College of Engineering and Information Technology, Caraga State Univeristy, Butuan City, Philippines
Commission VII, WG VII/4
KEY WORDS: Benthic habitat mapping, Image processing, CIELAB, Color science, OBIA, SVM
ABSTRACT:
This study demonstrates the application of CIELAB, Color intensity, and One Dimensional Scalar Constancy as features for image recognition and classifying benthic habitats in an image with the coastal areas of Hinatuan, Surigao Del Sur, Philippines as the study area. The study area is composed of four datasets, namely: (a) Blk66L005, (b) Blk66L021, (c) Blk66L024, and (d) Blk66L0114. SVM optimization was performed in Matlab® software with the help of Parallel Computing Toolbox to hasten the SVM computing speed. The image used for collecting samples for SVM procedure was Blk66L0114 in which a total of 134,516 sample objects of mangrove, possible coral existence with rocks, sand, sea, fish pens and sea grasses were collected and processed. The collected samples were then used as training sets for the supervised learning algorithm and for the creation of class definitions. The learned hyper-planes separating one class from another in the multi-dimensional feature space can be thought of as a super feature which will then be used in developing the C (classifier) rule set in eCognition® software. The classification results of the sampling site yielded an accuracy of 98.85% which confirms the reliability of remote sensing techniques and analysis employed to orthophotos like the CIELAB, Color Intensity and One dimensional scalar constancy and the use of SVM classification algorithm in classifying benthic habitats.
1. INTRODUCTION
This study aims to develop a classification techniques for benthic habitat mapping which may interest remote sensing and marine research community. Benthic habitat mapping is an important tool to study the trends of local landscape changes, anthropogenic disturbances on benthic organisms, and climate changes. Various area utilizations can be proficiently planned by having prior knowledge about certain habitats and their changing tendencies especially that coastal areas represent a very dynamic case regarding their locations. Directory of Remote Sensing Applications for Coral Reef Management (2010) has shown certain requirements for data archiving and imagery used for creating benthic habitat maps.
Now, Very high spatial resolution optical satellites can now provide 0.5-meter and below pixel resolution. However, in high spatial resolution images, the problem of within-class spectral difference, and between-class spectral similarities would reduce the separability among different land cover/land class types (Blaschke, 2010). Pixel-based analysis and classification is acceptable only if the spatial resolution of the imagery is coarse (Hay, Marceau, Dube, & Bouchard, 2001). With focused attention on limitations of traditional pixel-based classification methods on varying spatial resolution images, the need for a more advanced and appropriate technique arises.Though, this images are expensive especially to buy a costly per tile spectral images or buy an expensive Unmanned Aerial Vehicle (UAV) for image acquisition, ordinary researcher and students need more funds to assess their needs to develop a certain objective. An easy way to access data is through downloading LandSat images at United States Geological Survey (USGS) website using Earth Explorer (earthexplorer.usgs.gov). However, due to the resolution capability of LandSat, the accuracy of the data might be low. In LandSat and other spectral images, it is often necessary to download data files re-calibrated and analyse
locally, a difficult and time-consuming process if data with different formats and resolutions were used. In marine/water resources mapping, some researchers used their efforts and
talents to acquire data such as creating “Do it yourself” (DIY)
Kite Aerial Photography (Currier, 2014) with the used of camera with NIR capability and manually geo-rectified those acquired images. Some scientist used low-cost or build their
own UAV’s. In this study developed a method were low cost
RGB images can be used as datasets in classification. Any sort of camera with good resolution might be a tool to acquire such images with the absence of Near Infrared (NIR) band.
To ease with traditional pixel based, the researchers used Object Based Image Analysis. Object Based Image Analysis (OBIA) is a sub-discipline of GIScience devoted to partitioning remote sensing (RS) imagery into meaningful image objects, assessing their characteristics through spatial, spectral and temporal scale (Hay and Castilla, 2006). OBIA requires image segmentation, classification, and ability to link individual objects. Weih et al (2012) shown that object-based classification methodologies has taken an advantage of both the spectral and contextual information in remotely-sensed imagery.
∗= / (1) ∗= � �� �/ � (2)
Equation: (1) a* coordinate, (2) b* coordinate
Figure 1. CIELAB Color Space (adopted from www.Bonlalum.com)
In consideration of the RS data requirements for benthic habitat mapping, this study will utilize ortho images with 0.5-meter resolution. And, to address the problem on pixel-based classification of high resolution images, we adopt the methods of Jacobson, Gupta, and Cole (2007) in using CIELAB as basis for identifying feature in satellite imagery and employ OBIA to classify benthic habitat in the study area. Instead of using traditional index ratios, we applied color and image recognition using the following features: CIELAB, Color Intensity, and One dimensional scalar constancy (Lukac and Plataniotis, 2007).
= ln − ln + ln + ln − 2 ln (3)
Equation: (3) First Coordinate, (4) Second Coordinate, (5) RGB Intensity
There are many algorithms that can be employed to classify objects in an image. Among these algorithms, Support Vector Machine algorithm (Vapnik, 1995 and Burges, 1998) has gain popularity in classification, regardless of amount of samples and features used. Support vector machine can handle multi-dimensional features in which it could generate good classification. Using Matlab® as our program scheme and using the concept of Optimization of the SVM Regularization Parameter C in Matlab® (Candare et.al, 2015), where the user can extract parameters for discriminating classes. This parameters are the threshold condition used for eCognition®. Thus, this paper explores image analysis of orthophotos of the coastal areas of Hinatuan, Surigao Del Sur to map the extent of benthic habitats. Our methods explores object-based paradigm in which pixels are grouped into objects for classification where
the SVM algorithm was employed for definite classification of the objects
.
2. METHODOLOGY
2.1 Process Flow
In Fig. 2 explains the methodologies used for analysing ortho images for mapping benthic habitats. First, the images undergo quality checks to ensure the quality and imagery requirements in delineating benthic habitats. In OBIA, the image is being segmented based on multi-resolution segmentation by using with Scale Parameter of 5, Shape at 0.3, and Compactness at 0.5. Then, collection of samples of the objects per class is initiated for developing a database for the SVM’s input as training objects. A total of 134,516 objects were collected as training samples to create class definitions for the supervised learning algorithm. Fig. 3 to Fig.7 describes each class based on visual interpretation. The SVM demonstrates the ability to separate and creating boundaries called the hyper-planes per class for classification. Matlab® does the extraction of hyper-plane parameters. The accuracy of the SVM classified images will then be assessed in order to know its reliability.
Figure 2. Processing diagram for creating benthic habitat map
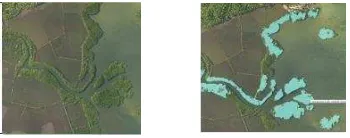
Fish Pens: This class depict fishermen’s methods in aquaculture like fish cages, mussels farming, and Eucheuma farming.
Figure 3. Fish Pens
Mangrove: This class is composed of all types of mangroves. Various aspects of mangroves can be mapped including their location and general zonation.
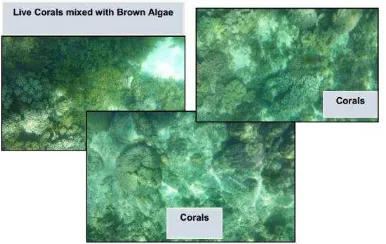
Possible Coral Existence with Rocks: This class is composed of areas with possible coral reefs which can be seen clearly in shallow seawater. This class may also include some rocks that has macro-algae, rocks with organisms and possible dead corals with sea grasses that resembles coral reefs on the image.
Figure 5. Possible Coral Existence with Rocks
Sea grasses: The extent of sea grass beds where seawater is fairly clear.
Figure 6. Sea grasses
Sand and Sea: Sand and Sea coverage distinguishable in the images.
Figure 7. Sand and Sea Candidate
As indicated at Fig. 8, for the mapping of benthic features, a supervised SVM classification has been carried out using the available RGB images, detailed separability assessment was conducted using the feature plots shown in Figure 9.
Figure 8. SVM and Rule set development Process Flow
Figure 9. Sample 3D Plots of Different Features used in SVM Optimization in Matlab
2.2 Field Validation Surveys
Among the other coastal municipalities visited in Surigao Del Sur, the municipality of Hinatuan has the widest coastal area. A series of end-to-end validation surveys were conducted to generate benthic classification data in fifteen coastal areas within the study site where documented photos during surveys are shown in Fig.10 and Fig. 11. Fig 12. Shows all the validated points in the study site.
Figure 10. Benthic habitat validated in the coastal area of Cambatong, Hinatuan, Surigao Del Sur
Figure 11. Validation areas with corals in the study site Support Vector Coefficients (w)
Create new “Arithmetic Feature” in eCognition® [(w1a*N1) + (w1b*N2) +… (w1nNn)]
“Class” Definitions and parameter assignments
Classified Objects Samples SVM Optimization in Matlab
LibSVM
Figure 14. Blk66L024 (Overall Accuracy: 96.3 % KIA: 95 %) Figure 12. Sample map of actual validated points in selected
coastal areas in Hinatuan, Surigao Del Sur
3. RESULTS AND DISCUSSION
3.1 Classified Images
Applying the learned hyper-planes extracted from Matlab®, this parameters will be the threshold condition between those classes. This threshold condition determines the boundaries of each class to discriminate this class from other classes.
Figure 13. Blk66L005L (Overall Accuracy: 98 %, KIA: 97.2 %)
Figure 15. Blk66L021 (Overall Accuracy: 97.3 % KIA: 96.5 %)
Figure 17. Sample Site Accuracy Assessment of Blk66L0114
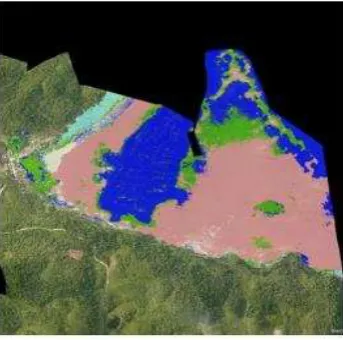
As shown in Fig. 13 to Fig. 16, the classified images yielded very high classification accuracies ranging from 96.3% to 98.8%. However, the benthic habitat maps generated for this study must be further validated in the field to ensure its reliability. In the classified maps generated for this study, it can be observed that the class “Possible Coral Existence with must be established to distinguish live coral covers from dead corals with brown microalgae. On the other hand, the SVM algorithm performs well in classifying sea grass (in areas where there is dense sea grass), but fails to classify sea grass in areas where sea grass is sparse as can be observed on the field validation results.
4. CONCLUSION
High overall accuracies were obtained for the classification of benthic habitats in the sampling site (98.85%) as shown in Fig. 17. With this, the researchers conclude that using such color transformation and illumination correlated with orthophotos can indeed give good classification. Specific derivation from the RGB images for benthic habitats, features like CIE L*a*b*, Color Intensity, and One Dimensional Scalar Constancy can prove to be reliable features in discriminating other benthic habitat classes. Further results of this study established a baseline method for benthic habitat mapping that can also aid in implementing studies on coastal cover changes, coastal monitoring, and coastal pollution monitoring.
ACKNOWLEDGEMENTS
We would like to thank the Department of Science and Technology-Grants in Aid (DOST-GIA) and Philippine Council for Industry, Energy and Emerging Technology Research and Development (DOST-PCIEERD) for funding this research and the administration of the Caraga State University for the strong support given to the Phil-LiDAR 2 research team. And to the whole Phil-LiDAR 2 team for the technical and In: IOSR Journal of Electronics and Communication Engineering (IOSRJECE) ISSN: 2278-2834 Volume 1 Issue 2, pp 24-45.
Blaschke, T. (2010). Object Based Image Analysis for Remote Sensing. In: ISPRS Journal of Photogrammetry and Remote Sensing, 2-16.
Burges, C., 1998. A Tutorial on Support Vector Machines for Pattern Recognition, Data Mining and Knowledge Discovery, Kluwer Academic Publishers.
Candare, R.J., Japitana, M., Cubillas, J.E., Ramirez, C.B., 2015. Optimization of the SVM Regularization Parameter C in Matlab for the Object-Based Classification of High Value Crops using LiDAR Data and Orthophoto in Butuan City, Philippines, In: The 36th Asian Conference on Remote Sensing, Philippines.
Chauvaud, S., 1998, Remote sensing techniques adapted to high resolution mapping of tropical coastal marine Ecosystems (coral reefs, seagrass beds and mangrove). In: International Journal of Remote Sensing, Volume 19, Issue 18, pp. 3525-3639.
Chih-Chung Chang and Chih-Jen Lin, 2001. LIBSVM: A Library for Support Vector Machines, National Taiwan University, Taipei, Taiwan.
Coral Reef Targeted Research & Capacity Building for Management Program, 2010, Directory of Remote Sensing Applications for Coral Reef Management, Currie Communications, Melbourne, Australia.
Eugenio, F., 2015. High-Resolution Maps of Bathymetry and Benthic Habitats in Shallow-Water Environments Using Multispectral Remote Sensing Imagery. In: IEEE Transactions on Geoscience and Remote sensing, Vol. 53, No. 7.
Archives of the Photogrammetry, Remote Sensing and Spatial Information Sciences, Beijing, China, Vol. XXXVII, pp. 41-44.
Ganesan, P., Rajini, V., Sathish, B.S., and Shaik, K.B., 2014, CIELAB Color Space based High Resolution Satellite Image Segmentation using Modified Fuzzy C-means Clustering. In: MAGNT Research Report, Vol 2, pp 199-210.
Hay, J. G., and Castilla, G. 2006. Object-Based Image Analysis: Strengths, Weaknesses, Opportunities and Threats (SWOT). In: International Symposium on Remote Sensing.
Hay, G., Marceau, D., Dube, P., and Bouchard, A., 2001. A Multiscale Framework for Landscape Analysis: Object-Specific Analysis and Upscaling. Landscape Ecology, 16 (6), 471-490.
Jacobson N., Gupta, M., and Cole J., 2007. Linear Fusion of Image Sets for Display. In: IEEE Transactions on Geoscience and Remote Sensing, Vol. 45, No.10, pp 3277-3288.
Japitana, M., and Candare, R.J., 2015. Optimization of the SVM Regularization Parameter C in Matlab for Developing Rule-sets in eCognition. In: ISRS 2015 Proceedings, Tainan, Taiwan, pp. 530-533.
Kaur, G., and Kaur P., 2015. Face Recognition Using YCbCR and CIE lab Skin Color Segmentation Methods: A review. In: International Journal of Advanced Research in Computer Engineering & technology (IJARCET), Volume 4 Issue 4, pp 1274-1276.
Klemas,V., 2011. Remote Sensing Techniques for Studying Coastal Ecosystems: An Overview, In: Journal of Coastal Research: Volume 27, Issue 1, pp 2-17.
Kolednik, D., 2014. Coastal Monitoring for Chang e Detection Using Multi-temporal LiDAR Data, In: Central European Seminar on Computer Graphics CESCG 2014.
Lukac, R., and Plataniotis, K., 2007. Color Image Processing Methods and Applications. 6000 Broken Sound Parkway NW: CRC Press. pp 9-11, and pp 65-67.
Mishra, D., 2006. Benthic Habitat Mapping in Tropical Marine Environments Using QuickBird Multispectral Data, In: Photogrametric and Engineering & Remote Sensing, Vol. 72, No. 9, pp. 1037–1048.
Vapnik, V., 1979. Estimation of Dependencies Based on Empirical Data. Nauka, Moscow, pp.5165 -5184.
Navulur, K., 2007. Multispectral image analysis using object-oriented paradigm, CRC Press, 6000 Broken Sound Parkway NW.
Weih, R., 2012. Object-Based Classification vs. Pixel-Based Classification: Comparative Importance of Multi-resolution Imagery. In: The International Archives of the Photogrammetry, Remote Sensing and Spatial Information Sciences, Vol. XXXVIII-4/C7.


