AUTOMATING THE PHOTOGRAMMETRIC WORKFLOW IN A NATIONAL
MAPPING AGENCY
David Hollanda, Catherine Gladstonea, Isabel Sargenta, Jon Horgana, Andrew Gardinera, Mark Freemana
a
Ordnance Survey, Research, Adanac Drive, SOUTHAMPTON, United Kingdom, SO16 0AS - (David.Holland, Catherine.Gladstone, Isabel.Sargent, Jon.Horgan, Andy.Gardiner,
Mark.Freeman)@ordnancesurvey.co.uk
Commission IV, Working Group IV/3: Mapping from High Resolution Data
KEY WORDS: Mapping, Land Cover, Change Detection, Updating, Object,
ABSTRACT:
The goal of automating the process of identifying changes to topographic features in aerial photography, extracting the geometry of these features and recording the changes in a database, is yet to be fully realised. At Ordnance Survey, Britain’s national mapping agency, research into the automation of these processes has been underway for several years, and is now beginning to be implemented in production systems.
At the start of the processing chain is the identification of change – new buildings and roads being constructed, old structures demolished, alterations to field and vegetation boundaries and changes to inland water features. Using eCognition object-based image analysis techniques, a system has been developed to detect the changes to features. This uses four-band digital imagery (red, green, blue and near infra-red), together with a digital surface model derived by image matching, to identify all the topographic features of interest to a mapping agency. Once identified, these features are compared with those in the National Geographic Database and any potential changes are highlighted. These changes will be presented to photogrammetrists in the production area, who will rapidly assess whether or not the changes are real. If the change is accepted, they will manually capture the geometry and attributes of the feature concerned.
The change detection process, although not fully automatic, cuts down the amount of time required to update the database, enabling a more efficient data collection workflow. Initial results, on the detection of changes to buildings only, showed a completeness value (proportion of the real changes that were found) of 92% and a correctness value (proportion of the changes found that were real changes) of 22%, with a time saving of around 50% when compared with the equivalent manual process. The completeness value is similar to those obtained by the manual process. Further work on the process has added vegetation, water and many other rural features to the list of features that can be detected, and the system is currently being evaluated in a production environment.
In addition to this work, the research team at Ordnance Survey are working with the remote sensing (data collection) department to develop more efficient methods of DSM and DTM creation; more automated seamline-generation for the creation of orthoimage mosaics; and methods to automatically record simple building heights on buildings in the database. These are all methods that have been proven in a research environment – the challenge is to implement them within the working environment of the existing data collection process.
1. INTRODUCTION
1.1 Motivation
One of the major tasks of a National Mapping Organisation is to maintain the topographic database to ensure that it is as up to date as possible. At Ordnance Survey, Britain’s national mapping agency, one of the key performance targets set by Government is: “To ensure that 99.6% of significant real-world features, which are greater than six months old, are represented in Ordnance Survey’s geographic data”. In order to meet this target, several sources of change information (or “change intelligence”) are consulted. The first source of information is the network of Ordnance Survey surveyors, working across the country to update the National Geographic Database of Great Britain (used to create the OS MasterMap® Topography Layer). These surveyors will report any new features or demolitions they note in the course of their travels. Another source of information is the local authority planning departments, who will report any planning applications which are likely to result in significant changes. Change intelligence is also obtained
from property developers, and via the services of change intelligence contractors. Despite these various sources of information, many changes to the landscape, including significant new buildings, are not known to Ordnance Survey in advance and are only detected by a photogrammetrist at the point of data capture. In the past, a dedicated change intelligence team has been employed within the photogrammetry department, to scan through all images prior to data capture and to highlight any areas where they believe change to have occurred since the last revision of the topographic data. This is a labour-intensive process, which inevitably slows down the rate of data capture.
1.2 Background
The detection of topographic change using aerial or satellite images has a long history, and is still a topic of research in many parts of the world (Baltsavias, 2004, Champion et al., 2009). A related topic is the verification of existing databases, using automatic image classification techniques (Gerke & Heipke 2008). Various techniques have been evaluated at Ordnance Survey in the past, including image-to-image comparison; Digital Surface Model (DSM) comparison; edge detection; and primitive object detection (Tompkinson et al. 2003). Many approaches rely on the availability of similar data from two different epochs – e.g. an image from 5 years ago and an image from today. In this research, it was concluded after an initial investigation that a more practical approach would be to compare a new image with an existing topographic database – in effect to find only those changes which would entail a change (addition, deletion or modification) to a feature in the database. This removes the need to have an archive of images, and also removes any need to reconcile one type of image (e.g. a scanned true colour image) with another (e.g. a 4-band digital image). Having decided on this course of research, we undertook an investigation into different methods of comparing imagery and vector data. Possible solutions include:
3. Performing an image classification and comparing classified objects/pixels with the attributes of the features in the vector data.
Solution 1 depends on the features in the topographic database having common characteristics in the image (e.g. similar coloured building roofs; uniform vegetation types). This proved to be far from the case in Britain, where there is a wide heterogeneity in characteristics, of both the built and the natural environment.
The identification of edges and corners, as in Solution 2, works to some extent, especially in the case of buildings and other regular manmade structures. However, when using edges only, there are many occasions in which an edge in the image does not match with a line in the topographic data, either because the feature is not included in the specification of the database or because the line does not represent a permanent feature at all (such as in the case of plough-lines in agricultural fields). Edge detection was, however, found to be useful when combined with other techniques, so in the later versions of the software an element of edge detection was included.
The third solution, involving an image classification followed by a comparison of the image features with the database features, proved to show the most potential and was the main method subsequently used in this research.
1.3 Image classification
Many different methods of image classification are available, using both pixel-based and object-based techniques. In our Research department, we had undertaken several projects in the past using traditional techniques such as maximum likelihood classification and more advanced techniques such as super-resolution pixel-swapping (Thornton et al. 2006). While these had given reasonable results in a research environment, it was felt that they were not reliable enough to be viable in a production process. It was therefore decided to investigate several different techniques of image classification and to
compare their results. The methods investigated were Support Vector Machines, CART Decision Trees and eCognition object-based classification (for details see Gladstone et al. 2007). In the classification of buildings, all three techniques produced classification accuracies better than 70% using spectral data (4 band imagery); and accuracies better than 85% using spectral data and digital surface models as input data. The results using eCognition object-based classification showed the highest accuracies, consequently this technique was the one chosen to develop further.
2. METHODOLOGY
2.1 Input data and study areas
In order for the change detection process to be viable, one of the criteria for this research was that the input data had to be readily available to Ordnance Surveys’ production department (Data Collection & Management). At the time of the initiation of the research, the imagery used in production was from the Intergraph Z/I Imaging Digital Mapping Camera (DMC). The camera produced 4-band multispectral imagery (red, green, blue and near infra-red) and high-resolution panchromatic imagery, with approximate ground sample distances of 80cm and 20cm respectively. In the photogrammetric production area, topographic information is collected using pan-sharpened 3-band (RGB) imagery. In order to preserve the information in the image as much as possible, for the change detection work the original 4-band imagery was retained. The only processing applied to the images was orthorectification, in order to match the coordinate reference system of the existing topographic data. The first attempts to classify these images used only the spectral data, but subsequently it was found that the introduction of a digital surface model (DSM) greatly improved the classification accuracy. The DSMs used (50cm post spacing) were obtained from the contemporaneous panchromatic imagery, using the image matching process in BAE Systems’ SOCET-SET (the ATE module in the early days of the research and the NGATE module in later versions). Some existing topographic data was also used as input. OS MasterMap road polygons were used to mask areas which were known to be roads. The detection of changes to roads was not part of the original requirement, since such changes are almost always reported from external sources. Using road polygons as input allowed us to disregard parked vehicles along the roadsides, which could otherwise be mis-identified as small buildings or other man-made structures.
A final source of input was the OS Land-Form PROFILE® digital terrain model (DTM), used to give an indication of the height of the bare-earth beneath all the topographic features. The DTM was an existing long-standing Ordnance Survey product which, although of some use to the process, at 5m post spacing and 2.5m RMSE, was not of the same level of geometric accuracy as the DSM created from the imagery. Our main focus was the detection of changes to buildings, but in order to do this, other classes of object had to be identified and then eliminated as being “non-buildings”. The classes we were interested in detecting were as follows:
• Buildings
• Low Vegetation (grass, crops) • High Vegetation (trees and shrubs) • Water
• Man-made surfaces
beyond this by developing a robust classification process which could be used on any area of Great Britain and was, as far as possible, independent of the date and time of data capture. In order to do this, several test sites were chosen, from both urban and rural areas, and from different times of the year. One constraint that we could not overcome was that the vegetation in the imagery had to be in leaf, so only imagery from spring until late summer could be used.
The first experiments were carried out on imagery from the Heathrow area, west of London, and concentrated mainly on the identification of changes to buildings. Later work expanded the process to identify changes to areas of natural and agricultural vegetation, field boundaries, walls, fences, man-made surfaces and areas of water. For these experiments, images from various parts of the country including cities, towns and countryside regions, were tested.
2.2 Dealing with change
On several occasions during the development of this work, the subject of change arose not only in the requirement to detect topographic change, but also as a part of the development process itself. In addition to minor changes such as alterations to the capture specification and the adoption of a new database management system, two major changes to affect the research were:
1. the requirement from our production area to move from the detection of buildings in urban areas to the detection of all types of topographic feature in more rural areas.
2. the acquisition of a new digital camera partway through the project.
The change to the requirement entailed a rethinking of the classification process, adding new classes and developing an extended ruleset which could detect all the features required by the production area. This was not a trivial exercise, since most of our work up to that point had been focussed on changes to buildings, while the classification of other features (vegetation, water, etc.) was simply used to identify things that were not buildings. In the revised version, these other features were more important in their own right, as the identification of changes to woodland, hedges, sealed land surfaces and water features was needed. At this point, the introduction of edge-detection techniques was included, to enable the edge-detection of changes to linear features such as hedges and fences.
In 2011, the DMC camera was replaced with two Microsoft Vexcel Imaging UltraCam-Xp cameras. Compared with the DMC, these had a larger footprint; slightly different spectral responses; a 3:1 (rather than 4:1) panchromatic:multispectral pixel size ratio; a 14-bit spectral resolution (compared to 12-bit) and a completely different processing system to convert the imagery from its raw format to a form usable in production. To make things even more challenging, the new cameras were flown at a height enabling a GSD of 15 cm (pan) and 45 cm (multispectral). All these changes had to be accommodated in a revised classification ruleset. Since the rules had been designed for flexibility right from the start, this was not as difficult a task as it could otherwise have been.
2.3 Object-based Image Classification
The eCognition object-based classification process is well known in the remote sensing community (see for example Carleer & Wolff, 2006 and Greiwe & Ehlers, 2005). In addition to using the spectral information within an image, this approach uses image texture, the shape of objects within the image, and the context of each object in relation to its
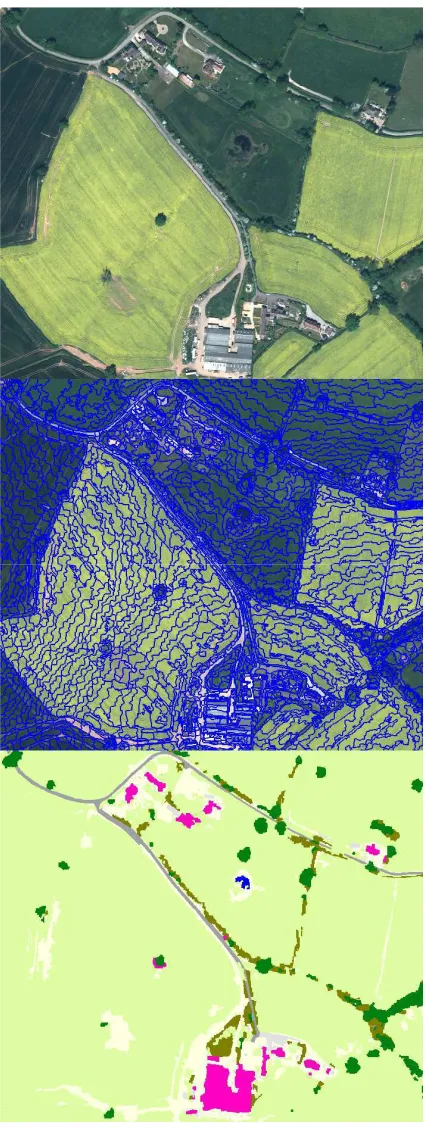
neighbours. The first stage of the process is a segmentation of the image into homogeneous areas, based on the spectral data (Figure 1b). As noted above, the use of a DSM as an extra input was found to increase the accuracy of the classification, so in all but the earliest tests a DSM was also used in the segmentation stage.
Figure 1. a) An image of a rural area, b) the corresponding segmentation in eCognition, and c) the final classification. Buildings are in pink, grassland in pale green, sealed surface in light grey, roads in dark grey, trees in dark green, water in blue
eCognition allows the user to define parameters to control the segmentation process. It was found that, to obtain the best results for change detection, an over-segmentation was required, in which small changes in the input data will trigger a new segment to be created. Although this produces a classification with many more segments than there are truly discrete parcels of land cover, subsequent processing rectifies this - producing a better result than would have been obtained if larger segments were used in the first place.
The second stage in the process is the automatic assignment of a class to each segment (Figure 1c). This is effected by the use of a set of rules which uses both the input data (spectral information and DSM) and derived data (slope, texture, context) to assign a class to each segment. The classes used in the latest version of the classification are: Buildings, Trees, Scrub, Grass and Crops, Water, Sealed surfaces (e.g. asphalt, concrete), Roads, and Bare earth (unsealed surfaces).
The ruleset has been built up using data gathered over several years, to ensure that it is robust enough to cope with the many different geographical areas and lighting conditions under which it may be used. One way to help in this was to use ratios of spectral bands rather than absolute spectral values in the classification and by relying on the DSM data as much as possible as this is unaffected by image variations. The final classification is of very high accuracy (Gladstone et al. 2007) and is achieved completely automatically with no pre-calibration or training information required.
2.4 Detecting change
Once the objects in the imagery had been classified, each object was compared with the features in the topographic database (i.e. the source data from which the OS MasterMap Topography Layer product is derived). For linear features such as walls and fences the edge detection results were used rather than the classification. Features in the image which could not be found in the database were flagged as potentially new features; while features in the database which could not be found in the image were flagged as “potential demolitions” (this phrase was used at first in the context of buildings, where it is a natural description of the process. Later, when applied to other features, it sounded rather less apt – hearing people talking about “the demolition of water” was likely to cause a few quizzical looks around the changes, or “change candidates”, were marked and recorded in the GUI. A member of the change detection team was then guided to each potential change in turn and was given the option to either accept or reject the change, based on their expert knowledge of image interpretation. All the accepted changes were then passed on to a photogrammetrist who captured the changes and updated the topographic data.
2.5 Completeness versus correctness
The main aim of this change detection process was to guide the human operator and hence reduce the time taken to update the topographic database. In order to optimise this process, it was necessary for the algorithm to detect a very high percentage of the true changes present in the scene (i.e. the completeness should be a high value). This was achieved at the expense of a low correctness value – i.e. the algorithm identifies many
regions which are not true topographic changes. This was found to be acceptable by the operators in the data collection department, whose main aim was to find as many of the real changes as possible. While the large number of false positives is not ideal, they are very easy to deal with during the manual verification stage of the process.
3. RESULTS AND CONCLUSIONS
3.1 Change detection accuracy
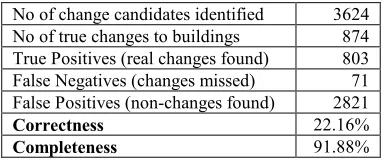
During the first iteration of the change detection system, it was tested on an urban area north of London and was focussed on the identification of changes to buildings. A test in the Data Collection & Management production area was undertaken to determine whether the code developed and tested in research was suitable for production work. The test area was a 20 km by 20 km block in Hertfordshire, north of London. This area was chosen to ensure that there were a large number of changes to identify, which would give a sufficient indication of the performance of the process in a production environment.
No of change candidates identified 3624 No of true changes to buildings 874 True Positives (real changes found) 803 False Negatives (changes missed) 71 False Positives (non-changes found) 2821
Correctness 22.16%
Completeness 91.88%
Table 1. Statistics of the results of the urban production trial.
The statistics of the urban change detection results are shown in Table 1. Note that the completeness value is almost 92% (803 real changes identified out of the total 874 changes in the scene). This is similar to the completeness value expected in the equivalent manual process. The correctness value of around 22% is quite low, but was not unexpected, as the emphasis was on finding most of the real changes, rather than on ensuring that most of the detected changes were real.
As a result of the production trial, the Photogrammetric Services department sponsored further research, in order to expand the process beyond the original building change detection to full topographic feature change detection. This entailed the re-writing of the ruleset, both to include more of the features we wanted to detect; and to update the rules to fit with the newly-acquired Vexel UltraCam-Xp camera.
• New linear features (e.g. fences, walls, roads, tracks) > 25m long
• Demolished linear features > 8m long
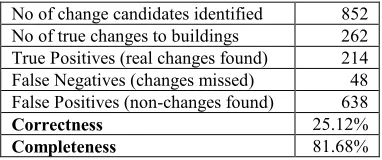
The accuracy statistics for this second trial are shown in Table 2. The completeness value of about 82% is lower than that of the first trial, but it must be remembered that the first trial only looked for changes to buildings, while the second trial was attempting to identify changes not just to buildings, but to many other topographical features. The running of the trial
No of change candidates identified 852 No of true changes to buildings 262 True Positives (real changes found) 214 False Negatives (changes missed) 48 False Positives (non-changes found) 638
Correctness 25.12%
Completeness 81.68%
Table 2. Statistics of the results of the rural production trial.
Using contractor imagery of a slightly lower spatial resolution than that normally captured by our own camera (25 cm GSD compared to 15 cm GSD for the panchromatic images) enabled us to prove that the change detection process is not restricted to a given spatial resolution, nor is it dependent on our own image production system.
Having proved that the change detection process works in a rural area, a full production trial is due to begin in early 2012, using imagery from our own UltraCam-Xp camera and staff from the Remote Sensing production area (previously known as Photogrammetric Services).
3.2 Related work
During the course of this research, several other initiatives were underway between the Research department and the Data Collection & Management department. Several of these initiatives have started as a result of the change detection work, either because they helped provide better input data to change detection, or they were generated as a by-product of the change detection flowline. Some of these initiatives are described in this section.
3.2.1 DSM and DTM generation: The change detection process detailed above is dependent upon a good quality digital surface model which, for example, facilitates the discrimination between low and high vegetation, and between sealed surfaces and buildings. In the past, it has often been assumed that, in order to produce a high quality, positionally accurate DSM, a lidar point cloud is required. Champion et al. (2009) showed that DSMs derived either from lidar or from image-matching techniques could be used in a change detection context. In our case, we wanted to use data that was already available to the production staff, so it was decided early on that we would not use lidar data (we do not use lidar in a production context, and were unlikely to do so in the foreseeable future). Advances in the development of image matching algorithms meant that we were able to generate high-quality DSMs using as input the same images that were used in the day-to-day topographic data
capture flowlines (and, of course, were also used for change detection). These DSMs, at a post spacing of 0.5m, have an RMSE of 1m or less – a level of accuracy which was found to provide very satisfactory results in the change detection process. Research into DSM and DTM creation has involved the use of various techniques to streamline the process and also to enhance the positional accuracy of the resulting product. Initial DSMs were created using the NGATE module of SOCET-SET. Building footprints from the topographic database were used to filter out built-up areas within the DSM. Vegetation polygons, identified using the same image classification as applied in the change detection process, were used to filter out woodland and scrub areas within the DSM. Given these inputs, a filtered digital elevation model which closely matches the bare earth surface can be automatically created from the DSM. Further manual work is needed to add breaklines along certain features, but the initial automatic process saves a lot of manual processing.
3.2.2 Land cover classification: One obvious by-product of the change detection process is a land-cover classification. Although tuned towards change detection, the system identifies features such as woodland, water, sealed surfaces and grassland/agricultural land which could be used in their own right, either to enhance existing topographic data, or to generate potential new products. Work on this is at a very early stage and no new land-cover datasets are currently in the pipeline, but if in future it is decided to enhance the land cover content of Ordnance Survey products, the mechanism to initiate this is already in place.
3.2.3 3D data collection: Work on the capture and storage of 3D features has been a recurrent research topic for many years. To date, the only 3D products available from Ordnance Survey have been the digital terrain models Land-Form PROFILE® and Land-Form PANORAMA®. The Research department has been working with the Remote Sensing production department to use some of the expertise gained in research to help add 3D content to the topographic data. This has included the enhancements to the DTM creation mentioned above, but also includes derived products based on a high-quality DSM and the existing 2D topographic building polygons. A method has been developed to automatically add simple building heights to these polygons, using software already available in the production area. This last point is crucial, as it should allow a much smoother transition from research project to production system.
between the research staff and the production team, in order to ease the introduction of new software into the production process.
3.3 Conclusion
The change detection process described here has been created over a number of years, and has been improved to the point where it is hoped that it will be implemented in a full production environment. The issue of the large number of false positives produced by the process is one which we have discussed at length within our research team. Although we know that we can reduce the number of false positives by changing the rulesets, this is always at the expense of finding fewer true positives – a situation which is not acceptable to our production team. We may return to this topic at a future date, but the limitations of the current system and especially the complex nature of the imagery and the topographic data specification, lead us to conclude that it is unlikely that we will be able to significantly improve on our current results.
This paper has shown how a change detection process has evolved over time, developing into a system which can be deployed in a production area and used as an integral part of the data collection workflow. It has also shown how a large research project can generate by-products which may also prove useful in their own right. The Research department of Ordnance Survey is pleased that the fruits of their research are now moving into production, and look forward to further challenges to come.
4. REFERENCES
Baltsavias, E.P., 2004, Object extraction and revision by image analysis using existing geodata and knowledge: current status and steps towards operational systems, ISPRS Journal of Photogrammetry & Remote Sensing 58, pp. 129 – 151
Carleer, A.P., Wolff, E., 2006. Urban Land Cover Multi-level Region based Classification of VHR Data by Selecting Relevant Features. International Journal of Remote Sensing 27 pp. 1035-1051
Champion, N., Rottensteiner, F., Matikainen, L., Liang, X., Hyyppä. J. and Olsen, B. P., 2009, A Test of Automatic Building Change Detection Approaches, in Stilla U, Rottensteiner F, Paparoditis N (Eds) CMRT09. IAPRS, Vol. XXXVIII, Part 3/W4
Gerke, M. & Heipke, C., 2008, Image-based Quality Assessment of Road Databases', International Journal of Geographical Information Science, 22, pp871 - 894.
Gladstone, C. S., Sanchez Hernandez, C., and Holland, D. A., 2007, Detecting Topographic Change Using Digital Photography and Digital Surface Models, in Proceedings of the 2007 annual conference of the Remote Sensing and Photogrammetry Society (RSPSoc 2007), Newcastle.
Greiwe, A. & Ehlers, M., 2005. Combined Analysis of Hyperspectral and High Resolution Image Data in an Object Oriented Classification Approach. Proceedings of the ISPRS Joint Conference URBAN 2005/URS 2005 , Tempe, Arizona, USA
Thornton, M. W., Atkinson, P. M. and Holland, D. A., 2006, Sub-pixel mapping of rural land cover objects from fine spatial resolution satellite sensor imagery using super-resolution pixel-swapping, International Journal of Remote Sensing, 27 (3), pp. 473–491