AIRBORNE LIDAR POWER LINE CLASSIFICATION BASED ON SPATIAL
TOPOLOGICAL STRUCTURE CHARACTERISTICS
Yanjun Wang a, *, Qi Chen b, *, Kai Li a, Dunyong Zheng a, Jun Fang a
a
National-local Joint Engineering Laboratory of Geo-spatial Information Technology, Hunan University of Science and Technology, 411201 Xiangtan, Hunan, China – {wongyanjun, likai9398, zdymath}@163.com, [email protected]
b
Department of Geography, University of Hawai‘i at Mānoa, 2424 Maile Way, Honolulu, HI 96822 USA - [email protected]
Commission VI, WG VI/4
KEY WORDS: airborne lidar, urban power line, neighbourhood selection, spatial topological feature, structure characteristics, power line classification
ABSTRACT:
Automatic extraction of power lines has become a topic of great importance in airborne LiDAR data processing for transmission line management. In this paper, we present a new, fully automated and versatile framework that consists of four steps: (i) power line candidate point filtering, (ii) neighbourhood selection, (iii) feature extraction based on spatial topology, and (iv) SVM classification. In a detailed evaluation involving seven neighbourhood definitions, 26 geometric features and two datasets, we demonstrated that the use of multi-scale neighbourhoods for individual 3D points significantly improved the power line classification. Additionally, we showed that the spatial topological features may even further improve the results while reducing data processing time.
* Corresponding author
1. INTRODUCTION
Inspecting transmission lines to detect and eliminate hidden risks is an important task for urban and rural power supply management and scientific planning (Ahmad et al., 2013; Matikainen et al., 2016). However, the traditional field-based inspection is labor-intensive and difficult, especially over complex terrain. In contrast, airborne lidar (light detection and ranging) can directly collect high-precision 3D point cloud data of the power line corridor (McManamon, 2012; Glennie et al., 2013). Nevertheless, power lines are usually close to vegetation and buildings and airborne lidar data volume is large, making it difficult to extract the power line points accurately and quickly from lidar point cloud. Therefore, the research and development of a highly efficient, rapid and automated method for extracting power lines from airborne lidar point cloud data is a critical topic.
2. RELATED WORK
The conventional technologies for power line extraction include: (i) statistical analysis of point clouds based on height, density or number of pulses, etc (Cheng et al., 2014; Zhu and Hyyppä 2014; Guan et al., 2016); (ii) Hough transform and clustering based on 2D image processing (Liu et al., 2009; Sohn et al., 2012; Zhu and Hyyppä, 2014; Grigillo et al., 2015); (iii) supervised classification based on metrical and distribution features between points (Kim and Sohn, 2013; Weinmann et al., 2015a; Guo et al., 2016; Matikainen et al., 2016).
Melzer and Briese (2004) proposed the use of 2-D Hough transform to detect segmented power line primitives. The overall reconstruction of power lines was accomplished by using the random sampling consistency algorithm to select the power line primitives for estimating the vertical parameters.
Because the method did not make full use of all the power line data, the accuracy of point-based classification was 91.04 and 89%, respectively. Clode and Rottensteiner (2005) introduced a tree and power line classification method using the local point density and intensity of the pulse returns, the accuracy test of the result was not high. They used a knowledge-based supervised classification method to separate the power lines from the background in two steps by fitting in the XOZ or YOZ plane, respectively. Liu et al. (2009) proposed a power line corridor classification method based on ground filtering algorithm and Hough transform, which focused on lidar intensity data more than elevation data.
Jwa et al. (2009), Jwa and Sohn (2012), Sohn et al. (2012), Kim and Sohn (2013), Guo et al. (2015) used the Markov random field to extract the power line from the given linear corridor scene, then extracted the tower according to the semantic relation between the power line and the tower, and finally, reconstructed the 3D power lines by using the multi-level span analysis of the catenary curve model based on the position of the tower. These methods extracted power lines and towers according to the semantic relationship based on the position of towers. They were unsuitable for power line classification in complex urban scenes where small electric poles instead of tall towers are ubiquitous. Liang et al. (2011) used the spatial distribution of power lines to extract a single power line from the point cloud, and then directly used the polynomial-based least squares matching algorithm to estimate the power line model parameters for its three-dimensional reconstruction.
Ritter and Benger (2012) proposed to detect power line candidate points by using the non-linear adjustment of the catenary line. This method is computationally complex, and the final fitting model is not continuous. Cheng et al. (2014) designed the urban power line extraction algorithm based on the ISPRS Annals of the Photogrammetry, Remote Sensing and Spatial Information Sciences, Volume IV-2/W4, 2017
characteristics of vehicle-based lidar point cloud data. Zhu and Hyyppä (2014) designed the automatic extraction model of the power lines focused on statistical analysis based on a set of criteria (e. g., height, density) and 2D image-based processing technology considered geometric properties. The average accuracy of power line classification was 93.26%. However, in complex urban scenes where trees and buildings are close to power lines, the accuracy would decrease.
In summary, airborne lidar point cloud data have the potential to overcome the shortcomings of traditional power inspection field work. However, it is necessary to design intelligent classification algorithm for extracting power lines from point cloud data. In this study, we proposed a power line classification method that works over complex scenes where vegetation, buildings and transmission lines are mingling in power line corridors.
3. METHODOLOGY
We designed our novel methodology for power line point cloud classification based on geometric scale features and multi-scale neighbourhood types. The main components of this methodology consist of (i) power line candidate point filtering, (ii) neighbourhood selection, (iii) feature extraction and (iv) SVM classification, which are explained in Figure 1 and the following subsections.
The raw airborne lidar
data
Power line candidate point
filtering
Local neighbourhood
selection
Topological feature extraction SVM
classification The power lines
classified resluts
Figure 1. The whole process framework of our methodology.
3.1 Power line candidate point filtering
The power line candidate point filtering from raw lidar point cloud is the first step for power line classification. We proposed a rough power line filtering from the original lidar point cloud by (i) first conducting ground points classification and DTM generation (Chen, 2007a; Chen et al., 2007b; Chen, 2009), (ii) then selecting all points that are 4 m above ground (Zhu and Hyyppä, 2014) as power line candidate points.
3.2 Neighbourhood selection
We used the local 3D spatial topological structure around a considered 3D point X for power line classification and initially considered two types of neighbourhood for 3D points: single-scale neighbourhoods and multi-scale neighbourhoods (Blomley et al., 2016). At each scale, we considered different neighbourhood types such as spherical, cylindrical and k nearest neighbourhoods. Each neighbourhood is defined by a single scale parameter such as radius, nearest k number, or optimal neighbourhood based eigenvalues (Weinmann et al., 2015b). After many trials, we chose the multi-scale spherical neighbourhoods to capture the anisotropy and details of power line topology structure.
3.3 Feature extraction
The successful identification of power line points depends on the extractions of useful features that can distinguish power
lines and other objects. For characterizing power lines, the metrical features and distribution features have been widely used for a variety of applications (Blomley et al., 2016). We extracted features based on contextual information to enhance power line classification accuracy (Weinmann et al., 2015a; Weinmann et al., 2015b, Weinmann et al., 2015c).
3.4 SVM classification
We used support vector machine (SVM) for classifying power line points (Zhang et al., 2013). The extracted features based on the local individual points’ neighbourhood are the feature vectors for the SVM classifier. SVM is a supervised classification method that requires training dataset to calibrate the classifier. To calibrate and validate the classifier, we manually identified true power line points from our dataset and used five-fold cross validation to assess the classifier’s accuracy.
4. EXPERIMENTAL RESULTS
In this section, we provide details on the dataset (Section 4.1), experiments (Section 4.2), and the results (Section 4.3).
4.1 Dataset
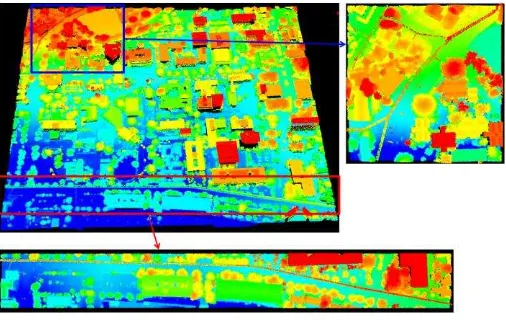
The datasets we used are from Honolulu, Hawaii. The datasets were acquired in 2014 and consist of upper left area (which is referred to as UL Dataset, 180 x 180 m2) and lower part area (which is referred to as LP Dataset, 800 x 100 m2) from a large lidar scene (Figure 2). The point density in the datasets is about 3.42 points/m2. For both UL Dataset and LP Dataset, ground truth is available in the form of a point-wise labelling with respect to power line class. An overview of the number of labelled 3D points for power lines is given in Table 1.
Class UL Dataset LP Dataset
Ground 48070 136891
Building 24348 48574
High vegetation 19532 73523
Power line 1519 6858
Unassigned 4475 2516
Total 97944 268362
Table 1. Number of labelled 3D points in the two datasets.
Figure 2. Visualisation of the experiments for UL Dataset (top) and LP Dataset (bottom) with the true power line. ISPRS Annals of the Photogrammetry, Remote Sensing and Spatial Information Sciences, Volume IV-2/W4, 2017
4.2 Experiments
For our experiments, we use the single-scale and multi-scale neighbourhood definitions as the basis for geospatial topological feature extraction: (i) six spherical single-scale
neighbourhoods denoted as
N
1m,N
3m ,N
5m,N
7m,N
9m andm
N
11 , (ii) a multi-scale neighbourhood denoted asN
all resulting from the combination of the spherical neighbourhoodsm
N
1 ,N
3m,N
5m,N
7m,N
9m andN
11m. The resulting features are concatenated to a feature vector and provided as input for SVM classifier.In order to compare the classification results obtained with the different approaches on point-level, we consider a variety of measures for evaluation on the power line classification: (i) precision rate (PREC), (ii) recall rate (REC) and (iii) kappa (k). The PREC, REC and k are computed as follows:
FP
FP = the sum of false positives for power lines
FN = the sum of false negatives for power lines
um
N
= the sum of power line candidate point4.3 Results
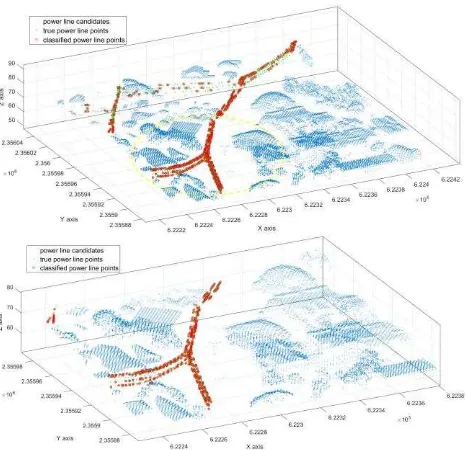
Due to the use of seven types of neighbourhoods and two datasets, a total number of 14 experiments were conducted. The value of precision rate (PREC), recall rate (REC) and kappa (k) for each experiments are shown in Table 2. Exemplary classification results are shown in Figure 3 and Figure 4. In these figures, the blue points represent the power line candidates, the green points represent the true power line points, and the red points represent the power line classification result.
N
UL Dataset LP DatasetTable 2. PREC, REC and k (in %) for different neighbourhood definitions and two datasets.
Figure 3. Visualisation of the experiments results for power line classification of UL Dataset (top) and the local magnification of
the yellow ellipse area (bottom)
Figure 4. Visualisation of the experiments results for power line classification of LP Dataset (top) and the local magnification of
the yellow ellipse area (bottom)
The results showed that
N
7m had the better performance among the six single scale neighbourhoods in UL dataset, whilem
N
11 had the better performance in LP dataset. The main reason is that power lines of UL dataset are much closer to trees and building and more complex than in LP dataset. But the accuracy in LP dataset increased gradually from neighbourhoodm
N
7 toN
11m . The multi-scale neighbourhoodN
all had higher kappa statistic than any single scale neighbourhood because it incorporates all the single scale topological structure characteristics, but the recall rate of the classification result is not as high as the precision rate.5. DISCUSSION
The novelty of this study is to use multi-scale neighbourhoods to characterize the spatial topology of power lines for classification.
Different from previous studies (Cheng et al., 2014; Zhu and Hyyppä 2014; Sohn et al., 2012) that rasterized lidar points and used image-based processing or statistical analysis technology for power line extraction, our approach focused on topological characterisation of 3D points via feature extraction from local neighbourhood of different scales and performed point-wise individual classification. Our datasets are from an urban area where power lines are in close proximity to vegetation or building. Despite of the complexity of area, our method can still achieve high classification accuracy.
Among the three types of neighbourhood (spherical, cylindrical, k nearest neighbourhood), we found that the cylindrical and k nearest neighbourhood based on the eigenvalue did not perform as well as the spherical neighbourhood. In our experiment, the power lines are ~4 m above the ground with ~2 m spacing and 5 m total width. We found that the better radius of single-scale neighbourhoods is 5 m or 7 m in UL dataset and LP dataset. These optimal scales approximate the horizontal or vertical span of the power lines. Multi-scale neighbourhoods performed better because of the spatial heterogeneity of the environment.
6. CONCLUSIONS AND FUTURE WORK
In this paper, we proposed a novel power line classification methodology based on airborne laser scanning data. The method consists of power line candidate filtering, multi-scale neighbourhood selection, geospatial topological feature extraction, and SVM classification. In a detailed experiment for an urban area, we found that feature extraction based on the multiple scales spherical neighbourhood leads to improved classification results in comparison to single-scale neighbourhood.
In future work, we plan to improve the methodology by considering more contextual feature inherent in the data. Furthermore, the presented methodology needs to be experimented for different types of points cloud data (e.g. mobile or vehicle-borne laser scanning data) or to use the classification results for 3D reconstruction of power lines in complex urban environments.
ACKNOWLEDGEMENTS
This work is supported by the National Natural Science Foundation of China (Grants 41601426). The authors thank the anonymous reviewers and members of the editorial team for their comments and contributions.
REFERENCES
Ahmad, J., A. S. Malik, L. Xia and N. Ashikin, 2013. Vegetation encroachment monitoring for transmission lines right-of-ways: A survey. Electric Power Systems Research, 95, pp. 339-352.
Blomley, R., B. Jutzi and M. Weinmann, 2016. Classification of Airborne Laser Scanning Data Using Geometric Multi-Scale Features and Different Neighbourhood Types. ISPRS Annals of
Photogrammetry, Remote Sensing and Spatial Information Sciences III-3, pp. 169-176.
Chen, Q., 2007a. Airborne lidar data processing and information extraction. Photogrammetric Engineering & Remote Sensing, 73(2), pp. 109-112.
Chen, Q., 2009. Improvement of the Edge ‐ based Morphological (EM) method for lidar data filtering.
International Journal of Remote Sensing, 30(4), pp. 1069-1074.
Chen, Q., P. Gong, D. Baldocchi and G. Xie, 2007b. Filtering airborne laser Scanning data with morphological methods.
Photogrammetric Engineering & Remote Sensing, 72(2), pp. 175-185.
Cheng, L., L. Tong, Y. Wang and M. Li, 2014. Extraction of Urban Power Lines from Vehicle-Borne LiDAR Data. Remote Sensing, 6(4), pp. 3302-3320.
Clode, S. and F. Rottensteiner, 2005. Classification of trees and power lines from medium resolution airborne lasers canner data in urban environments. Clinical Therapeutics, 34(5), pp. 1145-1150.
Glennie, C. L., W. E. Carter, R. L. Shrestha and W. E. Dietrich, 2013. Geodetic imaging with airborne LiDAR: the Earth's surface revealed. Rep Prog Phys, 76(8), pp. 086801.
Grigillo, D., S. Ozvaldič, A. Vrečko and M. K. Fras, 2015. Extraction of power lines from airborne and terrestrial laser scanning data using the hough transform. Geodetski Vestnik
59(2), pp. 246-261.
Guan, H., Y. Yu, J. Li, Z. Ji and Q. Zhang, 2016. Extraction of power-transmission lines from vehicle-borne lidar data.
International Journal of Remote Sensing, 37(1), pp. 229-247.
Guo, B., X. Huang, F. Zhang and G. Sohn, 2015. Classification of airborne laser scanning data using JointBoost. ISPRS Journal of Photogrammetry & Remote Sensing, 100, pp. 71-83.
Guo, B., Q. Li, X. Huang and C. Wang, 2016. An Improved Method for Power-Line Reconstruction from Point Cloud Data.
Remote Sensing, 8(1), pp. 36.
Jwa, Y. and G. Sohn, 2012. A Piecewise Catenary Curve Model Growing for 3D Power Line Reconstruction. Photogrammetric Engineering & Remote Sensing, 78(12), pp. 1227-1240.
Jwa, Y., G. Sohn and H. B. Kim, 2009. Automatic 3d powerline reconstruction using airborne lidar data. Laser scanning 2009, IAPRS. B. F., P.-D. M. and V. G. Paris, France. XXXVIII, pp. 105-110.
Kim, H. B. and G. Sohn, 2013. Point-based Classification of Power Line Corridor Scene Using Random Forests.
Photogrammetric Engineering & Remote Sensing, 79(9), pp. 821-833. Classification of Airborne LIDAR Intensity Data Using Statistical Analysis and Hough Transform with Application to ISPRS Annals of the Photogrammetry, Remote Sensing and Spatial Information Sciences, Volume IV-2/W4, 2017
Power Line Corridors. Digital Image Computing: Techniques & Applications Conference (DICTA 2009) Melbourne, Victoria, pp. 462-467.
Matikainen, L., M. Lehtomäki, E. Ahokas, J. Hyyppä, M. Karjalainen, A. Jaakkola, A. Kukko and T. Heinonen, 2016. Remote sensing methods for power line corridor surveys. ISPRS Journal of Photogrammetry and Remote Sensing, 119, pp. 10-31.
McManamon, P. F., 2012. Review of ladar a historic, yet emerging, sensor technology with rich phenomenology. Optical Engineering, 51(6), pp. 60901-60913.
Melzer, T. and C. Briese, 2004. Extraction and Modeling of Power Lines from ALS Point Clouds. Proceedings of Workshop.
Ritter, M. and W. Benger, 2012. Reconstructing Power Cables From LIDAR Data Using Eigenvector Streamlines of the Point Distribution Tensor Field. WSCG2012 - 20-th International Conference in Central Europe on Computer Graphics, Visualization and Computer Vision, June 25-28, 2012, Plzen, Czech Republic.
Sohn, G., Y. Jwa and H. B. Kim, 2012. Automatic powerline scene classification and reconstruction using airborne lidar data.
ISPRS Annals of the Photogrammetry, Remote Sensing and Spatial Information Sciences, XXII ISPRS Congress. Melbourne, Australia. I-3, pp. 167-172.
Weinmann, M., A. Schmidt, C. Mallet, S. Hinz, F. Rottensteiner and B. Jutzi, 2015a. Contextual Classification of Point Cloud Data by Exploiting Individual 3d Neigbourhoods. ISPRS Annals of Photogrammetry, Remote Sensing and Spatial Information Sciences II-3/W4, pp. 271-278.
Weinmann, M., B. Jutzi, S. Hinz and C. Mallet, 2015b. Semantic point cloud interpretation based on optimal neighborhoods, relevant features and efficient classifiers. ISPRS Journal of Photogrammetry and Remote Sensing, 105, pp. 286-304.
Weinmann, M., S. Urban, S. Hinz, B. Jutzi and C. Mallet, 2015c. Distinctive 2D and 3D features for automated large-scale scene analysis in urban areas. Computers & Graphics, 49, pp. 47-57.
Zhang, J., X. Lin and X. Ning, 2013. SVM-Based classification of segmented airborne LiDAR point clouds in urban areas.
Remote Sensing, 5(8), pp. 3749-3775.
Zhu, L. and J. Hyyppä, 2014. Fully-Automated Power Line Extraction from Airborne Laser Scanning Point Clouds in Forest Areas. Remote Sensing, 6(11), pp. 11267-11282.