PHOTOGRAMMETRIC TECHNIQUES FOR ROAD SURFACE ANALYSIS
V. A. Knyaz a,*, A.G. Chibunichev b
a State Research Institute of Aviation System (GosNIIAS), 125319 Moscow, Russia –
Moscow State University of Geodesy and Cartography (MIIGAiK), 105064, Moscow, Russia –[email protected]
Commission V, WG V/3
KEY WORDS: Photogrammetry, 3D reconstruction, Automation, Non-contact measurements, Road surface analysis
ABSTRACT:
The quality and condition of a road surface is of great importance for convenience and safety of driving. So the investigations of the behaviour of road materials in laboratory conditions and monitoring of existing roads are widely fulfilled for controlling a geometric parameters and detecting defects in the road surface. Photogrammetry as accurate non-contact measuring method provides powerful means for solving different tasks in road surface reconstruction and analysis. The range of dimensions concerned in road surface analysis can have great variation from tenths of millimetre to hundreds meters and more. So a set of techniques is needed to meet all requirements of road parameters estimation. Two photogrammetric techniques for road surface analysis are presented: for accurate measuring of road pavement and for road surface reconstruction based on imagery obtained from unmanned aerial vehicle. The first technique uses photogrammetric system based on structured light for fast and accurate surface 3D reconstruction and it allows analysing the characteristics of road texture and monitoring the pavement behaviour. The second technique provides dense 3D model road suitable for road macro parameters estimation.
* Corresponding author.
1. INTRODUCTION
The problem of road surface parameters measurements appeared with the first roads and still is of great importance nowadays. And currently manual techniques for road investigations are in wide practice among road construction and engineering services along with new means of automated and non-contact measurements.
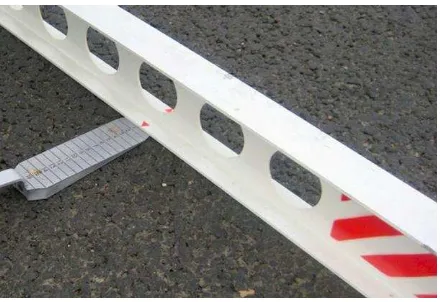
Road characteristics influences on driving safety and comfort, vehicle operating, environment (Harrison, 1990). A set of geometric parameters defines the quality of the road. Among these such parameters as 3D pavement surface macro-texture, characteristics of longitudinal and transversal evenness, geometry of the road (width, curvature, slope etc.) and condition of pavement. Traditional means (Figure 1) used for road surface measurement such as level bar, measuring tape and other manual tools do not provide high level of accuracy and dense data for detailed analysis. Also the process of measurements requires a significant time and limitation in traffic for investigated part of a road.
Modern road measuring techniques use a set of novel sensors (GPS, IMU, TLS, line and frame cameras) integrated in mobile-mapping system on the basis of minivan vehicle. They provide the possibility of acquiring a lot of spatial information which can be processed for retrieving necessary parameters of a road
(Ishikawa et al., 2006), (Kertész et al., 2008), (Shi et al., 2008),
(Gandolfi et al., 2008).
Figure 1. Measuring road surface parameters with level bar and wedge ruler
Indubitable advantages of integrated mobile mapping systems are their mobility, huge amount of information of various types, high accuracy and high performance. However the cost of such systems is rather high and usually they do not provide all necessary data for analysis.
Below two photogrammetric techniques for road surface 3D acquisition and analysis is discussed. The first one – for experimental load test of road cover quality and the second one
– for road surface analysis based on imagery obtained from unmanned aerial vehicle (UAV).
The first technique is developed for analysis of the road surface behaviour under the car load during moving along the road. The road deformation under car load depends of the asphalt quality The International Archives of the Photogrammetry, Remote Sensing and Spatial Information Sciences, Volume XLI-B5, 2016
and the intensity of traffic. To investigate the quality of road cover an experimental test ground with different sorts of road covers is used. It is equipped with a special device for simulating the motion of cars along the test ground. The device is a loaded wheel moving circularly on the one track in which the effects of this action on the road cover is analysed.
Existing techniques based on manual measurements of deformation are not accurate and allow to measure changes only for limited number of surface points. For advanced surface deformation analysis an original photogrammetric system is developed. It includes stripe projection 3D reconstruction system and original software for road patch 3D models matching and analysis. The developed photogrammetric system allows to generate road surface 3D model, to match corresponding patches, to measure given parameters of deformation.
The second technique is intended for automated road surface 3D reconstruction and road defects detection using imagery from UAV. Photogrammetric algorithms and software is used for automated image processing and road surface 3D reconstruction.
After road surface 3D reconstruction the road spatial model can be processed along with images for given feature detection on the road surface. On the next step of data processing feature classification will be carried out based on feature parameters analysis and machine learning techniques.
2. PHOTOGRAMMETRIC SYSTEM FOR ROAD
PAVEMENT DEFORMATION ANLYSIS
The analysis of road pavement behaviour under influence of moving cars is performed in special conditions of a test track. Car load acting on a road pavement is modelling by special construction consisting of four wheels installed in the ends of radial tubes bringing the given load to simulate the effect of real car motion (Figure 2). These “carousel” is rotated for given time period corresponding to the modelled traffic intensity.
Figure 2. The “carousel” for simulating the motion of cars along the test ground
A part of an experimental track and a wheel modelling the impact of moving cars are shown in the Figure 3.
Figure 3. A part of an experimental track and test load
For pavement behaviour analysis it is needed to have information about road surface deformations as a function of the weight of the load and the time of influence. Traditional manual measurements using level and measuring tape are time consuming and are not accurate enough. To make the process of deformation analysis more convenient, accurate and reliable the photogrammetric system was applied.
2.1 System configuration
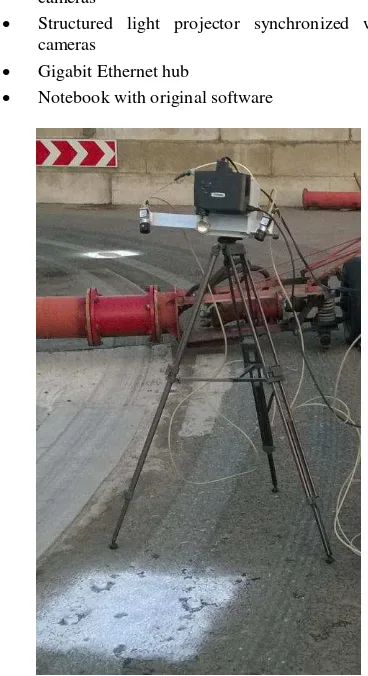
The original photogrammetric system for road surface 3D reconstruction and deformation analysis (Figure 4) is PC-based one. It includes the following components:
Two synchronized GigE Basler machine vision cameras
Structured light projector synchronized with the cameras
Gigabit Ethernet hub
Notebook with original software
Figure 4. The photogrammetric system at the test track The International Archives of the Photogrammetry, Remote Sensing and Spatial Information Sciences, Volume XLI-B5, 2016
The photogrammetric system is designed for road pavement surface 3D reconstruction with the quality which allows performing as surface deformation monitoring as pavement profile characteristics analysis. For these purposes it is needed that the system could provide measurements with the accuracy of 0.1 mm and the 3D model resolution of about 0.3 mm. To meet these requirements with given cameras and structured light projector the working space of the system is chosen as 500x500x500 mm. The required accuracy of 3D measurements is provided by original calibration procedure.
2.2 System calibration
The metric characteristics of 3D surface models produced by the photogrammetric system are assured by preliminary system calibration. Calibration procedure gives the estimation of interior orientation parameters basing on a set of images of special test field with known spatial coordinates of reference points. The problem of parameters determination is solved as estimation of unknown parameters basing on observation. Additional terms describing non-linear distortion in co-linearity equations X,Y,Z – coordinates of object point,
ai, bi, ci, i = 1,2,3– elements of transition matrix,
xp, yp, – coordinates of principal point,
mx, my -scalesin x and y directions,
K1,K2,K3 – the coefficients of radial symmetric
distortion,
P1,P2– the coefficients of decentring distortion
Image interior orientation and image exterior orientation (Xi, Yi, Zi– location and i,i,i– angle position in given coordinate system) are determined as a result of calibration.
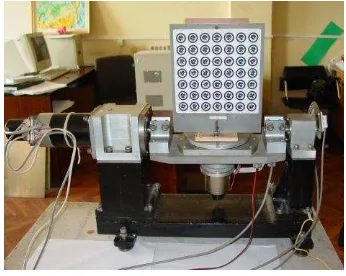
Figure 5. Calibration test field on a positioning stage
Calibration process is fully automated due to applying two axis positioning stage and coded targets for reference point marking (Knyaz, 2002). Calibration program captures a set of test field images at different position controlled by the positioning stage (Figure 5).
Original calibration software controls test field orientating for image acquisition and test field image capturing at given positions. Then camera orientation parameters are estimated basing on image reference points coordinates as observations of points with known spatial coordinates.
The results of system calibration are given in Table 1.
x, mm y, mm ,mm
Left camera 0.076 0.057 0.086
Right camera 0.068 0.065 0.092
Table 1. Results of system calibration
x, y, are residuals of co-linearity conditions for the reference points after least mean square estimation concerning as precision criterion for calibration.
The original software supports all function needed for surface 3D reconstruction and deformation monitoring.
3. ROAD SURFACE BEHAVIOUR UNDER A LOAD
3.1 Surface deformation measurement
To monitor changes in pavement surface under test load a set of control track regions is chosen and these test regions are marked by reference marks. The test region with 3 reference marks is shown in the Figure 6. During control region 3D scanning these reference marks lie in the working area of the photogrammetric system and then can be identified in the obtained surface 3D model. Figure 7 shows a stereo pair of a control region of the test track acquired during 3D scanning.
Figure 6. Control region of the track with reference marks
Figure 7. Stereo pair of the road with reference marks The International Archives of the Photogrammetry, Remote Sensing and Spatial Information Sciences, Volume XLI-B5, 2016
After each “carousel” working period a control region surface 3D model is acquired and stored for further processing. For pavement surface changes analysis these 3D models are translated in common coordinate system using reference marks.
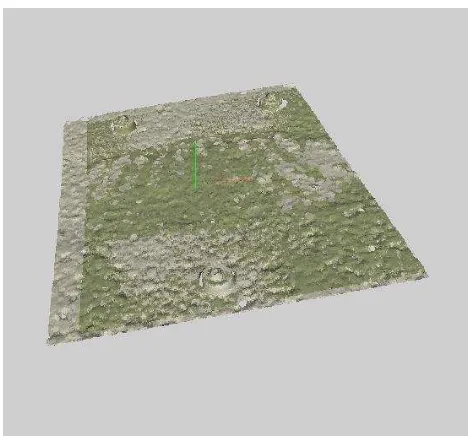
For scan registration iterative closest points algorithm is used but applied only for non-affected by test load areas of the control region. Figure 8 shows the result of two surface 3D models registration using 3 non-affected areas around reference marks.
Figure 8. Two scans registration for road pavement behaviour analysis
Figure 8 shows transversal section of two registered surface 3D models used for changes analysis.
Figure 9. Section of road surface 3D model before and after loading experiment
The quality of surface reconstruction (accuracy and resolution) allows to carry out the detailed analysis of pavement deformation under the test load.
4. AUTOMATED ROAD SURFACE 3D
RECONSTRUCTION USING UAV IMAGERY
Unmanned aerial vehicles which capable to perform missions for taking road imagery with high resolution seems to be effective mean for tasks of road characteristics monitoring. Photogrammetric processing of images taken from UAV platform allows obtaining road 3D model of high quality applicable for road geometric parameters estimation.
After road surface 3D reconstruction the road spatial model can be processed along with images for detecting road defects and determining their parameters.
4.1 Equipment characteristics
4.1.1 Unmanned aerial vehicle: Unmanned aerial vehicle
Geoscan 401 equipped with Sony - RX1 digital camera (Figure 10) was used for taking imagery for further road reconstruction.
Unmanned aerial vehicle Geoscan 401 is designed for imagery acquiring mission. It has take-off weight up to 8 kg and can reach heights of 500 m. Flight time of Geoscan 401 is about 1 hour and it flight distance is up to 25 km. UAV is equipped with digital Sony RX-1 camera and GPS-receiver.
UAV Geoscan 401 can operate in manual or automated flight control modes and record image coordinates during image acquisition.
a b
Figure 10. (a) Unmanned aerial vehicle Geoscan 401 (b) Sony - RX1 digital camera
4.1.2 Digital camera: Sony - RX1 digital camera was used
for taking imagery for further road reconstruction. The main characteristics of Sony - RX1 digital camera are presented in Table 2.
Focal distance
Image format Pixel dimensions
35 mm 6000 x 4000 6 x 6 m
Table 2. Main characteristics of Sony - RX1 digital camera
During the experimental flight a set of 24 images was taken (12 images for two flight trajectories). Flight height during image acquisition was about 30 m. Such image acquisition conditions correspond to 5mm per pixel resolution.
Figure 11 presents the scheme of reference and control points locations.
Figure 11. Scheme of reference and control points locations
2 4
6
8 10
1 3
5 7
9 11
12 13
14 15
These points were marked on the road surface by circles and crosses. The coordinates of the reference points were measured by electronic ground station. The accuracy of reference point coordinates measurements is 1,0 mm.
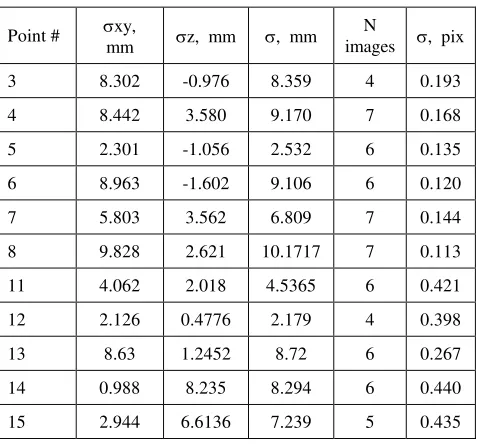
Photogrammetric image processing was performed using AgiSoft Photoscan software. For images adjustment four reference points and 10 control points were used. Tables 3, 4 and 5 present the results of adjustment procedure.
x, m y, m xy, m z, mm , mm
1.22 0.941 1.541 1.061 1.87
Table 3. Camera position precision
Point # xy, mm z, mm , mm N
images , pix
1 1.978 2.89 3.504 6 0.156
2 1.4685 -2.90 3.252 6 0.187
9 4.5313 -2.93 5.399 7 0.158
10 4.3390 2.94 5.24 7 0.151
Table 4. Measurements precision (reference points)
Point # xy,
mm z, mm , mm N
images , pix
3 8.302 -0.976 8.359 4 0.193
4 8.442 3.580 9.170 7 0.168
5 2.301 -1.056 2.532 6 0.135
6 8.963 -1.602 9.106 6 0.120
7 5.803 3.562 6.809 7 0.144
8 9.828 2.621 10.1717 7 0.113
11 4.062 2.018 4.5365 6 0.421
12 2.126 0.4776 2.179 4 0.398
13 8.63 1.2452 8.72 6 0.267
14 0.988 8.235 8.294 6 0.440
15 2.944 6.6136 7.239 5 0.435
Table 5. Measurements precision (control points)
Tables 4 and 5 show that the measurement precision is rather high and meets the most requirements on accuracy of road surface parameters measurement.
Then a dense 3D model of the road surface was reconstructed with resolution of 10.5 mm per pixel. The 3D model contains 13120x14802 points, the average points’ density being 9120 points per m2. All 3D reconstruction process was performed in automated mode, no manual processing was needed.
Figure 12 presents the orthophoto of the road with contour lines made with 100 mm step.
Figure 12. Orthophotoplan with contour lines
The results of processing of imagery obtained by unmanned aerial vehicle Geoscan 401 show that the accuracy and resolution of road 3D model are enough for determining macro parameters of the road such longitudinal and transversal evenness, geometry of the road (width, curvature, slope).
5. CONCLUSION
Two photogrammetric techniques for road surface analysis are proposed: for pavement deformation under test load monitoring and for road surface 3D reconstruction and analysis based on imagery obtained from unmanned aerial vehicle.
For advanced surface deformation analysis an original photogrammetric system is developed. It includes stripe projection 3D reconstruction system and original software for road patch 3D models matching and analysis. The developed photogrammetric system allows to generate road surface 3D model, to match corresponding patches, to measure given parameters of deformation.
The capabilities of imagery captured from unmanned aerial vehicle for road surface 3D reconstruction are studied. Automated processing of 24 images taken from height of 30 m provide a dense road 3D model which can be used for road macro parameters analysis and.
The future researches are aimed at given road surface feature detection and classification based on feature parameters analysis and machine learning techniques.
ACKNOWLEDGEMENTS
The work was performed with the support by Grant 15-08-99580a of Russian Foundation for Basic Research (RFBR).
REFERENCES
Besl, P.J., McKay, N.D., 1992. A method for registration of 3-D shapes, In: IEEE Transactions on Pattern Analysis and Machine Intelligence, vol. 14, no.2, pp. 239-256.
Gandolfi, S., M. Barbarella, E. Ronci, A. Burchi, 2008. Close Photogrammetry and Laser Scanning Using a Mobile Mapping System for the High Detailed Survey of a Height Density Urban Area. The International Archives of the Photogrammetry, Remote Sensing and Spatial Information Sciences. vol. XXXVII, part B5, pp. 909-914.
Harrison R., 1990. Influence of Road-Surface Roughness on Vehicle Operating Costs: Reviewing the Evidence from Developing Countries. ASTM STP 1031, pp. 416-429.
Ishikawa K, J. Takiguchi, T. Fujishima, Y. Tanaka, 2006. Development of a vehicle-mounted road surface 3D measurement system, ISARC2006, pp. 569-573.
Kertész I., T. Lovas, A. Barsi. 2008. Photogrammetric
Pavement Detection System. The International Archives of the Photogrammetry, Remote Sensing and Spatial Information Sciences. vol. XXXVII, part B5, pp. 897-902.
Knyaz, V., 2002. Method for on-line calibration for automobile obstacle detection system. In: The international Archives of Photogrammetry and Remote Sensing, Proceedings of ISPRS
Commission V Symposium “CLOSE-RANGE IMAGING,
LONG-RANGE VISION”, Vol. XXXIV, part 5, Commission V, 2002, Corfu, Greece, pp. 48-53.
Shi Y., R. Shibasaki, Z.C. Shi, 2008. Towards Automatic Road Mapping by Fusing Vehicle-Borne Multi-Sensor Data. The International Archives of the Photogrammetry, Remote Sensing and Spatial Information Sciences. vol. XXXVII, part B5, pp. 867-872.
Val ek ., . r k, T. ryniewicz, . arni rov , K.
Rokosz, . Kušnerov , K. Bar ov , . Bra ina, 2012.
Non-Contact Method for Surface Roughness Measurement After Machining. MEASUREMENT SCIENCE REVIEW, Volume 12, No. 5, pp. 184-188.