WILD FIRE RISK MAP IN THE EASTERN STEPPE OF MONGOLIA USING
SPATIAL MULTI-CRITERIA ANALYSIS
Elbegjargal Nasanbat a* , Ochirkhuyag Lkhamjav b
a* National Remote Sensing Center, Juulchiny street-5, Ulaanbaatar 15160, Mongolia - [email protected] b Mongolian Geospatial Association, P.O. Box 311/24, Ulaanbaatar, Mongolia - [email protected], [email protected]
KEY WORDS: MODIS, Fire hotspot, Risk map, Spatial multi-criteria analysis ABSTRACT:
Grassland fire is a cause of major disturbance to ecosystems and economies throughout the world. This paper investigated to identify risk zone of wildfire distributions on the Eastern Steppe of Mongolia. The study selected variables for wildfire risk assessment using a combination of data collection, including Social Economic, Climate, Geographic Information Systems, Remotely sensed imagery, and statistical yearbook information. Moreover, an evaluation of the result is used field validation data and assessment. The data evaluation resulted divided by main three group factors Environmental, Social Economic factor, Climate factor and Fire information factor into eleven input variables, which were classified into five categories by risk levels important criteria and ranks. All of the explanatory variables were integrated into spatial a model and used to estimate the wildfire risk index. Within the index, five categories were created, based on spatial statistics, to adequately assess respective fire risk: very high risk, high risk, moderate risk, low and very low. Approximately more than half, 68 percent of the study area was predicted accuracy to good within the very high, high risk and moderate risk zones. The percentages of actual fires in each fire risk zone were as follows: very high risk, 42 percent; high risk, 26 percent; moderate risk, 13 percent; low risk, 8 percent; and very low risk, 11 percent. The main overall accuracy to correct prediction from the model was 62 percent. The model and results could be support in spatial decision making support system processes and in preventative wildfire management strategies. Also it could be help to improve ecological and biodiversity conservation management.
1. INTRODUCTION
Fires usually occur in dry ecosystems, typically, steppe and grassland, when uncontrolled wildfires outbreak due to physical or natural events and human actions. Also, some researchers highlight that wildfire become a threat to biodiversity and human habitat, and contributes to mortality reasons of them (Ochirkhuyag et al., 2008). Moreover, the frequency of natural disasters and their impact has increased worldwide over recent years including Mongolia, as a result of global climate change and the disturbance to ecological balance.
In contrast, in Mongolia, steppe fire is considered as one of the natural disasters which frequently occurs in every dry seasons, spring and fall, of year and during the last several years, the fire process has been increasing caused by accumulation of the fire impact to the environment and natural resources. Mongolia has a typical continental climate, with hot summers (temperature up to 410C) and cold winters (temperatures to -530C). Rainfall is relatively low, varying from 50 mm in the southern desert region, to 450 mm in mountain areas, with 80% ~ 96% falling in the warm period from May to September (Erdenetuya, 2012). According to scholarly surveys, about 56 per cent of the
country’s total area is located in a zone exposed to forest and grassland fires and a considerable fraction (98.5%) of the
country’s territories covered with forests are in a zone assessed as of highest fire risk (Erdenetuya, 2012).
Wildfires constitute a major that determine spatial and temporal dynamics of forest ecosystems (Goldammer, 1999). In Mongolia, fire is a major factor which determines spatial temporal dynamics of forest ecosystems (Chuluunbaatar, 1998). Wildfire might lead to disastrous consequences such as huge economic and ecological losses in the forest coverage of Mongolia (Ochirsukh, 2011). About 95 percent of steppe and forest fires in Mongolia are caused by human activities (Erdenetuya, 2012). Between 1981 and 1999, approximately 160 fires per year were recorded in Mongolia, each burning an average of 2,933,659 ha (Goldammer, 1999). More than 10 years, between 2000 and 2011, in the Eastern part of Mongolia,
grassland fire occurred about 36 percent of annual wildfire of year., and burnt area covers approximately 915,000 ha (NEMA, 2015).
The risk map of fire is calculating the potential area, which is certainly affected by the wildfire. According to (Huyen and Tuan, 2008), geospatial technology approaches and data are mapped the fire risk map integrated with socio-economic and environmental information. Erdenetuya (2012) underlines that remote sensing and Geographic Information System (GIS) techniques support for detection of active fires, burnt area
estimation and damage’s geo-statistical analysis. In general, the estimation of fire risk map on grassland and forest area is analyzed various methods, including logistic regression, weighted overlaying methods, AHP, fuzzy analysis, neural networks and classification tree method (Garavand and Yaralli, 2015). In this study, we use a spatial multi criteria analysis (SMCA) method.
The objectives of this study are to monitor wildfire in the Eastern Steppe of Mongolia using moderate resolution imaging spectroradiometer (MODIS) data, and to identify potential environmental, topological, and sociological factors of the fire. These factors contribute to the outbreak of regional wildfire events, and also factors were used to model regional wildfire potential through spatial Multi criteria analysis (SMCA) using a method of weighted overlay combination. Moreover, the specific objectives are that to identify suitability and non-suitability area of the fire in the study area and to compare the output wildfire risk map with ground truth information related to burned forest and steppe for validation.
2. STUDY AREA
an area of 289,323 km square. The range of air temperature in the Eastern Mongolia is from -24 to +20 degrees centigrade.
Figure 1. The study area Eastern part of Mongolia
As a result of possible steppe and forest fires occurrence that increases considerably in the dry season of spring (from the end of March to June) and autumn (from September to November). In contrast, 25-30 percent of the total numbers of fires that occur annually in Mongolia which are located in Khentii, Sukhbaatar and Dornod provinces. The statistic of Wildfire occurrences in the Eastern part of Mongolia, 2000 – 2013 shown in Figure 2.
Figure 2. Number of wildfire occurrence in Eastern part of Mongolia
Possible causes of wildfire in this region are presented in Figure 3. The Causes of wildfire behaviors classified into 3 main groups such as Human Behaviors, Natural behavior and other factors. Recently year’s wildfire occurrence increasing in Eastern part of Mongolia.
Figure 3. Causes of Wildfire behaviors.
3. MATEIALS AND METHODS
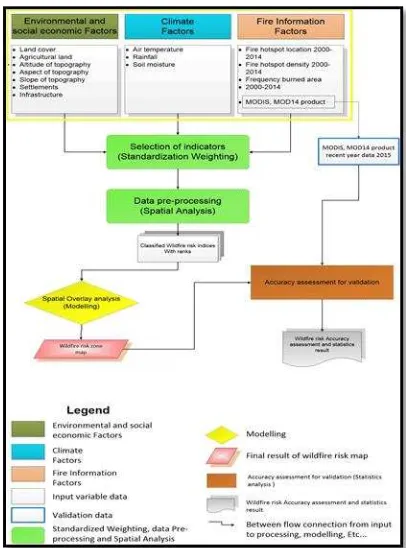
In this study, we used Multi-Criteria Evaluation (MCE) as a technique for making complex decision as mentioned (Alejandro, 2003). In order to identify the high risk or optimal location area for a particular subject, the variables can be separately divided into four main groups of factors which is Environmental factors, Climate factors, Fire information factors and social economic factors. Flowchart represents a level of pre-processing and criteria selection, draw mapping and statistic validation shown in Figure 4-5.
3.1. Mapping of wildfire risk area for ranking methods
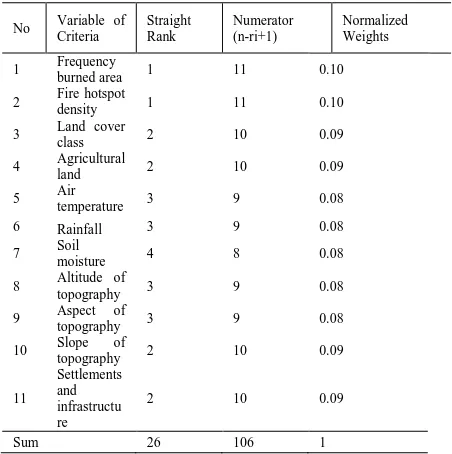
Then suitable weights of factors were assigned using the Multi Criteria Analysis (MCA) which is a technique used to assist for making complex decision as mentioned (Alejandro, 2003). The data was weighted and ranked based on the Malczewski formula (Malczewski, 1999). Rank sum weight are calculated according to the following equations 1, 2 and 3 below
(1)
(2)
where = weighting for criterion i, n = is number of criteria
k = counter for summing across all criteria (r, i) = important order of range
(3)
where = variables criteria
= weighted statistic value.
Table 1. Ranking and weighting of factors
No Variable of
Weighted low percentage factors are not important. In contrary, high percentage value are relevant. To obtain effective and more accurate conclusions, mathematical operations were modelled in GIS analysis.
Figure 4. Flow chart of wildfire risk map MCA methods
Figure 5. Wildfire risk map of MCA Modelling
3.2. Datasets Used
In this study used MODIS imagery data sets between 2000 and 2015, 250 m resolution, National Land Cover Map, 1: 100,000-1: 500,000 scale administrative boundary and thematic maps such as river, well, lake, road, settlements, tourist camps, number pollution etc. several datasets have been collected from National Remote Sensing Center of Mongolia, URL: www.icc.mn. The several climate datasets have been collected from the Mongolian Institute of Meteorology and Hydrology. The 30 m resolution ASTER GDEM v2 was downloaded from https://www.jspacesystems.or.jp/ersdac/GDEM/E/4.html. A combination of image processing software: ERDAS Imagine, ENVI, IDRISI taiga and GIS software, ArcMap software were
used throughout the all process. In Table 2 shows list of data set for this study.
Table 2. Data set List
Category ID Name
GIS Vector
1 Province boundary
2 Sub-province boundary 3 Sub-province center
4 Road network
GIS Thematic
maps
5 River, springs
6 Lakes
7 Well
8 Tourist camps
9 Fire Guard
Climate data
10 Air temperature, 2000-2015 11 Rainfall, 2000-2015 12 Soil moisture, 2000-2015
13 Wind speed and direction, 2000-2015
Social Economic
data
14 Number of Population, 2000-2010
15 Number of Livestock, 2000-2010
Remote Sensing data
16 Aqua terra/ MODIS, 2000-2015 17 MODIS hotspot, 2000-2015 18 Burned area map, 2000-2015 19 Land cover map, 2010
20 Global Digital Elevation Model (DEM) 30m
4. RESULT AND DISCUSSION
Global and regional climate warming is changing rapidly in the last decade due to excessive precipitation and heavy rains will increase heat, dryness, and wildfire resulting from the intensity is increasing year by year (Trenberth, 2005). We have been considered to statistical analysis in study area which is тhe linear equation derived from the regression was then used for relationship between wildfire occurrences and long term climate factors which has been measured meteorological station data such as precipitation and air temperature data 2000-2013 in Eastern part of Mongolia. Result are shown in Figure 6.
Figure 6. Trend of relationship between wildfire and climate data
Figure 7. Result of linear regression between wildfire and climate data
The dryness of the climate causes somehow ignites wildfires which is precipitation has low, meaning that there is a low amount of water vapor in the air, wildfires are more likely to start (Bylow, 2012). For example, the statistic value of the correlation coefficient has 0.75, or 75 percent are dependent on precipitation.
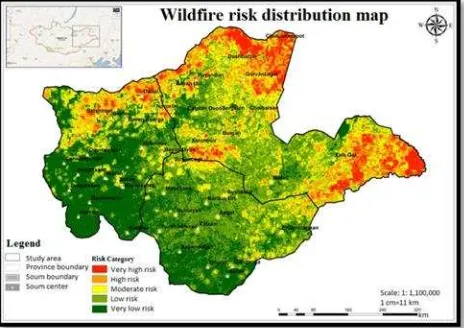
Finally, the wildlife risk map is produced by the SMCA’s weighted overlay method, and it is shown Figure 8. Around 37 per cent of fire risk area in the map is very high probability of wildfire zone, and others is non-suitable area of wildfire zone.
Figure 8. Wildfire risk distribution map in Eastern part of Mongolia
In contrast, the result of wildfire risk ranks five risk levels, particularly, six per cent of study area falls in the group of very high risk, 13 percent covers the high risk class, and the moderate risk occupies 18 percent. Lastly, both about over 30 per cent of the Eastern Steppe are categorising low and very low risk ranks (Figure 9).
Moreover, the study evaluates an accuracy assessment that compares between the ranks of wildfire risk map and the number of steppe fire information, which is collected in the National Emergency Monitoring Agency. Therefore, the validation of the wildfire risk map is more accurately overlays the hotspot and burned area of the Eastern Mongolia, approximately 68 per cent, includes the very high, high risk and moderate risk zones. Other classes, low and very low risks are around ten percent that intersects the percentages of actual fires. Finally, the main overall truthfulness of the prediction from the model was calculated by 62 percent.
Figure 9. Result of wildfire risk level in Study area
Figure 10. Accuracy of wildfire risk map in Study area
5. CONCLUTIONS
The research confirmed that the methodology used was adequate to integrate Environmental and Social economic factors, Climate factors, Fire Information factors with different
spatial and temporal resolutions.
Spatial Multiple Criteria Analysis, of these factor components proved to be useful in the identification of suitable areas for wildfire risk area, within a GIS nature disaster.
This investigation is spatial and temporal resolutions a biophysical evaluation that provides information at a regional level. Consequently, the risk map of steppe fire could be used prevent reduction fire risk, private section and farmers care to prepare risk reduction, national and local government agency, particularly, forestry. As well, decision-making regarding adequate suitable area could be based not only on the information provided by this MCA, but also on other aspects such as information for firefighters (by local and governments), managements, technological level, technical equipment and foundation funds, in addition to local peoples, which are also highly important.
This approach has could be helps spatial decision making processes and in preventative wildfire management strategies. Furthermore, it could be help to improve ecological and biodiversity conservation management.
ACKNOWLEDGEMENTS
I’m glad the Remote Sensing Division of the NRSC of
Mongolia for supporting my completion of this work.
I would like to express special thanks to the Earth Observing System Data and Information System (EOSDIS) fire detection implementation Team for providing updated Global Wildfire Databases for this research work.
REFERENCES
Alejandro, C. A., 2003. Delineation of suitable areas for crops using a Multi-Criteria Evaluation approach and land use/cover mapping a case study in Central Mexico. Elsevier Science. pp: 77, 117-136.
Bylow, D., 2012. Modeling Wildfire Hazard in the Western Hindu Kush Himalayas. pp:41-26.
Chuluunbaatar, T., 1998. Fire in forest ecosystem of Mongolia. International Forest Fire News 19. pp:58-63
Erdenetuya, M., 2012. Fire occurrence and burning biomass statistics in Mongolia, The Proceedings of 33rd Asian Conference Remote Sensing. pp. 118-125.
Garavand, S. and Yaralli, N., 2015. Assessment of Fire Risk in Central Zagros Forests in Chaharmahal Bakhtiari Province. International Journal of Review in Life Sciences 5(3).pp:538- 543
Goldammer, J.G., 1999. Fire Situation in Mongolia. Freiburg Germany. International Forest Fire News (IFFN) 36. pp:5-8
Huyen, D.Th.Th. and Tuan, V.A., 2008. Applying GIS and Multi Criteria Evaluation in forest fire risk zoning in SON LA PROVINCE, VIETNAM. International Symposium on Geoinformatics for Spatial Infrastructure Development in Earth and Allied Sciences. pp. 8.
Malczewski, J., 1999. GIS and Multicriteria Decision Analysis. John Wiley & Sons. pp. 177-190.
NEMA., 2010. The News Bulleting of Disasters. Ulaanbaatar.
Ochirkhuyag, L., Fine, A., Didier, K. and Sanderson, E., 2008.
The Eastern Steppe’s Living Landscape, Mongolia. The Proceedings the ISPRS XXI Congress. pp. 575–573.
Ochirsukh, B., 2011. GIS mapping for forest fire risk zone in Selenge, Mongolia. Spring Korea Geospatial Information Society Conference. pp. 53-56