GIS FOR PREDICTING THE AVALANCHE ZONES IN THE MOUNTAIN REGIONS OF
KAZAKHSTAN
Zh. T. Omirzhanovaa*, A. S. Urazalieva, A.T. Aimenovb
a Department Geodesy and Cartography, International Educational Corporation, Ryskulbekova, 28, Almaty, Kazakhstan-
[email protected], [email protected]
bNational Cartographical and Geodesic foundation, Esenberlina 36, Almaty, Kazakhstan - [email protected]
KEY WORDS: Geographic Information System, a Digital Terrain Model, Slope, Steep slopes, Avalanche zone
ABSTRACT:
Foothills of Trans Ili Alatau is a recreational area with buildings and sports facilities and resorts, sanatoriums, etc. In summer and winter there are a very large number of skiers, climbers, tourists and workers of organizations which located in the mountains. In this regard, forecasting natural destructive phenomena using GIS software is an important task of many scientific fields. The formation of avalanches, except meteorological conditions, such as temperature, wind speed, snow thickness, especially affecting mountainous terrain. Great importance in the formation of avalanches play steepness (slope) of the slope and exposure. If steep slopes contribute to the accumulation of snow in some places, increase the risk of flooding of the slope, the various irregularities can delay an avalanche. According to statistics, the bulk of the avalanche is formed on the slopes steeper than 30. In the course of research a 3D model of the terrain was created with the help of programs ArcGIS and Surfer. Identified areas with steep slopes, the exposure is made to the cardinal. For dangerous terrain location is divided into three groups: favorable zone, danger zone and the zone of increased risk. The range of deviations from 30-45 is dangerous, since the angle of inclination of more than 30, there is a maximum thickness of sliding snow, water, the upper layer of the surface and there is an increase rate of moving array, and the mountain slopes at an angle 450 above are the area increased risk. Created on DTM data are also plotted Weather Service for the winter of current year. The
resulting model allows to get information upon request and display it on map base, assess the condition of the terrain by avalanches, as well as to solve the problem of life safety in mountainous areas, to develop measures to prevent emergency situations and prevent human losses.
1. INTRODUCTION
Abrupt warming in winter and large amount of precipitation, dramatically increases the thickness of snow cover in mountainous areas, leading to a sudden avalanche, and in the spring increases the amount of melt water that cause accidents on the mountains. Snow avalanches impact transportation corridors, ski areas, backcountry recreation, resource industries, energy and transmission, residential land use and construction sites. Recreationists engaged in voluntary risk, especially snowmobile operators, require increased awareness, avalanche information and skills to avoid the hazard (Stethem Chris et al., 2003). In general, avalanches and mudflows also pose a threat to the city of Almaty. Almaty is located at the foot of the mountain, at the mouth of mudflow mountain rivers: Big Almaty, Small Almaty, Essentay and others. Since the founding of the city and the surrounding area it was repeatedly subjected to devastating mudslides. In June, 1921 Vernyi city (now Almaty) was badly damaged during the mudflow. A mudflow in July 1963, came down on the lake Issyk, destroyed part of Issyk village.
In the Trans-Ili Alatau mountains at an altitude of 2511 meters above sea level, at a distance of 28.5 km south of the city of Almaty is situated Big Almaty Lake. In 50-60 years, the Big Almaty gorge was built hydroelectric power plants, and installed on the lake water intakes. In 1977, due to the mudflow dam suffered, but in the early 1980s made efforts to strengthen the sides.
____________________________
* Corresponding author
Weather conditions in recent years, contributing to melting of glaciers, with long heavy rains lead to raising the level of alpine lakes, river flooding and contribute
to the formation of debris flows, which in its path capture not only loose deposits, but also hard rock, breaking them and taking with them and uprooting trees.
It became habitual for city residents to get warning messages about the possibility of avalanches and mudflows from the Department of Emergency Situations of Almaty (http://www.dchs-almaty.kz).
(Glade et al., 2005, Leroi, 1996, Holler, 2007, Birkeland, into account the height of the terrain, snow-covered area, the average temperature for a day, the amount of precipitation, and the critical temperature gradient and allows calculate the volume of meltwater drainage.
Soloviev, Kalach, Psarev (2012) have developed a mathematical model simulation of nucleation and avalanches when changing the ambient temperature and the melting of the snow cover on the slope. Temperature changes (both rise and fall) leads to a change in the mechanical parameters of snow (viscosity coupling individual fragments), which causes the internal stresses in the mass of snow, and it may cause deformation and separation of the fragments, which may lead to an avalanche.
If the slope angle (the angle of the slope to 30) is not large, there is a slow slide into the melting snowpack, on steep slopes (slope angle more than 40) snowballing movement of snow. Nearly 46% of the failures have occurred on slopes with slope angles between 20 and 30 (R. Ramanathan and et al., 2014). Velocity of snow avalanches ranges up to 250
kmh−1 in dry snow and 125 kmh−1 in wet snow (Mears,
1992).
Snow thickness is determined either by direct measurement values when shooting and snow pitting or on mathematical models. In the presence of a digital terrain maps, weather observations, weather forecasts and data on explosions or earthquakes expected natural use of mathematical models can simulate the development of snow cover for a few hours, days, weeks, months and even years (Mokrov, Solovyev, 2010).
One of the most important areas is the development of techniques for forecasting and assessment of debris flow hazards that require mapping data with a high level of detail (Paramonov, 2005).
Only the buildup of climate and avalanche databases, augmented by accurate weather and avalanche forecasting models, will enable detailed prediction of such extreme events in the future. (Birkeland K. W., 2001)
2. FIELD OF STUDY (precipitation, snow depth, temperature, wind) and their standard tolerances.
3.1 DEM
DEM can be made by methods of remote sensing, photogrammetry, radar surveys, digitizing contour lines with existing paper topographic maps and by the results of tacheometry GIS programs. Currently on the Internet in the public domain, there are a large number of digital cartographic materials, including SRTM (Shuttle Radar Topography Mission), the matrix of the global digital elevation model with a 3-second cell size, which is an excellent substrate when creating the DEM. The DEM of better resolution represents the topography and slope
processes and movements more accurately and, consequently, can serve as a more reliable source of information for modeling (Borut Vrščaj, 2007).
At the initial stage of preparation of materials for the study made importing data SRTM, downloaded program SAS.Planet format software «ArcGIS» and «Surfer» for subsequent conversion of raster images into vector. The image of the terrain submitted data SRTM, generally corresponds to the accuracy of topographic maps of scale 1: 100 000 - 1:50000.
Coordinates framework SRTM-model study area are: 43˚04 -
43˚12north, 77˚00-77˚07east. SRTM-cut pattern on the study area is loaded into the program ArcGIS, the spatial reference is performed and processing in order to obtain a digital surface model (DSM). DMS is traditionally represented as values in the nodes of a rectangular regular grid, discrete which is determined depending on the specific task at hand. Data values are stored in standard formats such as mathematical modeling packages GRD (binary or text format). Typical values at the grid points is obtained by choosing the raw data, or using interpolation algorithms dimensional functions in arbitrary nodal points of the region, or by calculating the values of the function specified by the user, or the transition from a regular grid to another, using simple interpolation algorithms and smoothing the transition from a smooth surface to the other. To construct a 3D terrain model, the function "3D Surface" program Surfer is used
(Surfer 12 Full User’s Guid ). Compared with other software programs Surfer, allows to create a digital model of the surface of good quality at data that are unevenly distributed in space. Stages of the work program can be summarized into three main functional stages:
• building a digital surface model;
• auxiliary operations with digital surface models; • visualization of the surface.
The study interpolation was performed in several ways, including more than a visual image was obtained using the method of Krige, which is often used and is ideal for presentation highlands. The resulting three-dimensional model of the study area is shown in Figure 1.
Figure 1. Created in the program «Surfer» a 3D terrain model
The resulting digital model allows to make quantitative analysis, that is, to calculate statistics such as average height, steepness rays, exposure, and their ranges for the morphometric analysis of the relief the study area, and solve various other engineering tasks.
3.2 The slope and slope exposure
of snow in some places, increase the risk of flooding of the slope, the various irregularities can delay an avalanche. Avalanches can initiate on slopes with an inclination between 28 and 50 (McClung and Schaerer, 1993).
To display the dangerous slopes must display the terrain slopes. The program ArcGIS to determine areas with very steep slope function is used Slope (How Slope works). Tool slope for each cell calculates the most maximum value of the degree of change in H (z) between adjacent cells. The maximum rate of change in the values of the height H (z) to unity in the ratio of the distance between the cell and its eight neighboring cells defines the steepest slope to the slope of the cell. Standard tool selects the plane for the H-values of the cells adjacent to the cell size 3x3 or used around the central cell. Slope value given plane is calculated using the method of averaging the maximum.
The algorithm can also calculate the bias as follows:
slope_degrees = ATAN (rise_run) * 57.29578 (1)
rise_run=√([dz/dx]2 + [dz/dy]2] (2)
The direction of the flat faces is the exposure of the cell to be treated. Consequently, the lower the value of slope, the flatter the earth's surface is given; the higher the value of the slope, the slopes are steeper on a given surface.
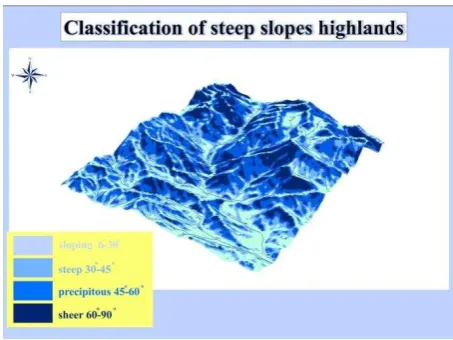
Create a map of the terrain slopes in ArcMAP further loaded into ArcScene, to visualize it in three dimensions. The slope shows a method cartograms, with increasing values of its color changes to a darker shade. For graduation surface is divided into classes. For this model, taking into consideration the differentiation table steep slopes of Silaeva, Sorokovoy (2012) has created the following scale steep slopes (Table 1):
Types of slopes
Steepness, degrees
Characteristics of slopes
sloping 6-30 More sloping hillsides, not dangerous
steep 30-45 Landslides, talus, avalanche precipitous 45-60 Inaccessible avalanche slopes sheer 60-90 Inaccessible slopes
Table 1. Classification of steep slopes highlands
Since the terrain is mountainous there is no any necessity to differentiate the slopes with a slope of less than 6 (Silayeva, Sorokovoy, 2012) selectable scale should be taken into account the prevailing slope angles, heights and characteristics of the territory.
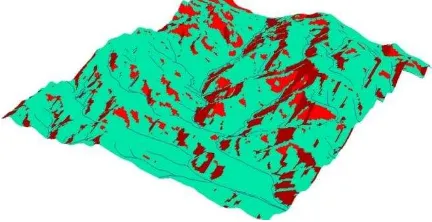
In this case, for dangerous terrain is divided into three groups: favorable zone, danger zone and the zone of increased risk. By the favorable zone is the first step, the range of 6-30, which shows more or less sloping hillsides range of 30-45 is dangerous, since the angle of inclination of more than 30, there is a maximum thickness of sliding snow, water, the top layer of the surface and there is an increase rate moving array, and the mountain slopes at an angle 45 and above (dark blue areas) are a high-risk (Figures 2-3).
Thus, the present model clearly shows the places of greatest danger in which the conditions of dangerous destructive processes: intense erosion, landslide, avalanche, and others. A similar model can be created in any location, not just for show critical slopes, but also to show leadership and limit biases applied to the problem of construction (roads, industrial facilities, waterworks, etc.), irrigation of agricultural fields. In this case, given the scale of the other angle.
Figure 2. Exposure of Trans-Ili Alatau slopes
Create a 3D model of the terrain slope allows one to perform a comprehensive study of all areas, including mining, to evaluate the current status, to predict possible mudslides and avalanches as soon as possible, to identify particularly dangerous zones and escape routes.
Figure 3. Avalanche zone in Trans-Ili Alatau
3.3 Weather conditions
Climate change will effect the spatial distribution, frequency, type and magnitude of snow avalanches and consequently could influence avalanche zoning. If winter precipitation amounts change in some regions due to global climate change then snow supply and snowpack characteristics can be expected to change as well (Stethem Chris et al., 2003). Data on the weather conditions for the Trans-Ili Alatau Range provides RSE "Kazgidromet", but it can be taken from internet sites, although most of the accuracy of these data is low and certainly not suitable for the village located in the foothills and mountains. In this regard, more accurate are the sites http://www.foreca.ru/ , http://www.meteoinfo.ru/ , http://www.hmn.ru/ .
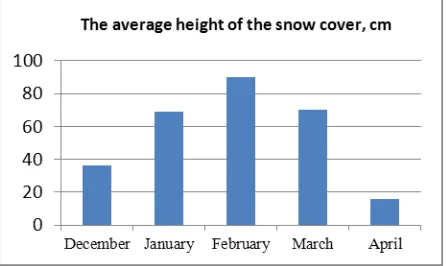
3.3.1 Precipitation. Thickness of snow
A critical mass of new snow that falls in 1-3 days, contributing to the formation of avalanches, is considered to be:
10-20 cm under adverse conditions (strong wind, low temperature)
20-30 cm with a combination of favorable and unfavorable conditions
Below the Figure 4 shows the data on the height of the snow cover in 2014 in the resort area "Shymbulak". According to date issued of RSE "Kazgidromet" the average height of the snow cover in December 2014 was 36 cm, in January-69, in February-90, in March-70, in April-16 cm.
Figure 4. The average height of the snow cover on the meteorological station "Shymbulak"
Determination of the thickness of the snow cover on the satellite images has an advantage over in situ measurements, as it allows to obtain a continuous array of points on the field, while the meteorological are not available everywhere across the earth's surface. However, nowadays, reliable method of determining the thickness of snow cover through satellite imagery does not exist. On pictures can be determined directly the fact of the presence / absence of snow, as well as some of its physical properties at the time of shooting (humidity, age (relative), the tendency to promote the glaciers). For example, the thickness of the snow is determined by satellite images (Sheppard et al., 2012), where the main feature, indicating the height of snow cover is the depth of color.
3.3.2 Wind
The formation of avalanches affect wind and speed. If strong winds up to 70 km/h actively carries snow on a slope and a snow slab, the hurricane wind speeds from 70-100 km/h carry large masses of snow.
In Trans Ili Alatau frequent storm winds. In 2011, in the Trans Ili Alatau was strong gale force up to 25 m/s with strong destructive consequences, resulting in torn trees with roots, this has led to the destruction of tree cover, consisting of the Tien-Shan firs.
According to date issued of RSE "Kazgidromet" Average wind speed in m/s in December 2014 was 1.1 cm, in January-1.6, in February-1.3, in March-1.5, in April-1.2 cm (Figure 5).
Figure 5. Average wind speed in m/s
These data are highly distorted by the representation of average values for the month. Thereby recommended daily update, if the information on the wind speed. When applying a layer of wind speed data, during of a storm warning, specific locations of avalanche can be shown Figure 7.
3.3.3 Temperature
According to date issued of RSE "Kazgidromet" the average temperature in the winter 2014 was about 5 0C (Table 2,
Figure 6). This weather has more anomalous effects in mountainous terrain, as there is a slow thawing of the lower strata of the snow cover.
Months Decem
ber
January February March April
The average value of the temperature,
0С
-5,8 -5,2 -5,3 2,9 4,3
Table 2. The average value of the temperature
Figure 6. The average temperature in winter 2014 in the alpine resort area Shimbulak
Estimate the temperature of the earth's surface is possible and through satellite imagery. The SRM accepts either the daily mean temperature or two temperature values on each day Tmax , Tmin. (Alam et al., 2010).
Negi H.S. has been carried out to develop an algorithm for the estimation of snow surface temperature using MODIS thermal bands data for NW-Himalaya (Negi H.S., et al., 2007).
The process of obtaining the raster with the values of the temperature is described in detail in (Nagornyik, 2014). Landsat-8 images consist of 11 spectral ranges in which 10 and 11 channels, far infrared, which allows them to analyze the energy of the earth's surface, rather than a reflection of sunlight. Using ArcGIS for Desktop and knowing the conversion formulas, we can calculate the brightness temperature of the radiation transmitted through the atmosphere (Top of the atmosphere reflectance). It will not be the true temperature of the earth's surface, but close and allows to identify temperature anomalies. In the future, the brightness temperature can be converted into value the earth's surface (Nagornyik, 2014).
It should be noted that the formula used for the conversion of
the company's website Landsat:
zone (Figure 7), which in turn helps to avoid (bypass) hazardous areas.
Figure 7. Avalanche zones in the mountainous resort area Shimbulak Trans-Ili Alatau
4. CONCLUSION
In GIS programs developed Geomodel showing the most dangerous areas, by processing satellite images and overlay information on the DTM weather. Data on the weather conditions can be obtained from the official meteorological services, or by treatment with satellite imagery in GIS programs.
Using satellite images compared with the measured data have a number of advantages, as they allow to cover any area of a certain time, while especially the mountainous areas not covered by the meteorological. In this regard, the use of satellite images and their availability allows you to perform simulation of avalanche zones at any part of the earth's surface.
In general, scientific and practical value created DЕM is connected not only with the ability to apply them in evaluating and forecasting the development of dangerous natural processes, but also in the evaluation of relief, soil, vegetation and geosystems in general, it is also useful for emergency services.
REFERENCES
Alam A., Sheik A.H., Bhat A., Shah A.M., Snowmelt runoff estimating of a Himaliyan watershed through Remote Sensing, GIS and Simulation Modelling. Access: http://www.isprs.org/proceedings/XXXVI/part4/RS-GEO-9.pdf
Birkeland K. W. and Mock C. J., 2001. The Major Snow Avalanche Cycle of February 1986 in the Western United States. Kluwer Academic Publishers. Natural Hazards 24. pp.75–95
Borut Vrščaj, Joël Daroussin, Luca Montanarella, 2007. SRTM as a Possible Source of Elevation Information for Soil-landscape Modelling. Lecture Notes in Geoinformation and Cartography 2007, pp. 99-120
Climbing Elbrus. http://www.strahu-net.com
Glade T, Anderson M.G., Crozier M.J., 2005. Landslide Hazard and Risk, John Viley and Sons, LtD
Jameson B., Stethem C., 2002. Snow Avalanche Hazards and Management in Canada: Challenges and Progress. Natural Hazards 26: 35–53, 2002. Kluwer Academic Publishers. Printed in the Netherlands
Holler Peter, 2007. Avalanche hazards and mitigation in Austria: a review. Natural Hazards. 43. pp.81–101 http://download.springer.com/static/pdf
How Slope works. ArcGIS Help10.1 http://resources.arcgis.com/en/help/main/10.1/index.html#//0 0q90000001r000000
Klimenko E., 2013.Verification of SNOWPACK model in the Western Caucasus, Russia, for spatial assessment of snow cover stability. // Proceedings of International Snow Science Workshop. pp.70 - 176.
Leroi E., 1996. Landslides hazard-risk maps at different scales: objectives, tools and developments. In: Senneset K, ed. Landslides. Rotterdam: Balkema, pp.35-51
Martinec J., Rango A.,1998. Snowmelt Runoff Model (SRM)
User's Manual. Access:
http://aces.nmsu.edu/pubs/research/water/SRMSpecRep100.p df
McClung D, Schaerer P., 1993. The avalanche handbook. The Mountaineers, Seattle.
Mihalić Snjezana, 1998. Recommendations for Lanslide Hazard and Risk Mapping in Croatia. http:/hrcak.srce.hr/file/6405
Mears A. I., 1992. Snow avalanche hazard analysis for land-use planning and engineering, Colorado Geological Survey Bulletin 49.
Mokrov E.G., Solovyev A.Y., 2010. Using the model of
snow cover «SNOWPACK» to determine the parameters of
the avalanche. [Electronic resource]: Earth's Cryosphere,
HIV, №2. pp.79-86. http://www.izdatgeo.ru
Nadim F., Kjekstad O., Peduzzi P., Herold C., Jaedicke C., 2006. Global landslide and avalanche hotspots. Landslides 3. pp.59–173
Negi H.S., Thakurand N.K., Mishra V.D., Estimation and validation of snow surface temperature using Modis data for snowavalanche studies in NW-Himalaya. Journal of the Indian Society of Remote Sensing, Vol. 35, No. 4, 2007
Nagornyik K. Space thermometer. http://esri-cis.ru/blogs/?page=post&blog=arcgis&post_id=kosmicheskiy -termometr.
Paramonov D.A., 2005. GIS support for large-scale mapping of debris flows. Moscow. Geoinformatics. pp.10-15
Peckham, Robert Joseph, Jordan, Gyozo (Eds.), 2007. Digital Terrain Modelling. Development and Applications in a Policy Support Environment.
Ramanathan R., Aydilek A. N., Tanyu B.F., 2015. Development of GIS-based failure investigation system for highway soil slopes. Front. Earth Science, 9(2). pp165-178
Shopskaya N.B.. 2012. The use of remote sensing data to map support environmental monitoring in the Stavropol region. Bulletin APC Stavropol. 2 (7). pp.119-122.
Silaev A.V., Sorokovoy A.A.. 2012.GIS-based analysis of the dynamics of cultivated areas of Tunkinskaya basin. Geological surveying and mapping. Moscow. №11.pp.53-57.
Soloviev A.S., Kalach A.V., Psarev S.A., 2012. Development of avalanche during the melting snow on the slopes.The Internet magazine "Technology technospheric security". Vol. 4 (44)-August. http://www.ipb.mos.ru/ttb
Surfer 12 Full User's Guide - Golden Software . http://downloads.goldensoftware.com/guides/Surfer12_Users _Guide_Preview.pdf
Stethem Chris et al. 2003.Snow Avalanche Hazard in Canada
– a Review. Natural Hazards 28: 487–515. Kluwer Academic Publishers. Netherlands.
The weather in the mountains. [Electronic resource]: Access: http://adrenalinicsilence.kz/pogoda-v-gorax.
Using the USGS Landsat 8 Product. http: //landsat.usgs.gov/Landsat8_Using_Product.php