Validation of spectral continuity between PROBA-V and SPOT-VEGETATION global daily
datasets
W. Dierckx a, *, E. Swinnen a, P. Kempeneers a a
Flemish Institute for Technological Research (VITO), Remote Sensing Unit, Boeretang 200, 2400 Mol, Belgium – [email protected]
KEY WORDS: PROBA-V, Global, Daily, SPOT-VEGETATION, NDVI, Inter-calibration
ABSTRACT:
Spectral consistency with SPOT-VEGETATION is an important mission objective for PROBA-V, in particular for its 1 km products. This must allow service providers such as the Copernicus Global Land Service to extend the 16-year long timeseries of SPOT-VEGETATION global 1km data with similar PROBA-V products. To evaluate the extent of spectral consistency, an evaluation of spectral response differences is performed by applying the spectral response of PROBA-V and SPOT-VEGETATION 2 to a spectral library of representative global land cover conditions. Datasets for surface reflectance values and Normalized Difference Vegetation Index (NDVI) are thus established for both missions. Through linear regression between the two datasets, spectral correction functions are defined, which can be used to improve the spectral consistency between PROBA-V and SPOT-VEGETATION products. The correspondence between PROBA-V and SPOT-VEGETATION products is then evaluated for the overlapping period when products from both missions were available. The effect of the spectral correction functions is assessed by comparing the correspondence obtained with and without this spectral correction applied. For the NDVI product, an additional offset correction is defined based on a limited sample of the overlapping period. The final spectral correction functions are then evaluated over the full overlapping period between PROBA-V and SPOT-VEGETATION. Discrepancies are observed which indicate a temporal behavior with respect to the correspondence of the mission products. Such temporal behavior can’t be explained by spectral response differences, and therefore other causes are investigated.
1. INTRODUCTION
PROBA-V is the direct successor mission to SPOT-VEGETATION, which provided near-daily global coverage of vegetation at 1km resolution from 1 May 1998 up to 31 May 2014. As one of its main objectives, PROBA-V provides continuity of the SPOT-VEGETATION time series. To achieve this, its mission definition fulfills the same near-daily global coverage and provides products at 1km and 300m resolution in the same spectral bands: Blue, Red, NIR, SWIR (Dierckx et al., 2014). PROBA-V is currently operational and has been operational since 15 October 2013, thereby ensuring an overlapping period with SPOT-VEGETATION products of 7.5 months.
Although the PROBA-V sensor was spectrally defined as similar as possible to SPOT-VEGETATION, there are nevertheless differences to cope with, related to differences in the camera system and geometry, but also associated with spectral characteristics (Sterckx et al., 2014). In this study, these aspects have been assessed in view of the extension of the NDVI time series of SPOT-VEGETATION with NDVI time series from PROBA-V 1 km products.
A consistent transfer between these time series is an important requirement from the Copernicus Global Land Service (CGLS), which operates a multi-purpose service component of bio-geophysical products at global scale. For time-series analysis, the application of correction functions that account for spectral response differences between sensors significantly improves the consistency. Such correction functions have been derived from a spectral library thar originates from spectral measurements or
simulations (Trishchenko, 2002; Steven et al., 2003; Gonsamo et al., 2013). This approach has been used to derive spectral response correction functions that must be applied to PROBA-V to obtain data similar to SPOT-PROBA-VEGETATION. This spectral correction has then been evaluated by comparing paired ten-daily 1km top-of-canopy composites from both missions.
2. METHOD
2.1 Derivation of spectral correction functions
Global representative vegetation spectra are generated using the coupled PROSPECT-5 and 4SAIL models, i.e. PRO4SAIL from (Jacquemoud et al., 2009). The parameterization of the different input variables is defined based on similar simulations performed by (Baret et al., 2007, Gonsamo & Chen, 2013, Weiss et al., 2010), and specified in Table 1. The sampling scheme is according to a full orthogonal experimental plan (Bacour et al., 2002), where variables are divided in equally spaced classes and all combinations of classes are sampled once. This process allows accounting for all the interactions, while having the range of variation for each variable densely and near randomly populated.
Input variable
Unit Distribution law LB UB Mode Std No of
classes
Chlorophyll content Cab g.cm-2 Trunc. Gauss. 15 100 50 30 3
Carotenoid content Car g.cm-2 Constant 5 5
Brown pigment content
Cbrown - Trunc. Gauss. 0 1.5 0 0.6 2
Equivalent water thickness
Cw g.cm-2 0.008 0.08 0.03 0.03 2
Leaf mass per unit leaf area
Cm g.cm-2 Trunc. Gauss. 0.002 0.02 0.0075 0.0075 2
Structure coefficient Ns - Trunc. Gauss. 1 4.5 1.5 1 2
Average leaf inclination
Angl degrees Trunc. Gauss. 30 85 60 20 3
Leaf area index LAI - Uniform 0 8 - - 4
Hot spot Hspot - Trunc. Gauss. 0.001 1 0.1 0.3 2
Sun zenith angle Tts Degrees Uniform 0 90 3
Observation zenith angle
tto Degrees Uniform 0 60 3
Relative azimuth Psi Degrees 2x Gauss. 50 230 2
Soil coefficient psoil - Uniform 0 1 2
Diffuse/direct radiation
skyl % Constant 70 70
Table 1. Input specifications for PROSAIL
The spectra are upscaled to top-of-atmosphere spectral radiances using MODTRAN 5 (Berk et al., 2005) with the parameters listed in Table 2, and using a fixed and standard illumination and observation geometry (TTs=45°, TTo=0° and relative azimuth = 0°), commonly used to normalize satellite observations (Gonsamo et al., 2013).
Input variable Unit Law Values
Table 2. Input specifications for MODTRAN 5
Top-of-atmosphere sensor radiance values are derived by convolution of the spectral radiances with the sensor spectral response functions of PROBA-V and SPOT-VEGETATION (Figure 2). From this, top-of-atmosphere reflectance values can be derived using
(1)
where
= top-of-atmosphere reflectance = top-of-atmosphere radiance
= solar irradiance, from (Thuillier et al., 2003) TTs = solar zenith angle, set to 45° for all cases Band i = Blue, Red, NIR, SWIR
Figure 2. Spectral response functions of VGT2 and PROBA-V, superimposed with a spectrum of green grass
The top-of-atmosphere reflectance values can finally be transformed to top-of-canopy reflectance by downscaling with the same atmospheric variables just for upscaling the original spectra.
Spectral correction functions are derived through ordinary least squares regression (OLS) of the VGT2 and PROBA-V datasets, both for top-of-canopy reflectance and top-of-atmosphere reflectance, and this for all bands. The spectral correction function is of the form
(2)
where
Band i= Blue, Red, NIR, SWIR
The effectiveness of the linear regression is evaluated by calculating the agreement coefficient and the root-mean-square
error (RMSE). All statistical measures are defined in the Appendix.
2.2 Comparison of PROBA-V and VGT2
An initial evaluation is made on a set of seven ten-daily top-of-canopy composites of PROBA-V and VGT2 within the overlapping period: 01/01/2014 to 01/03/2014. The evaluation is based on a systematic spatial subsampling of global composites, whereby the center pixel of each zone of 21 x 21 pixels is selected. The global extent outlines a region from 180°W to 180°E, 75°N to 56°S. Only pixels identified by both PROBA-V and VGT2 as clear and good observations are selected from the subsampled composites. To reduce the effects of differences in viewing geometry and orbital overpass, the following additional selection criteria were used:
1. Pixels are of the same day (this can be derived from the TIME data layer in the S10 Products)
2. View Zenith Angle < 30° (for both PROBA-V and VGT2)
3. View Azimuth Angle difference < 25° ( ie. |VAAPROBA-V - VAAVGT2 | <25°)
4. Solar Zenith Angle difference < 10° ( ie. |SZAPROBA-V - SZAVGT2 | <10°)
As such, the evaluation is based on a sample of approximately 7000 paired observations from these 7 paired composites. Several statistical measures are calculated for this sample between PROBA-V (X) and VGT2(Y): geometric mean regression, the Mean Squared Difference (overall, unsystematic and systematic), and the Mean Bias Error (MBE). These measures are defined in the Appendix.
A final evaluation is made on the full overlapping period from 21/10/2013 to 21/05/2014, following the same methodology, and comparing the correspondence between PROBA-V and VGT2 datasets with and without the spectral correction applied.
3. RESULTS
3.1 TOA spectral correction functions
(a)
(b)
(c)
(d)
(e)
Figure 3. Scatterplots between simulated TOA reflectances of PROBA-V and VGT-2 for (a) Blue; (b) Red; (c) NIR; (d) SWIR; (e) NDVI
OLS offset OLS slope agreement
coefficient RMSE
BLUE 0.0034 0.9971 0.999 0.0032
RED 0.0029 0.9983 0.999 0.0030
NIR 0.0024 1.0005 0.999 0.0031
SWIR 0.0062 1.0214 0.986 0.0100
NDVI 0.0005 0.9843 0.997 0.0107
Table 3. TOA spectral correction functions between PROBA-V and VGT2
For NDVI, an increase of 1.6% is found, which judging from the agreement coefficient appears to be systematic, indicating that a spectral correction function should be beneficial for the consistency of the NDVI products.
3.2 TOC spectral correction
Figure 4 shows the linear regression results for the TOA reflectance datasets. Table 4 summarizes the resulting correction functions, again with AC and RMSE values provided.
OLS offset OLS slope agreement
coefficient RMSE
BLUE 0.0015 1.0056 1.000 0.0020
RED 0.0024 1.0019 0.999 0.0031
NIR 0.0001 0.9980 1.000 0.0020
SWIR 0.0021 0.9867 0.999 0.0039
NDVI -0.0042 0.9859 0.999 0.0139
(a)
(b)
(c)
(d)
(e)
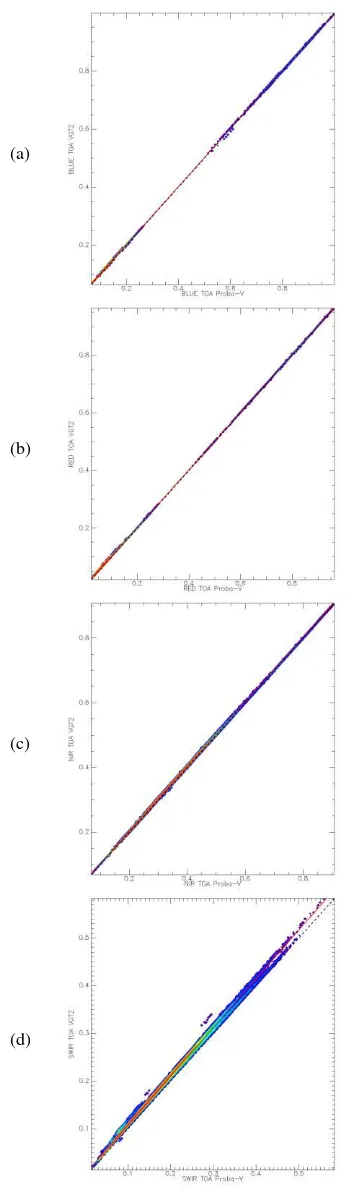
Figure 4. Scatterplots between simulated TOC reflectances of PROBA-V and VGT-2 for (a) Blue; (b) Red; (c) NIR; (d) SWIR; (e) NDVI
All results except the SWIR band results show comparable RMSE and agreement coefficients..For SWIR, the TOC correction shows better RMSE and agreement than the TOA correction. Interestingly, for all reflectance band results the slope correction values show the opposite trend from those found for the TOA datasets, particularly for the SWIR band. Only the NDVI results shows a similar trend in its TOA and TOC correction functions.
3.3 Evaluation over the limited overlapping period
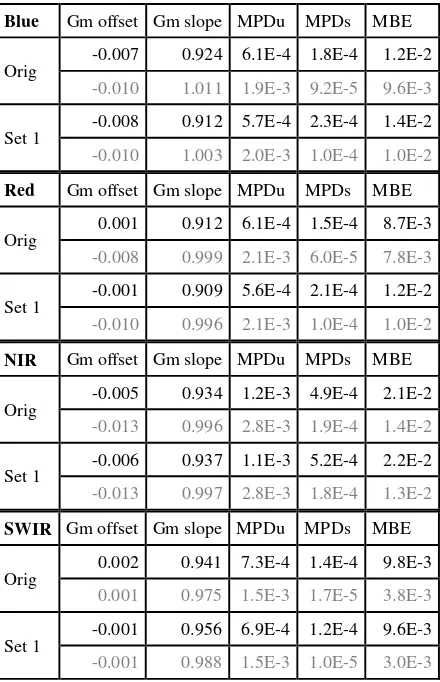
Table 5 shows statistical measures comparing PROBA-V TOC composites against corresponding VGT2 TOC composites. Three sets of PROBA-V data are considered. The original set are PROBA-V composites without spectral correction. Set1 are PROBA-V composites with the TOC spectral correction functions from section 3.2 applied. As a residual offset was apparent after this correction, a Set2 correction was defined which consists of the set1 correction, with an additional offset correction based on the regression results from the Set1 dataset. The comparison for each of this sets is done for the Blue, Red, NIR and SWIR TOC reflectance products, as well as the TOC NDVI product.
Blue Gm PROBA-V data and for 2 sets of spectrally corrected PROBA-V data
The Gm offset was subsequently applied to the Set1 dataset, and evaluated as correction Set2. Set2 clearly shows reduction of the systematic error for all but the SWIR product, and thus a reduction of the MBE and MPDs. The remaining error is largely due to unsystematic difference (MPDu), which implies that remaining errors show variations over time, and such variations can not be improved by static spectral correction functions.
3.4 Evaluation over the full overlapping period
The additional offset introduced in correction Set2 is derived from the regression results on the Set1 dataset. The cause of this offset could be attributed to other causes which include differences in illumination conditions and differences in observation geometry. For the reflectance products, the additional offset has not been applied in order to preserve the relationship between reflectances and the illumination and observation geometry. Thus, the additional offset has only been considered for the NDVI product.
The effectiveness of the Set1 and Set2 corrections is evaluated over the full overlapping period as was done for the limited period (Table 6, Table 7).
Blue Gm offset Gm slope MPDu MPDs MBE the original PROBA-V data and the Set1 PROBA-V data
Table 7. Statistical measures for the comparison of PROBA-V (X) and VGT2 (Y) TOC NDVI composites for the original
PROBA-V data, Set1 and Set2 PROBA-V data
GMslope, indicating a decrease in the spectral consistency of PROBA-V and VGT2.
For the NDVI Set1, similar trends are observed: a lower value of GM slope, and an increase of the MBE after correction. The offset correction of Set2 does seem to correct for the offset between the two datasets, but spectral consistency is not noticeably improved. This is clearly a different result from the limited overlapping period.
3.5 Explanation of the difference
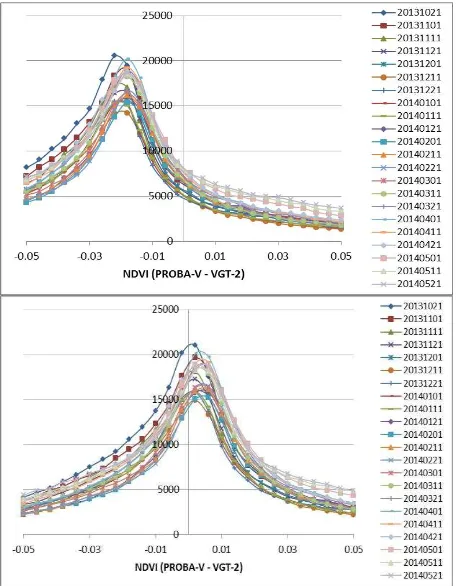
The different results found between section 3.3 and 3.4 between indicate that a change has occurred in the correspondence between PROBA-V and VGT2, between the limited overlapping period in the 2 months of 2014, and the full overlapping period which contains data from October 2013 to May 2014. This temporal behavior is exposed by showing the histogram of differences between PROBA-V NDVI and VGT-2 NDVI, for each of the ten-day composites of the overlapping period (Figure 5). In this result, no filtering for viewing conditions is then, ie. only selection of clear and good paired observations is performed. There appears to be a stronger consistency of the difference in the limited overlapping period, which starts to diverge for earlier and later observations. The Set2 results show that the effect of the additional offset correction is beneficial for the correspondence between PROBA-V and VGT2. Still, an important dispersion exists between the composites, which explains the poor statistical performance noted in section 5.4.
The GMslope regression is also derived for the NIR and Red products in each of the ten-daily composites, taking into account all clear and good paired observations, without any additional restrictions on observation geometry or illumination conditions. This is compared with a correction function for a processing issue found for VGT2 products, which is related to the sun-earth distance factor (VGT, 2014). A strong correlation is found (Figure 6), although the correction should be applied to the VGT2 top-of-atmosphere data to provide full confirmation.
Figure 5. Histogram of the difference between the original (top), Set1 (middle) and Set2 (bottom) PROBA-V NDVI and VGT2 NDVI. Different curves are different composites
0.92 0.94 0.96 0.98 1 1.02
0.85 0.86 0.87 0.88 0.89 0.9 0.91 0.92 0.93 0.94 0.95
3/10/13 22/11/13 11/01/14 2/03/14 21/04/14 10/06/14
RED
GMRslo original 1/CF
0.91 0.93 0.95 0.97 0.99 1.01 1.03
0.92 0.94 0.96 0.98 1 1.02 1.04
3/10/13 22/11/13 11/01/14 2/03/14 21/04/14 10/06/14
NIR
GMRslo original 1/CF
4. DISCUSSION AND CONCLUSION
The derivation of spectral correction functions between PROBA-V and SPOT-VEGETATION 2 has shown that the spectral consistency is initially very good. Almost 1:1 regression functions were established for Blue, Red, and NIR bands, showing only a noticeable change in the SWIR band (also known by design), and the derived NDVI product.
The application of the spectral correction function to the limited overlapping period in the first months of 2014 showed initially a good agreement, and led to the recommendation to apply an additional offset to the NDVI product. Similar offsets were not applied to the reflectance products, in order to preserve the relationship between reflectance value and its illumination conditions and observation geometry.
The final evaluation over the full overlapping period however showed a decrease in the correspondence between PROBA-V and VGT2, which was not improved by the spectral correction. A temporal trend in the correspondence between PROBA-V and VGT2 seems to be the root cause, as could be judged from the examination of differences between individual paired ten-day NDVI composites. The correspondence appears to be optimal in the first months of 2014, ie. the limited overlapping period.
Such temporal behavior can’t be attributed to a difference in “Global Land Component of the GMES Initial operations”.
REFERENCES
Bacour, C., Jacquemoud S., Tourbier Y., et al. 2002. Design and analysis of numerical experiments to compare four canopy reflectance models, Remote Sensing of Environment, 79(1), pp. 72-83.
Baret, F., O. Hagolle, B. Geiger, et al. 2007. LAI, fAPAR and fCover CYCLOPES global products derived from
VEGETATION: Part 1: Principles of the algorithm. Remote Sensing of Environment, 110(3), pp.275-286.
Berk, A., et al. 2005. MODTRAN 5: a reformulated atmospheric band model with auxiliary species and practical multiple scattering options: update. In: Defense and Security. International Society for Optics and Photonics, pp. 662-667.
Dierckx, W., Sterckx, S., Benhadj I., et al. 2014. PROBA-V mission for global vegetation monitoring: standard products and image quality. Int. J. Remote Sens., 35(7), pp. 2589–2614.
Gonsamo, A., and J.M. Chen 2013. Spectral response function comparability among 21 satellite sensors for vegetation monitoring. IEEE Transactions on Geoscience and Remote Sensing, 51, pp. 1319-1335.
Jacquemoud, S., Verhoef, W., Baret, F., et al. 2009. Remote Sensing of Environment PROSPECT + SAIL models : A review
of use for vegetation characterization. Remote Sensing of Environment, 113, S56–S66.
Saint, G. 1995. VEGETATION Onboard SPOT4: Mission Specifications – Version 3. Accessed March 25, 2014. www.vgt.vito.be/pages/VegetationSystem/mission.htm
Sterckx, S., Benhadj, I., Duhoux, G., et al. 2014. The PROBA-V mission : Image Processing and Calibration. Int. J. Remote Sens., 35(7), pp. 2565–2588.
Steven, M. D., Malthus, T. J., Baret, F., et al. 2003. Intercalibration of vegetation indices from different sensor systems. Remote Sensing of Environment, 88(4), pp.412–422.
Trishchenko, A. P., Cihlar, J., Li, Z. 2002. Effects of spectral response function on surface reflectance and NDVI measured with moderate resolution satellite sensors. Remote Sensing of Environment, 81(1), pp. 1–18.
Thuillier, G., Hersé, M., Simon, P. C., et al. 2003. The solar spectral irradiance from 200 to 2400 nm as measured by the SOLSPEC spectrometer from the ATLAS 1-2-3 and EURECA missions, Solar Physics, 214(1), pp. 1-22.
VGT, 2014. Reflectance communication letter. Accessed on March 25, 2014.
http://www.vgt.vito.be/pdf/Reflectance_communication_letter_ V1.0.pdf.
Weiss, M., Baret, F., Eerens, H., et al. 2010. FAPAR over Europe for the past 29 years: A temporally consistent product derived from AVHRR and VEGETATION Sensors. In: Recent Advances in Quantitative Remote Sensing (RAQRS III), Valencia, Spain, pp. 428-433.
APPENDIX: USED METRICS
The GM model is of the form
(3) where
The statistical measures used are: