www.elsevier.com / locate / econbase
Elasticity of demand for search
a b ,
*
Michael A. Arnold , Steven A. Lippman
a
Department of Economics, University of Delaware, Newark, DE 19716-2720, USA
b
The Anderson Graduate School of Management, University of California, Los Angeles 90095-1481, CA, USA
Received 23 August 1999; accepted 27 October 1999
Abstract
This paper investigates the demand elasticity of search. We provide a new characterization of monotone hazard rate and of the first-order condition determining the optimal reservation price, and prove that the demand for information is elastic if the hazard rate function h for the distribution of offers is decreasing and inelastic if h is increasing. 2000 Elsevier Science S.A. All rights reserved.
Keywords: Search; Elasticity; Hazard rate
JEL classification: D83
1. Introduction
The standard search model is a particularly useful tool for analyzing a wide range of economic problems; examples include job search, firms investing in R&D in an attempt to discover a new
1
product or process, and an asset owner’s search for a buyer. Despite the importance of information acquisition via search, the literature contains no discussion whatsoever regarding the elasticity of demand for information.
This paper investigates this elasticity in the basic search model. Denoting the offer distribution by F and its density by f, we show that the shape of the hazard rate function h is critical, where h is defined
¯ ¯
by h(t)5f(t) /F(t) and F(t);12F(t). In particular, Theorem 2 reveals that the demand for information is elastic if h is decreasing and inelastic if h is increasing.
In Section 2 we provide an alternative characterization and somewhat novel interpretation of the
*Corresponding author. Tel.: 11-310-825-3649; fax:11-310-474-4213.
E-mail addresses: [email protected] (M.A. Arnold), [email protected] (S.A. Lippman)
1
Lippman and McCall (1993) trace the evolution of search theory and illustrate its breadth of application and centrality to modern economics.
hazard rate as it applies to the distribution of offers in a search model. Section 3 presents the basic search model, derives an alternative first-order condition for the optimal reservation price, and establishes the relationship between hazard rates and the elasticity of demand for search. The concluding section suggests potential policy applications for further research.
2. Interpreting the hazard rate of the offer distribution
While we make use of Theorem 1 to study the elasticity of search, it is of interest in its own right. Theorem 1 reveals the close connection between monotonicity of the hazard rate function h of the random variable X and monotonicity of the expected gain D defined by D(x);E(XuX$x)2x. The
`
function H defined by H(x)5ex (t2x)dF(t) plays a prominent role in search theory. It is useful to
` ¯ ¯
observe that H(x)5ex tdF(t)2xF(x)5 D(x)F(x).
Theorem 1. Let X$0 be a random variable with density f, cumulative distribution function F, and
hazard rate function h. The expected gainDis non-increasing [non-decreasing] if h is non-decreasing
[non-increasing].
` 2
Proof. For any non-negative random variable Z, E[Z]5e0 P(Z.s)ds. Consequently, setting
1 ` ` ¯ ` ¯
The inequality is reversed for h non-increasing. h
Appendix A demonstrates that the converse of Theorem 1 is not true.
While intuition about hazard rates when the random variable being analyzed is the length of time
3
until a specified event occurs is well developed, an economic interpretation of a monotone hazard rate when the random variable X represents a monetary value to an individual is not well developed. Theorem 1 enables us to proffer the following economic interpretation of hazard rates. Suppose your income is x; label all those individuals whose income is x or more as your financial peers. ThenD(x) is the average amount by which your income lags that of your peers. To the extent thatD(x) measures one’s dissatisfaction, Theorem 1 asserts that dissatisfaction increases with income if h is decreasing. Consider the empirical distribution function F of adjusted gross income for federal tax returns of individuals in 1992. The hazard rate h is decreasing for x$$40,000. The decrease is particularly rapid for incomes in excess of $75,000. (Being rich has its disadvantages.) Details are provided in Appendix B. of integration at the third equality is justified by Tonelli’s Theorem.
3
Given the importance of hazard rates in the analysis that follows, a brief characterization of hazard rates for common distribution functions and of more general hazard rate monotonicity properties is of
2gt
interest. The exponential distribution, F(t)512e for t$0 withg .0, has a constant hazard rate: h(t)5g. The Weibull distribution (the most commonly used distribution in the reliability literature),
u
2(gt ) u21
F(t)512e for t$0 with u.0 and g.0, has hazard rate function h(t)5ug(gt) for t.0 whence h is increasing ifu.1 and decreasing ifu,1.
As demonstrated by Barlow and Proschan (1975, pp. 74–77), more general hazard rate
monotonici-4
´
ty properties can be established by analyzing the class of Polya frequency functions of order 2 (PF ).2
They demonstrate that the hazard rate function for both the normal and the truncated normal
u u21 2gt
distributions is non-decreasing. Additionally, the Gamma distribution, f(t)5g t e /G(u) for t$0 with u.0 and g.0, has decreasing hazard rate for u,1 and increasing hazard rate for u.1. For u51 both the Weibull and the Gamma reduce to the exponential distribution.
3. Elasticity
Consider the standard infinite horizon, discrete time search model with recall. The independent offers X have common distribution F with density f, an infinite number of offers can be entertained,i and the searcher pays an out-of-pocket cost c for each offer he solicits. We assume E(X )i .c to ensure that the search activity is profitable. The offers can be job offers, technological advances, or prices. Upon receiving an offer, he observes its value and elects either to accept the offer or to receive another offer. It is well known that the optimal policy is a reservation policy: accept the first offer
5
exceeding the reservation price x. Let j denote the optimal reservation price. Because the searcher rejects all offers below j, his expected return (i.e. the value of the problem to him) is at least j; furthermore, his willingness to accept any offer above j demonstrates that his expected return is at most j. Thus, his reservation price j is also his expected return. It is also well known that j can be computed myopically by limiting consideration to the tradeoff between taking precisely one more observation versus stopping (and accepting the currently available offer). This myopic computation of the searcher’s optimal reservation value is obtained by solving x5Ehmax(X, x)j2c. Rearranging this first-order condition reveals that j is the unique solution to
c5H(x). (1)
This first-order condition merely asserts that the marginal cost of obtaining precisely one more offer equals the expected gain to taking one more offer.
It comes as no surprise that the stopping timetx;minhn$1: Xn$xj may be relevant in analyzing the search problem. In particular, suppose X05x so that the first-order condition c5H(x) equates the marginal cost and the marginal benefit of the stopping time t0. (Of course, t051.) The first-order
4
The results most relevant to our analysis include the following; F has increasing hazard rate (so demand for search is ¯
inelastic) if and only if F is PF ; if f is a PF density on [0,2 2 `), then F has increasing hazard rate; and if f is a density on [0,
`) and log f is convex, then F has decreasing hazard rate.
5
condition can also be written in terms oftx. As the (expected) number of observations required until an observation with a value of at least x is received is a geometric random variable with parameter
¯ ¯
F(x), the demand for search is given by q(x; c)51 /F(x), and the total cost T(x; c) of search associated
with the stopping timetx when X05x is obviously given by
¯
T(x; c)5c /F(x). (2)
Similarly, the expected gain D(x) associated with tx when searching with recall and X05x is ¯
D(x);E(XuX$x)2x. BecauseD(x)5H(x) /F(x), the usual first-order condition (1) associated witht0 when X05x can be rewritten in terms of the stopping time tx:
T(x; c)5 D(x). (3)
In addition to the mathematical equivalence between (1) and (3), the economic intuition is clear: the optimal reservation price equates the total cost T(x; c) of obtaining an acceptable offer with the expected gainD(x) which accrues to finding an acceptable offer when searching with recall and X05x. Because elasticity determines the relationship between changes in the price of search and the total expenditure on search, Eq. (3) makes clear that the elasticity of demand for search is determined by the sign of D9(x).
Because H(x) is decreasing in x, the optimal reservation price j decreases as c increases: the number of observations required to locate an acceptable offer stochastically decreases in c. But the impact of an increase in c on the total expenditure T(j; c) on search is unclear: does the expected
¯
number of offers 1 /F(j) decrease faster than c increases? Theorem 2 reveals that the answer to this question depends upon the hazard rate function.
Theorem 2. If F has non-decreasing hazard rate, then the total expenditure T(j; c) on search is an increasing function of c: the demand for search is inelastic. If F has non-increasing hazard rate, then T(j; c) is a decreasing function: the demand for search is elastic.
Proof. Coupling (3) with Theorem 1 and dj/ dc,0 establishes the theorem. h
To demonstrate the power of Theorem 2 consider the exercise of computing the elasticity of ¯
demand for information directly. As the demand for search is q(j; c)51 /F(j), where j is the optimal reservation value as a function of c, the elasticity of demand is
dq(j; c) c dj ¯ 2 c ¯ 2
]]] ]]]
FS
]D
G
]]]h5 dc 5 f(j)dc /F(j) 5 2cf(j) /F(j) , (4)
q(j; c) q(j; c)
¯
where the last equality follows from dj/ dc5 21 /F(j). Finding a closed-form solution forhrequires solving the first-order condition (1) for j as a function of c which is seldom possible.
Theorem 2, however, asserts that determining whether the demand for information is elastic or
6
inelastic merely depends upon knowing whether the hazard rate is decreasing or increasing.
Although we cannot derive an expression forh in general, we can calculatehwhen X is distributed
6
uniformly on the interval [a, b]. To do so note that f(x)51 /(b2a) and F(x)5(x2a) /(b2a), so
2
¯
F(x)5(b2x) /(b2a), H(x)5(b2x) / 2(b2a), and from the first-order condition (1) j5b2
]]]
2(b2a)c. Substituting these expressions into (4) yields h5 21 / 2: the uniform distribution
œ
generates a constant elasticity of demand. A closed-form solution for h is easily obtained for the exponential distribution. Because the exponential distribution has a constant hazard rate, Theorem 2 impliesh$ 21 and h# 21:h5 21.
4. Conclusion
As shown, total expenditure on search is decreasing [increasing] in the search cost c if the offer distribution has decreasing [increasing] hazard rate. Unemployment insurance benefits and R&D investment tax credits are but two examples of government policies that subsidize the cost of search. To the extent that these policies are intended to encourage increased (non-governmental) investment in search by unemployed workers or in R&D by firms, our analysis suggests the importance of considering the hazard rate of the offer distribution when evaluating the effectiveness of these policies.
Appendix A
The counter-example finds D(x) strictly decreasing while h(x) is not monotone.
x 2
Define I(x)5e0h(s)ds by I(x)51.1x if 0 #x,0.9, 0.1x10.9 if 0.9#x,1, and x if x$1. Thus,
I9(x)5h(x) is not monotone. Because h is non-decreasing on [0.9, 1) and strictly increasing on [1,`),
we can conclude from Theorem 1 that D is strictly decreasing on [0.9, `).
¯
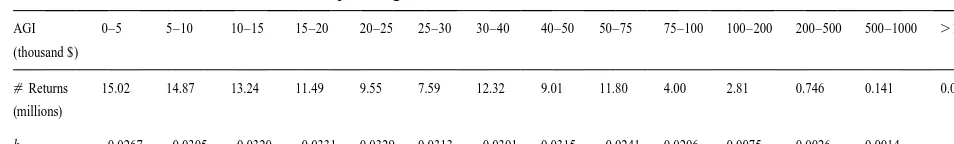
Table 1
a
Hazard rate for the distribution of US adjusted gross income in 1992
AGI 0–5 5–10 10–15 15–20 20–25 25–30 30–40 40–50 50–75 75–100 100–200 200–500 500–1000 .1000 (thousand $)
[Returns 15.02 14.87 13.24 11.49 9.55 7.59 12.32 9.01 11.80 4.00 2.81 0.746 0.141 0.067 (millions)
h 0.0267 0.0305 0.0320 0.0331 0.0329 0.0313 0.0301 0.0315 0.0241 0.0206 0.0075 0.0026 0.0014 –
a
Source: Table 1.4 of Internal Revenue Service, Statistics of Income, Publication 1304, revised April 1995.
Appendix B
Adjusted gross income (AGI) data for 1992 from United States federal tax returns for individuals and the hazard rate for the distribution of income are presented in Table 1. The hazard rate was computed assuming the density is constant over each income interval. For example, the probability that an individual’s income lies in the $5000–$10,000 interval is 0.132, and the estimated density is
¯
f¯0.132 / 550.0264. Dividing f by the probability that AGI exceeds $5000, which is F¯0.8667, generates h50.0305. Because we do not know the length of the interval with incomes exceeding $1,000,000, we cannot compute h for this interval.
References
Barlow, R.E., Proschan, F., 1975. Statistical Theory of Reliability and Life Testing, Holt, Rinehart, and Winston, New York. ´ Lippman, S.A., McCall, J.J., 1993. Search and the development of the economics of information. Estudios de Economıa 20,
223–249.