IMPROVEMENT WORK EFFICIENCY AND MANUFACTURING
PRODUCTIVITY AT PT. XYZ WITH LINE BALANCING ANALYSIS
Arief Suwandi(1) , Prianggara NAL(2)
(1), (2)
Industrial Engineering Dept. Esa Unggul University, Indonesia [email protected]
ABSTRACT
The era of globalization where is competitors continues to grow in competing, industrial enterprises charge for continuously improve performance and productivity with guaranteed quality and low cost and must be able to minimize waste which often occur in the operational area. PT. XYZ is a company that is production shoes massively, production planning should be notice, production scheduling and assignment each of the job. When is setting production process and improver planning in every work station a cross assembly will not efficient because arrive materials unbalanced between work stations. now days company issues is how increase the productivity of the plant, that is shoes soccer Nitro production by improving the working line or line balancing so production capacity can be increased.
Line balancing is one of affirmation jobs method into work stations interrelated in a production line so every work stations have a time which does not exceed the cycle time job, Reasearchers analyzed on assembling parts which consists of 34 process and 32 operator. Measurement cycle time every work stations, calculated normal time and frozen time cycle time for assembly maits are basic for doing equilibrium line. With ranked positional weight ( RPW ) / Helgeson – Birnie method work stations can be adaptations so result obtained after merging is 25 work stations incorporations, amount 23 of 32 people before the marger incorporation.
Keywords : line balancing, cycle time, work station, Ranked Positional Weight (RPW)
1. INTRODUCTION
Face market competition are more competitive along with technological changes in the industry and development of science, every industry in era globalization for keep on moving and continues to increase performance and productivity. Improving productivity with quality assured and low cost and minimize waste that is in every operational area often happen, constitute effort which is always and always be doing so the company can remain competitive and remain standing.
Same as manufacture of shoes industry, the need for shoes increasing and accompanied by getting smart cosisumers in selecting the most competitive products, so every manufacture of shoes industry must be able to absorb the desire of the market that can be satisfying customers and increase profits from the increase in production and increasing new model of shoes.
The increasing demand for products then industry must be able to add the production capacity in order to meet demand of customer.
The company who have product that are mass produced as PT. XYZ should pay attention to production planning, production scheduling and assignment each job. If the productions process of setting and improver planning then in every work stations. Cross assembly will not efficient because material arrival time were unbalanced between work stations.
The raised problem on this research are how way improve productivity in plant which is produced soccer shoes by repairing line of work or line balancing so the production capacity can be increased and improvement work efficiency.
2. THEORETICAL BACKGROUND
the production line so that each work station has a time that does not exceed the cycle time of a work station.
The balance of the production line began mass production line, where the production process must be shared by all operators so that the operator workload evenly. So in line balancing to learn how we design a production line in order to achieve load balance allocated to each work station accounts for the product.
Relationship or interplay of work with other work is described in a preliminary precedence diagram or diagrams, whereas the relationship is called a job precedence or precedence network (Bedworth, David D, 361; Elsayed, A 259).
3. RESEARCH METHOD 3.1 Line Balancing Method
The purpose of balancing the trajectory is to improve the efficiency of each work station and balancing the track. To achieve these objectives, until now there is no method that actually generates the optimal solution, but by using computer simulations. The following methods to achieve a balance of production lines:
analytical method
Is a method that can produce an optimal solution.
Example: Branch & Bound (operational research studies).
heuristic method
The method can produce the best solution, but not necessarily optimal. Some heuristic methods are commonly used:
Helgeson-Birnie method
This method is also called the method Ranked Positioned Weight (RPW).How to determine the weight of Precedence diagram starting from the last process, namely:
Weight (RPW) = time + Σ processes such operations that follow the operation processing time. Grouping operations into a work station on the basis of sequence RPW (from the largest) and also with regard barrier of cycle time.
1 7
Graph 2.1 illustrates the sequence of assembly work
1.
Raw time data for each work operation derived from the calculation of standard time job assembly operations.2. Desired cycle time. Desired cycle time is obtained from the speed of the assembly line production or of the longest operating time, if desired cycle time is smaller than the longest operation time. For example: if there is an assembly operation that takes more than 80 minutes (eg 100 minutes) then it is impossible to set a cycle time of 80 minutes. In this case, the cycle time is set at 100 minutes (which is the largest operating time). The consequences of the establishment of the actual cycle time is greater than the desired cycle time is that the cross assembly will not be possible to meet the demand so required overtime.
Helgeson-Birnie (Ranked Positional Weight):
1) Figure precedence diagram. 2) Determine the positional weight. 3) Sort the elements of work based on
positional weight from the highest to the lowest.
4) Continue by placing the elements of the work of the lowest to the highest positional weight at each work station. 5) If the stations are working overtime
(more than the cycle time), the exchange elements of the job to the next work station.
6) Repeat steps 4 and 5 above until all
of components that must be assembled , production planning play an important role in making production schedule, especially in setting up operations or work assignments that must be done. If setting and planning are not appropriate , then each work station assembly through have different production speeds . This will result in cross- assembly becomes inefficient due to the accumulation of material or semi-finished products between work stations unbalanced production speed. Side effects other compensation expenses is lost and negative psychological consequences for workers .
The issue of cross- assembly equilibrium stems from a combination of the assignment operator or group of operators
who occupy a particular workplace . Because the assignment of different work elements will lead to differences in the amount of unproductive time and the variation of the number of workers needed to produce a particular production output in a cross- assembly .
4. RESULT AND DISCUSSION
Data processing
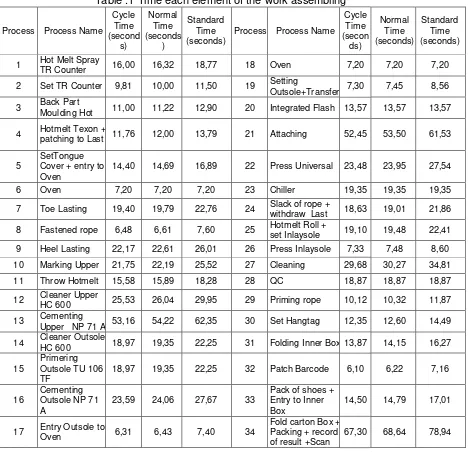
Researchers analyzed the assembling part consisting of 34 processes and 32 operators. Time each element of work can be seen in the table below.
Table .1 Time each element of the work assembling
Process Process Name
Cycle Time (second
s)
Normal Time (seconds
)
Standard Time (seconds)
Process Process Name
Cycle Time (secon ds)
Normal Time (seconds)
Standard Time (seconds)
1 Hot Melt Spray TR Counter 16,00 16,32 18,77 18 Oven 7,20 7,20 7,20
2 Set TR Counter 9,81 10,00 11,50 19 Setting
Outsole+Transfer 7,30 7,45 8,56
3 Back Part
Moulding Hot 11,00 11,22 12,90 20 Integrated Flash 13,57 13,57 13,57
4 Hotmelt Texon +
patching to Last 11,76 12,00 13,79 21 Attaching 52,45 53,50 61,53
5
SetTongue Cover + entry to Oven
14,40 14,69 16,89 22 Press Universal 23,48 23,95 27,54
6 Oven 7,20 7,20 7,20 23 Chiller 19,35 19,35 19,35
7 Toe Lasting 19,40 19,79 22,76 24 Slack of rope +
withdraw Last 18,63 19,01 21,86
8 Fastened rope 6,48 6,61 7,60 25 Hotmelt Roll + set Inlaysole 19,10 19,48 22,41
9 Heel Lasting 22,17 22,61 26,01 26 Press Inlaysole 7,33 7,48 8,60
10 Marking Upper 21,75 22,19 25,52 27 Cleaning 29,68 30,27 34,81
11 Throw Hotmelt 15,58 15,89 18,28 28 QC 18,87 18,87 18,87
12 Cleaner Upper
HC 600 25,53 26,04 29,95 29 Priming rope 10,12 10,32 11,87
13 Cementing
Upper NP 71 A 53,16 54,22 62,35 30 Set Hangtag 12,35 12,60 14,49
14 Cleaner Outsole
HC 600 18,97 19,35 22,25 31 Folding Inner Box 13,87 14,15 16,27
15
Primering Outsole TU 106 TF
18,97 19,35 22,25 32 Patch Barcode 6,10 6,22 7,16
16
Cementing Outsole NP 71 A
23,59 24,06 27,67 33
Pack of shoes + Entry to Inner Box
14,50 14,79 17,01
17 Entry Outsole to
Oven 6,31 6,43 7,40 34
Fold carton Box + Packing + record of result +Scan
For the calculation of the standard time on the work element 1 is Hot Melt Spray TR Counter as follows:
Ws = 16 seconds Wn = Ws x p = 16 x 1.02 = 16,32 seconds
Wb = Wn (1+A) = Wn + (A x Wn) = 16,32 + (0.15 x 16,32)
= 18,77 seconds Description:
The calculation of the standard time next working elements working together on elements 1
P=adjustment factor A= factor leeway
Line Balancing analysis and calculating In this study had a productive time per day of 480 minutes with a target of 115 pairs per hour for Nitro Soccer shoes. Products produced 920 pairs per day and number of hours worked 8 hours per day, so that the cycle time can be determined by:
Cycle Time = 8 hours x 3600 second 920 pairs
= 31,30 seconds/pairs
To track can be solved by balancing Rangked Positional Weight method.
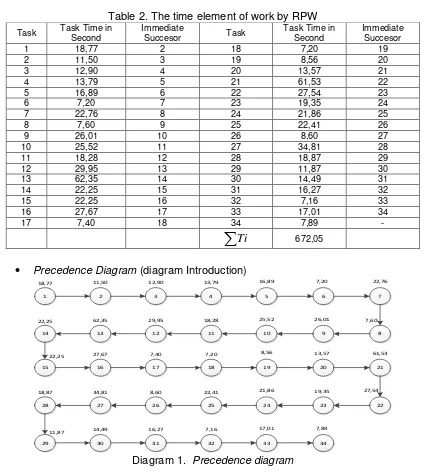
Ranked Positional Weight (RPW) / Helgeson – Birnie
Table 2. The time element of work by RPW
Task Task Time in
Second
Immediate
Succesor Task
Task Time in Second
Immediate Succesor
1 18,77 2 18 7,20 19
2 11,50 3 19 8,56 20
3 12,90 4 20 13,57 21
4 13,79 5 21 61,53 22
5 16,89 6 22 27,54 23
6 7,20 7 23 19,35 24
7 22,76 8 24 21,86 25
8 7,60 9 25 22,41 26
9 26,01 10 26 8,60 27
10 25,52 11 27 34,81 28
11 18,28 12 28 18,87 29
12 29,95 13 29 11,87 30
13 62,35 14 30 14,49 31
14 22,25 15 31 16,27 32
15 22,25 16 32 7,16 33
16 27,67 17 33 17,01 34
17 7,40 18 34 7,89 -
Ti
672,05 Precedence Diagram (diagram Introduction)
1 2 3 4 5
18,77 11,50 12,90 13,79 16,89
6 7
7,20 22,76
14 13 12 11 10
22,25 62,35 29,95 18,28 25,52
9 8
26,01 7,60
15 16 17 18 19
22,25 27,67 7,40 7,20 8,56
20 21
13,57 61,53
28 27 26 25 24
18,87 34,81 8,60 22,41 21,86
23 22
19,35 27,54
29 30 31 32 33
11,87 14,49 16,27 7,16 17,01
34 7,89
In Figure 4.1 illustrates the sequences of work to be done. This diagram also illustrates the interdependence between the elements work a job with other job elements, where the elements of the job that can not precede done before the element that preceded the work done in advance.
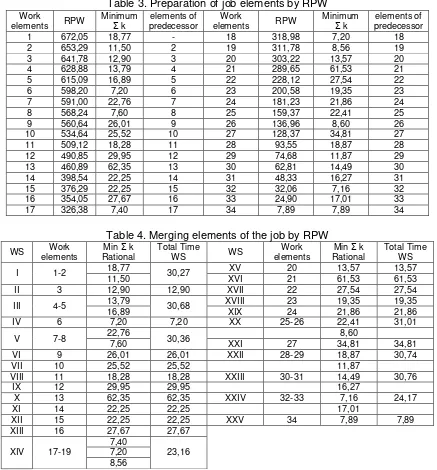
The minimum number of work stations
Table 3. Preparation of job elements by RPW
Work
elements RPW
Minimum
Σ k
elements of predecessor
Work
elements RPW
Minimum
Σ k
elements of predecessor
1 672,05 18,77 - 18 318,98 7,20 18
2 653,29 11,50 2 19 311,78 8,56 19
3 641,78 12,90 3 20 303,22 13,57 20
4 628,88 13,79 4 21 289,65 61,53 21
5 615,09 16,89 5 22 228,12 27,54 22
6 598,20 7,20 6 23 200,58 19,35 23
7 591,00 22,76 7 24 181,23 21,86 24
8 568,24 7,60 8 25 159,37 22,41 25
9 560,64 26,01 9 26 136,96 8,60 26
10 534,64 25,52 10 27 128,37 34,81 27
11 509,12 18,28 11 28 93,55 18,87 28
12 490,85 29,95 12 29 74,68 11,87 29
13 460,89 62,35 13 30 62,81 14,49 30
14 398,54 22,25 14 31 48,33 16,27 31
15 376,29 22,25 15 32 32,06 7,16 32
16 354,05 27,67 16 33 24,90 17,01 33
17 326,38 7,40 17 34 7,89 7,89 34
Table 4. Merging elements of the job by RPW
WS elements Work Rational Min Σ k Total Time WS WS elements Work Rational Min Σ k Total Time WS
I 1-2 18,77 30,27 XV 20 13,57 13,57
11,50 XVI 21 61,53 61,53
II 3 12,90 12,90 XVII 22 27,54 27,54
III 4-5 13,79 30,68 XVIII 23 19,35 19,35
16,89 XIX 24 21,86 21,86
IV 6 7,20 7,20 XX 25-26 22,41 31,01
V 7-8 22,76 7,60 30,36 XXI 27 34,81 8,60 34,81
VI 9 26,01 26,01 XXII 28-29 18,87 30,74
VII 10 25,52 25,52 11,87
VIII 11 18,28 18,28 XXIII 30-31 14,49 30,76
IX 12 29,95 29,95 16,27
X 13 62,35 62,35 XXIV 32-33 7,16 24,17
XI 14 22,25 22,25 17,01
XII 15 22,25 22,25 XXV 34 7,89 7,89
XIII 16 27,67 27,67
XIV 17-19
7,40
23,16 7,20
8,56
Table 4 shows the incorporation of elements of the work done at the work station 1-2, 4-5, 7-8, 17-19, 25 -26, 28-29, 30 -31 and 32-33. Merging done since time work station does
not exceed the cycle time is 31.30 sec / pair. Prior to the merger, work station consists of 34 work station after incorporation into 25 work station.
I
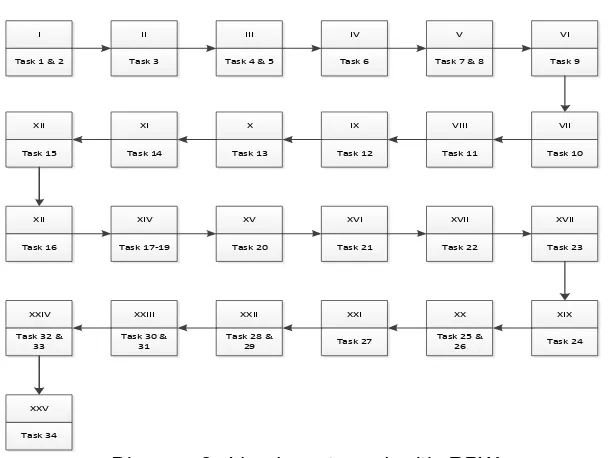
Diagram 2. Line layout graph with RPW
Diagram. 2 shows the incorporation of elements of work with Line graph layout.
Line efficiency
Obtained difference between of time the station cycle time, or can be referred to as idle time by 14.12%. This means that the production trajectory occurs when empty (spare) for 0.141 of the total time in the production line.
Efficiency Work station
5. CONCLUSIONS & RECOMMENDATION
Conclusions
Based on the observations that have been made , at the production plant in Nitro soccer shoes , it can be concluded as follows :
1. At the production plant consists of several processes , namely the process of cutting , preparation , sewing and assembling . In this study, researchers evaluated the balance only on the assembling line.
2. On the production floor , especially in the work of assembling there are 34 elements . After calculation offsetting trajectory using Rangked Positional Weight method there are 8 elements can work together on work station 1-2 , 4-5 , 7-8 , 17-19 , 25 -26 , 28-29 , 30 -31 and 32 - 33 . Merging done since time work station does not exceed the cycle time is 31.30 sec / pair
3. There are three work station operators who do not use it because of the use of the work station conveyor / automatic machine that is at work station 4 , 15 and 18 .
4. Operator after merging line balancing with work station , 23 people from 32 previously .
Recommendations
Based on the observations that have been made in the production plant, the suggestions can be given as follows:
1. By combining elements of work that meets the criteria, it will reduce the idle
time of the line. So it can improve employee productivity and minimize the number of work stations and operators. 2. The existence of a standard working time
for work station and a working element of indicators in measuring performance, so that the increase in employment kualiats resources can continue to be improved and ultimately increase company productivity.
3. Merging multiple work station to reduce costs so that the company's profit is expected to increase.
6. REFERENCES
[a] Bedworth, David D., Elsayed. (1997).Integrated Production and Planning Control. John Wiley and Sons Inc, New York.
[b] Elyased, A. ( 1994 ). Analysis and Control of Production System. 2nd Edition, Prentice Hall, New Jersey. [c] Jack B. Revelle, (2001). Manufacturing
Hand book of Best Practices : An Innovation Productivity and Quality Focus. CRC Press, USA.
[d] Edward Scott Kickel, Lawrence Mark Marran. (2010), A dynamic Assembly Line Balancing Method., Kickel Marran 1978, Cornell University.
[e] Baverly Townsend. (2012), The Basics of Line Balancing and JIT Kitting, CRC Press, 20 April 2012.