LOWER SOCIO ECONOMIC STATUS IN INDONESIA?
Dwi Susilowati1
ABSTRACT
Background: A good understanding of the association between under nutrition and socioeconomic status (SES) has many important public health and policies implications for the prevention and management of underweight. Objective: To examine the relation of SES, education level, working status, urban-rural and age on the Body mass index (BMI). Methods: The data were part of Basic Health Research in Indonesia, 2010. It was a cross sectional study that covered the whole households’ members that were chosen through a multistage random sampling. Data was gathered using structured questionnaire. Frequency distributions and logistic regression were used for assessment of statistical association between variables. Results: It covered 20,819 boys, their mean age: 14.1+2.9 years, the prevalence of underweight and normal weight was 51.3% and 39.9%. The prevalence of underweight at 10 years and 19 years were 73.6% and 21.5%; the prevalence of normal weight at 10 years and 19 years were 18.3% and 63.7%. The adjusted odds ratios for the association with underweight for aged 13–15 years were: 0.53(95% CI:0.48–0.57); for aged 16–19 years 0.23(0.21–0.26); for status of not working 0.89(0.82–0.95); for status of working 0.59(0.54–0.66); for fi nished elementary school 1.29(1.14–1.48); for no schooling/did not fi nished elementary school 1.73(1.50–2.00); for medium socio-economic status 1.16(1.05–1.29); for low socio-economic status 1.23(1.11–1.37). Conclusions: Younger adolescents, lack of schooling and those with lower socioeconomic were more likely to be underweight. This study will help the government for developing programs to assist underweight adolescents.
Key words: Adolescents, boys, underweight, education, socio-economic status
ABSTRAK
Pemahaman yang benar mengenai adanya hubungan antara gizi kurang dan status sosial ekonomi (Sosek) mempunyai implikasi besar terhadap kesehatan masyarakat dan kebijakan pencegahan dan penanganan gizi kurang. Mengukur hubungan Sosek, tingkat pendidikan, status bekerja, kota-desa dan umur terhadap Indeks Masa Tubuh (IMT). Metode: data merupakan bagian dari Riset Kesehatan Dasar 2010, yang merupakan studi potong lintang, meliputi semua anggota rumah tangga terpilih melalui sampling acak bertingkat. Data diperoleh dengan menggunakan kuesioner terstruktur. Distribusi frekuensi dan regresi logistik digunakan untuk mengukur hubungan statistik antara variabel. Hasil: prevalensi gizi kurang dan gizi normal 20.816 remaja laki-laki dengan umur rata-rata: 14,1+2,9 tahun, sebesar 51.3% dan 39,9%. pada usia 10 tahun dan 19 tahun prevalensi gizi kurang adalah 73.6% dan 21,5%, sedangkan prevalensi gizi normal adalah18,3% dan 63,7%. Adjusted odds rasio untuk hubungan dengan gizi kurang untuk usia 13–15 tahun adalah: 0.53(95% CI:0.48–0.57); untuk usia 16–19 tahun 0,23 (0,21–0,26); untuk status tidak bekerja 0,89 (0,82-0,95); untuk status bekerja 0.59 (0,54–0,66); untuk tamat Sekolah Dasar (SD) 1,29(1.14–1.48); untuk tidak sekolah/ tidak tamat SD 1,73 (1,50–2,00); untuk status Sosek menengah 1.16 (1,05–1,29); untuk status Sosek rendah 1.23(1,11–1,37). Kesimpulan,remaja yang yang lebih muda, kurang berpendidikan dan mereka dengan sosek rendah lebih mungkin untuk mengalami gizi kurang. Studi ini dapat membantu pemerintah untuk membuat program-program untuk membantu remaja dengan gizi kurang.
Kata kunci: Remaja, laki-laki, gizi kurang, pendidikan, status sosio ekonomi
Naskah Masuk: 15 Juni 2011, Review 1: 20 Juni 2011, Review 2: 20 Juni 2011, Naskah layak terbit: 30 Juni 2011
1 Researcher at Centre of Research of Humaniora, Health Policy and Community Empowerment, National Institute of Health Research
INTRODUCTION
Adolescents consisted of about 20% to 25% of the world population (WHO, 2000). In many developing countries nutrition initiatives for adolecenst were neglected (Roldan AT 1994; Martorell RJ, 1994; Chaturvedi S, 1996; Kurz KM, 1994), while under nutrition among adolescents’ boys is of public health importance in developing countries. Adolescence is characterized by rapid physical growth and sexual development, which is an important period of human life (Kurz KM, 1994 ;Martorell RJ, 1994 and Roldan AT,1994 ).
Previous studies from developing countries showed that younger adolescents are at greater risk of being undernourished than their counterparts, with the risk increasing in adolescents in rural than in urban areas (Martorell RJ, 1994; Roldan AT, 1994; Chaturvedi S, 1996 and Shang L, 2007).
There has been a strong interest in studying the relation between SES and underweight and previous studies have shown that the association between SES and underweight may vary by population, sex, age and urban-rural areas. The adolescents growth is associated with socio economic situation (Kurz KM, 1994; Martorell RJ, 1994; and Roldan AT, 1994). In developed countries, under nutrition is mostly found among people living in rural areas, although poor nutrition, such as micronutrient deficiencies, are often associated with low income and poor access to nutritious foods, factors common in poor, urban areas (Shetty P, 2009 and Black RE, 2008). In general, the literature suggests that, in developing countries, low-SES groups are more likely to be underweight as compared to their high-SES counterparts. It is widely accepted that low-SES groups in Asian countries are at greater risk than their higher –SES counterpart. But, India, a country that has an important increase of economic status, they still faced a high prevalence of under nutrition. In these past decades there was an emergence of over nutrition in the same regions where under nutrition has been a dominant problem (Gutierrez-Delgado C, 2009 and Delisle HF, 2008).
There is limited information on the relative importance of socio-economic factors in determining the adolescent anthropometric measurements in Indonesia. A good understanding of the relation between SES and underweight among the adolescents
will provide many important public health and policy implications. The findings can be used to improve existing policies and programs targeting adolescents’ nutrition, particularly for the prevention and management of underweight in this country.
METHODS
Data were part of the Indonesian Basic Health Research (RISKESDAS) 2010 (Riskesnas, 2011), a cross sectional study. The survey instruments were structured questionnaires. Households’ samples were chosen based on multistage random sampling. The study covered the whole selected households’ members. But for this purpose, some variables of adolescents’ boys aged 10–19 years only, i.e.: height, weight, household’s income, their education level, urban – rural area and their working status were analyzed.
The study protocol was approved by the institutional ethical committee.
Defi nition of underweight
Body mass index (BMI) = weight (kg)/height2 (m) was calculated for each individual on the basis of measured weight and height. In the present study, the adolescents body weight status was classifi ed on the basis of BMI cut off point for Asia Pacifi c region, i.e.: underweight (BMI<18.5), normal weight (BMI 18.5–22.9), overweight (BMI 23.0–24.9) and obese (BMI ≥ 25.0). (WHO, 2004).
Socioeconomic status
In this present study income of the households that was divided it into quintiles (quintile-5 as the highest SES level and quintile-1 as the lowest SES level) was used as the indicator of adolescents SES.
Sociodemographic characteristics
Statistical analysis
The data were analyzed using SPSS version 16. Statistical calculation consisted of descriptive statistics, bivariate analysis for associations between different variables, odds ratio with 95% confi dence intervals for the degree of association between variables for identifying important determinants’ of adolescent’s BMI. Then a stepwise forward logistic regression analysis was applied to test further the observed signifi cant variables in bi-variate analysis while controlling for co-linearity. Statistical tests were conducted at the P = 0.05 signifi cance level.
RESULTS
A total of 20,819 adolescents’ boys were included in the present analysis. Figure 1 shows the total prevalence of underweight (51.3%) and normal weight (39.9%) are shown. Furthermore the fi gure shows that the prevalence of underweight were higher among the
younger age, while the prevalence of normal weight were higher among the older ones.
Table I presents the mean values (± SD) of age, weight, height and BMI of the studied population. It shows that mainly they were underweight but they were not too short.
Table 1. Distribution of age, weight, height and Body Mass Index of adolescents boys (N = 20,819)
Mean + Std. Deviation Percentiles 5 Percentiles 95
Age (years) 14.1 + 2.9 10.0 - 19.0
Weight (kg) 40.7 + 11.3 23.0 - 58.1
Height (cm) 149.0 + 15.3 122.5 - 170.0
Body Mass Index 17.9 + 2.5 13.9 - 21.9
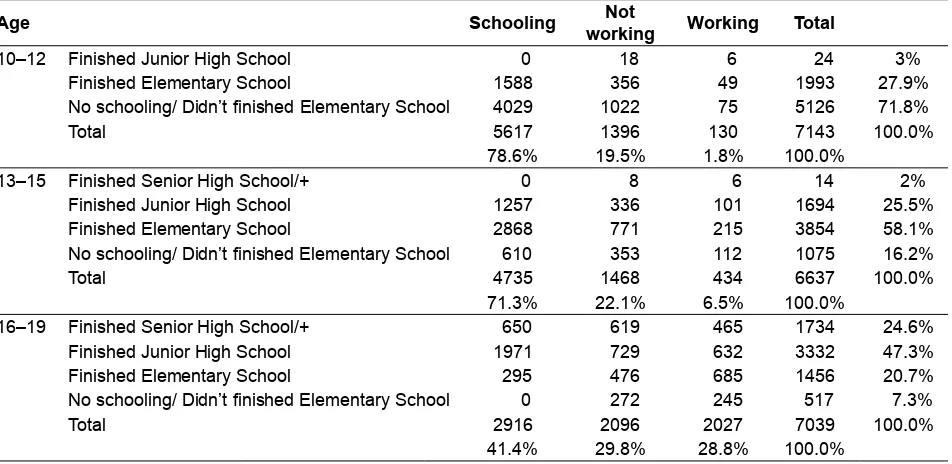
Table 2. Distribution of age groups, working status, education and nutritional status
Age Schooling Not
working Working Total
10–12 Finished Junior High School 0 18 6 24 3%
Finished Elementary School 1588 356 49 1993 27.9%
No schooling/ Didn’t fi nished Elementary School 4029 1022 75 5126 71.8%
Total 5617 1396 130 7143 100.0%
78.6% 19.5% 1.8% 100.0%
13–15 Finished Senior High School/+ 0 8 6 14 2%
Finished Junior High School 1257 336 101 1694 25.5%
Finished Elementary School 2868 771 215 3854 58.1%
No schooling/ Didn’t fi nished Elementary School 610 353 112 1075 16.2%
Total 4735 1468 434 6637 100.0%
71.3% 22.1% 6.5% 100.0%
16–19 Finished Senior High School/+ 650 619 465 1734 24.6%
Finished Junior High School 1971 729 632 3332 47.3%
Finished Elementary School 295 476 685 1456 20.7%
No schooling/ Didn’t fi nished Elementary School 0 272 245 517 7.3%
Total 2916 2096 2027 7039 100.0%
41.4% 29.8% 28.8% 100.0%
Age Schooling Not
working Working Total
10–12 Under weight 4386 1087 89 5562 77.9%
Normal weight 1231 309 41 1581 22.1%
Total 5617 1396 130 7143 100.0%
78.6% 19.5% 1.8% 100.0%
13–15 Under weight 2861 863 207 3931 59.2%
Normal weight 1874 605 227 2706 40.8%
Total 4735 1468 434 6637 100.0%
71.3% 22.1% 6.5% 100.0%
16–19 Under weight 1043 715 558 2316 32.9%
Normal weight 1873 1381 1469 4723 67.1%
Total 2916 2096 2027 7039 100.0%
41.4% 29.8% 28.8% 100.0%
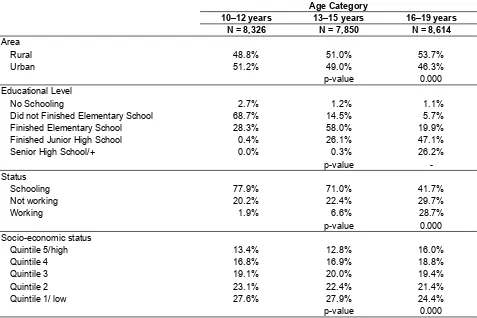
Table 3. Socio-demographic conditions of boys related to their age categories
Age Category
10–12 years 13–15 years 16–19 years
N = 8,326 N = 7,850 N = 8,614
Area
Rural 48.8% 51.0% 53.7%
Urban 51.2% 49.0% 46.3%
p-value 0.000
Educational Level
No Schooling 2.7% 1.2% 1.1%
Did not Finished Elementary School 68.7% 14.5% 5.7%
Finished Elementary School 28.3% 58.0% 19.9%
Finished Junior High School 0.4% 26.1% 47.1%
Senior High School/+ 0.0% 0.3% 26.2%
p-value
-Status
Schooling 77.9% 71.0% 41.7%
Not working 20.2% 22.4% 29.7%
Working 1.9% 6.6% 28.7%
p-value 0.000
Socio-economic status
Quintile 5/high 13.4% 12.8% 16.0%
Quintile 4 16.8% 16.9% 18.8%
Quintile 3 19.1% 20.0% 19.4%
Quintile 2 23.1% 22.4% 21.4%
Quintile 1/ low 27.6% 27.9% 24.4%
p-value 0.000
Table 2 shows that 78.6% of those aged 10–12 years who had not fi nished elementary school, were still studying. The prevalence of adolescents that went to school was lower at older adolescents; the prevalence of older adolescents who were working was higher.
The prevalence of underweight adolescents that had to worked were 68.5% among those aged 10–12 years, 47.7% among those aged 13–15 years and 27.5% among those aged 16–19 years.
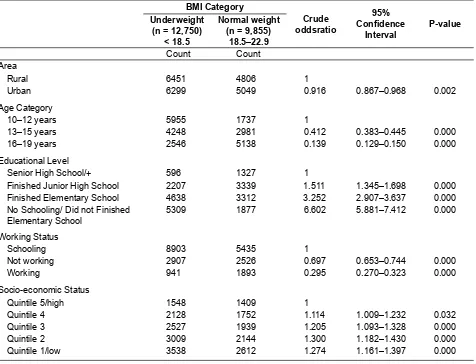
Table 4. Crude Odds ratios and 95% confi dence intervals for the signifi cant predictors of adolescents boys being underweight versus normal weight
BMI Category
Crude oddsratio
95% Confi dence
Interval
P-value Underweight
(n = 12,750) < 18.5
Normal weight (n = 9,855)
18.5–22.9
Count Count
Area
Rural 6451 4806 1
Urban 6299 5049 0.916 0.867–0.968 0.002
Age Category
10–12 years 5955 1737 1
13–15 years 4248 2981 0.412 0.383–0.445 0.000
16–19 years 2546 5138 0.139 0.129–0.150 0.000
Educational Level
Senior High School/+ 596 1327 1
Finished Junior High School 2207 3339 1.511 1.345–1.698 0.000
Finished Elementary School 4638 3312 3.252 2.907–3.637 0.000
No Schooling/ Did not Finished Elementary School
5309 1877 6.602 5.881–7.412 0.000
Working Status
Schooling 8903 5435 1
Not working 2907 2526 0.697 0.653–0.744 0.000
Working 941 1893 0.295 0.270–0.323 0.000
Socio-economic Status
Quintile 5/high 1548 1409 1
Quintile 4 2128 1752 1.114 1.009–1.232 0.032
Quintile 3 2527 1939 1.205 1.093–1.328 0.000
Quintile 2 3009 2144 1.300 1.182–1.430 0.000
Quintile 1/low 3538 2612 1.274 1.161–1.397 0.000
The percentage of boys with no schooling at all were higher among the younger ones despite that schooling is obliged to school age children and they could get the schooling for free at elementary schools. There were 2.7% boys aged 10–12 years who did not go to school, which could be considered as a lost of opportunity. More than a half of the boys lived in low socioeconomic status (Quintile 1 and 2).
Table 4 shows that boys who lived in urban areas were less likely to be underweight as compared to those who lived in rural areas. Those who were older were less likely to be underweight. Those with no schooling or did not pass elementary school were 6.6 times more likely to be underweight, while those who fi nished elementary school were 3.2 times more likely to be underweight as compared to those who fi nished senior high school. Adolescents’ boys residing
in the lowest socioeconomic quintile had signifi cantly increased probabilities of being underweight.
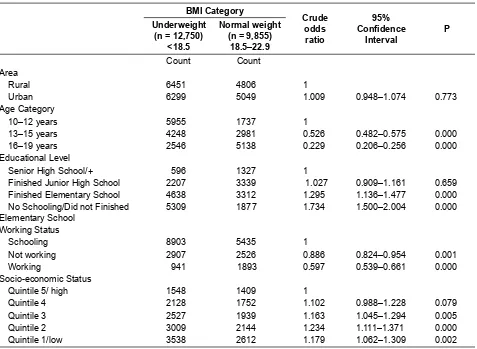
Table 5 shows that the Adjusted Odds ratios between underweight and normal weight and its predictors shows that it was not infl uence by rural-urban area, while the older they were the less likely they became underweight, the less educated they were the more likely they became underweight, those who were still studying were more likely to be underweight, the lower their socio-economic status the more likely they became underweight.
DISCUSSION
developing countries is beginning to receive attention. It was reported that there were generally higher prevalence of adolescents under nutrition in South Asia than in South-East Asia or sub Saharan Africa and a higher prevalence in rural than in urban areas (Cordeiro et al., 2006; Funke OM, 2008) while this study shows no difference of underweight prevalence between rural and urban areas (Table 5).
It is diffi cult to measure nutritional status among adolescents due to differences in their growth patterns and wide range of variations in the onset of puberty among different populations that shows on their growth spurt (Cordeiro et al., 2006). WHO (Butte N, 2007) suggested including multiethnic to capture the variation in human growth patterns to reflect differences in genetic potential which was done within this study.
Similar to other studies (Cordeiro et al., 2006; Shang et al., 2007; Kelishadi R et al., 2008; Shahbuddin
AK et al., 2000; Deshmukh PR et al., 2006; Das BK et al., 2002), it shows that the percentage of undernourished adolescents is signifi cantly less in late adolescence than early adolescence.
Adolescence has been defined by the World Health Organization as the period between 10 and 19 years (WHO, 1999) which was adopted for this study analysis. Age, in particular being younger, emerged as a risk factor for being underweight, because older siblings are better able to compete for relatively scarce food, younger children may receive inadequate nutrition (Yetubie M, 2010). Other reports show different result, i.e.: there were a higher prevalence of underweight among mid adolescents (Funke OM, 2008) and older adolescents (Bisai, 2010). There was a higher prevalence of normal weight among older adolescents, which was similar to other fi nding (Lazzeri G, 2008).
Table 5. Adjusted Odds ratios and 95% confi dence intervals for the signifi cant predictors of adolescents boys being underweight versus normal weight
BMI Category
Crude odds ratio
95% Confi dence
Interval
P Underweight
(n = 12,750) <18.5
Normal weight (n = 9,855)
18.5–22.9
Count Count
Area
Rural 6451 4806 1
Urban 6299 5049 1.009 0.948–1.074 0.773
Age Category
10–12 years 5955 1737 1
13–15 years 4248 2981 0.526 0.482–0.575 0.000
16–19 years 2546 5138 0.229 0.206–0.256 0.000
Educational Level
Senior High School/+ 596 1327 1
Finished Junior High School 2207 3339 1.027 0.909–1.161 0.659
Finished Elementary School 4638 3312 1.295 1.136–1.477 0.000
No Schooling/Did not Finished Elementary School
5309 1877 1.734 1.500–2.004 0.000
Working Status
Schooling 8903 5435 1
Not working 2907 2526 0.886 0.824–0.954 0.001
Working 941 1893 0.597 0.539–0.661 0.000
Socio-economic Status
Quintile 5/ high 1548 1409 1
Quintile 4 2128 1752 1.102 0.988–1.228 0.079
Quintile 3 2527 1939 1.163 1.045–1.294 0.005
Quintile 2 3009 2144 1.234 1.111–1.371 0.000
It was found that the less educated they were the more likely they became underweight, while the less educated were mostly the younger ones. The author was not able to identify similar studies that relate the educational level of the adolescents with their nutritional status, although there were a lot of studies that relate the mothers’ education to their children nutritional status. Possibly underweight in this study is more likely related to a younger age (Figure 1) instead of to educational level.
Those who were working were signifi cantly less likely for being underweight; on the contrary a study at Nigeria shows that boys who were involved in jobs after school hours the prevalence of underweight was signifi cantly higher (Funke OM, 2008). Possibly the reason for a lower prevalence of underweight among working Indonesian boys because they were older; thus, they were able to manage their income for their own need.
The lower their socio-economic status the more likely they became underweight, which was supported by other study that stated that children with multiple anthropometric failures are at a greater risk of morbidity and are more likely to come from poorer households (Nandy S, 2005). Although it was shown that socio-economic status show signifi cant differences to under nutrition prevalence, but the odds were less than 1.3 times; possibly because the respondents lived in rather homogenous socioeconomic conditions.
CONCLUSIONS
In conclusion, this present study provided evidence that the nutritional status of these adolescents’ boys were not satisfactory especially among the younger ones. Furthermore lack of schooling and those with lower socioeconomic were likely to be underweight. This study will help the government for developing programs to assist underweight adolescents Confl ict of Interest the author confi rms that there are no any relevant associations that might pose a confl ict of interest.
ACKNOWLEDGEMENTS
The author is grateful to be able to participate in the study preparation, data collecting and she might use part of the data for this analysis.
REFERENCES
Bisai S, Bose K, Ghosh D, De K, Growth Pattern and Prevalence of Underweight and Stunting Among Rural Adolescents, J Nep Paedtr Soc 2010; 31(1): 17–24. Black RE, Allen LH, Bhutta ZA, Caulfi eld LE, de Onis M,
Ezzati M, Mathers C, Rivera J. Maternal and child undernutrition: global and regional exposures and health consequences. Lancet. 2008; 371: 243–260. [PubMed]
Butte N, Garza C, de Onis M, Evaluation of the feasibility of international growth standards for school-aged children and adolescents. Journal of Nutrition 2007; 137: 153–7.
Chaturvedi S, Kapil U, Gnanasekaran N. Nutrient intake amongst adolescent girls belonging to poor socioeconomic group of rural area of Rajasthan. Indian Pediatric. 1996; 33: 197–201.
Cordeiro LS, Lamstein S, Mahmud Z, Levinson FJ. SCN News - Developments in International Nutrition. “Adolescent Malnutrition in developing countries: A close look at the problem and at two national experiences.” Late 2005-Early 2006; 31: 6–13. Das BK & Bisai S: Prevalence of undernutrition among
Telaga adolescents: An endogamous population of India. The Internet Journal of Biological Anthropology. 2009 Volume 2 Number 2.
Delisle HF. Poverty: the double burden of malnutrition in mothers and the intergenerational impact. Ann N Y Acad Sci. 2008;1136: 172–184. [PubMed]
Deshmukh PR, Gupta SS, Bharambe MS, et al. Nutritional status of adolescents in rural Wardha. Indian J Pediatr 2006; 73: 139–141.
Funke OM. Prevalence of Underweight: A Matter of Concern among Adolescents in Osun State, Nigeria. Pakistan Journal of Nutrition 2008; 7(3): 503–508.
Gutierrez-Delgado C, Guajardo-Barron V. The double burden of disease in developing countries: the Mexican experience. Adv Health Econ Health Serv Res. 2009; 21: 3–22. [PubMed]
Kelishadi R, Ardalan G, Gheiratmand R, Majdzadeh R, Hosseini M, Gouya MM, Razaghi EM, Delavari A, Motaghian M, Barekati H, Mahmoud-Arabi MS, Lock K; Caspian Study Group. Thinness, overweight and obesity in a national sample of Iranian children and adolescents: CASPIAN Study. Child Care Health Dev. 2008 Jan; 34(1): 44–54.
Kurz KM, Welch CJ. The nutrition and lives of adolescent in developing countries: Findings from the nutrition of adolescent girls research program. Washington DC: International Center for Research on Women. 1994; 33.
Lazzeri G, Rossi S, Pammolli A, Pilato V, Pozzi T, Giacchi MV. Underweight and overweight among children and adolescents in Tuscany (Italy). Prevalence and short-term trends. J Prev Med Hyg. 2008 Mar; 49(1): 13–21.
Martorell RJ, Merger P. Nutrition, health and growth in Guatemalan adolescents. Washington DC: International Center for Research on Women, nutrition of adolescent girls’ research program. 1994; 3: 34. Nandy S, Irving M, Gordon D, Subramanian SV, Smith
GD. Poverty, child under nutrition and morbidity: new evidence from India. Bull World Health Organ, 2005: 83(3): 210–6.
Riskesnas, 2011, Mekanisme permintaan data Riskesdas, available at: http://www.litbang.depkes.go.id/minta-data.htm, download at July 29, 2011.
Roldan AT, Bautista V, Manalo R.A multidimensional study of nutritional status of adolescent Filipinos. Washington DC: International Center for Research on Women, nutrition of adolescent girl’s research program. 1994; 5: 120.
Shahbuddin AK, Talukdar K, Talukdar MK, et al. Adolescent nutrition in rural community in Bangladesh. Indian J Pediatr 2000; 67(2): 93–98.
Shang L, Jiang X, Bao XH, Xue FB, Xu YY, Body mass index of male youths aged 18-20 years of the Han nationality living in different regions of China. J Health Popul Nutr. 2007 Dec; 25(4): 488–94.
Shetty P. Community-based approaches to address childhood undernutrition and obesity in developing countries. Nestle Nutr Workshop Ser Pediatr Program. 2009; 63: 227–254.
World Health Organization, Fourth Report. The World Nutrition Situation: Nutrition throughout the life cycle. Geneva Switzerland: United Nation Administration Committee on Coordination, Sub-Committee on Nutrition Geneva (ACC/SCN) in collaboration with International Food Policy Research Institute (IFPRI), World Health Organization. 2000; 136 p.
World Health Organization, Programming for adolecents health and development. Geneva, WHO, 1999. World Health Organization, WHO expert consultation.
Appropriate body-mass index for Asian populations and its implications for policy and intervention strategies. The Lancet, Vol. 363, January 10, 2004. Yetubie M, Haidar J, Kassa H, L. Fallon F. Socioeconomic