TRY OUT 30 Responden Variabel Kompetensi/ x1
Case Processing Summary
N %
Cases
Valid 30 100.0
Excludeda 0 .0
Total 30 100.0
a. Listwise deletion based on all variables in the
procedure.
Reliability Statistics
Cronbach's
Alpha
N of Items
.889 4
Item Statistics
Mean Std. Deviation N
x1_1 3.83 .874 30
x1_2 3.93 .785 30
x1_3 4.03 .890 30
x1_4 4.00 .983 30
Item-Total Statistics
Scale Mean if
Item Deleted
Scale Variance
if Item Deleted
Corrected
Item-Total
Correlation
Cronbach's
Alpha if Item
Deleted
x1_1 11.97 5.551 .751 .859
x1_2 11.87 5.913 .754 .860
x1_3 11.77 5.564 .727 .868
TRY OUT 30 Responden Variabel Budaya organisasi/ x2
Case Processing Summary
N %
Cases
Valid 30 100.0
Excludeda 0 .0
Total 30 100.0
a. Listwise deletion based on all variables in the
procedure.
Reliability Statistics
Cronbach's
Alpha
N of Items
.931 8
Item Statistics
Mean Std. Deviation N
x2_1 3.80 .664 30
x2_2 3.80 .805 30
x2_3 3.80 .664 30
x2_4 3.83 .699 30
x2_5 3.90 .759 30
x2_6 3.63 1.066 30
x2_7 3.73 .691 30
Item-Total Statistics
Scale Mean if
Item Deleted
Scale Variance
if Item Deleted
Corrected
Item-Total
Correlation
Cronbach's
Alpha if Item
Deleted
x2_1 26.37 22.447 .758 .923
x2_2 26.37 21.275 .773 .921
x2_3 26.37 22.723 .710 .926
x2_4 26.33 22.437 .715 .925
x2_5 26.27 21.099 .859 .915
x2_6 26.53 18.189 .917 .911
x2_7 26.43 21.702 .851 .917
TRY OUT 30 Responden Variabel Kinerja Karyawan/Y
Case Processing Summary
N %
Cases
Valid 30 100.0
Excludeda 0 .0
Total 30 100.0
a. Listwise deletion based on all variables in the
procedure.
Reliability Statistics
Cronbach's
Alpha
N of Items
.929 12
Item Statistics
Mean Std. Deviation N
Y_1 4.17 .747 30
Y_10 4.07 .785 30
Y_11 3.97 .765 30
Item-Total Statistics
Scale Mean if
Item Deleted
Scale Variance
if Item Deleted
Corrected
Item-Total
Correlation
Cronbach's
Alpha if Item
Deleted
Y_1 43.73 36.892 .717 .923
Y_2 44.17 39.523 .635 .926
Y_3 44.07 34.685 .873 .916
Y_4 43.70 36.010 .755 .921
Y_5 44.00 37.379 .567 .929
Y_6 43.83 40.075 .479 .931
Y_7 43.73 38.271 .657 .925
Y_8 44.00 37.172 .723 .922
Y_9 43.80 37.338 .702 .923
Y_10 43.83 36.144 .762 .921
Y_11 43.93 37.099 .673 .924
LAMPIRAN 4
DATA VARIABEL INPUT HASIL JAWABAN
LAMPIRAN 5
Descriptive Statistics
Mean Std. Deviation N
Kinerja Karyawan (Y) 46.10 7.472 159
Kompetensi (X1) 15.53 3.301 159
Budaya Organisasi (X2) 30.22 6.120 159
Variables Entered/Removeda
Model Variables Entered Variables
Removed
Method
1 Budaya Organisasi (X2),
Kompetensi (X1)b . Enter
a. Dependent Variable: Kinerja Karyawan (Y)
b. All requested variables entered.
Model Summary
Model R R Square Adjusted R
Square
Std. Error of the
Estimate
1 .873a .762 .759 3.667
a. Predictors: (Constant), Budaya Organisasi (X2), Kompetensi (X1)
ANOVAa
Model Sum of Squares df Mean Square F Sig.
1
Regression 6722.325 2 3361.162 249.917 .000b
Residual 2098.065 156 13.449
Total 8820.390 158
a. Dependent Variable: Kinerja Karyawan (Y)
Coefficientsa
Model Unstandardized
Coefficients
Standardized
Coefficients
t Sig.
B Std. Error Beta
1
(Constant) 11.912 1.578 7.549 .000
Kompetensi (X1) 1.351 .116 .597 11.624 .000
Budaya Organisasi (X2) .437 .063 .358 6.967 .000
LAMPIRAN 6
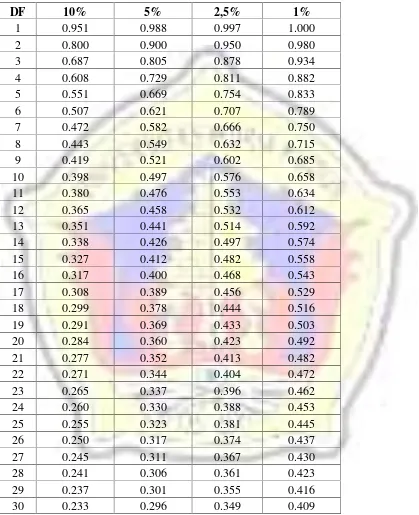
TABEL R
DF
10%
5%
2,5%
1%
1
0.951
0.988
0.997
1.000
2
0.800
0.900
0.950
0.980
3
0.687
0.805
0.878
0.934
4
0.608
0.729
0.811
0.882
5
0.551
0.669
0.754
0.833
6
0.507
0.621
0.707
0.789
7
0.472
0.582
0.666
0.750
8
0.443
0.549
0.632
0.715
9
0.419
0.521
0.602
0.685
10
0.398
0.497
0.576
0.658
11
0.380
0.476
0.553
0.634
12
0.365
0.458
0.532
0.612
13
0.351
0.441
0.514
0.592
14
0.338
0.426
0.497
0.574
15
0.327
0.412
0.482
0.558
16
0.317
0.400
0.468
0.543
17
0.308
0.389
0.456
0.529
18
0.299
0.378
0.444
0.516
19
0.291
0.369
0.433
0.503
20
0.284
0.360
0.423
0.492
21
0.277
0.352
0.413
0.482
22
0.271
0.344
0.404
0.472
23
0.265
0.337
0.396
0.462
24
0.260
0.330
0.388
0.453
25
0.255
0.323
0.381
0.445
26
0.250
0.317
0.374
0.437
27
0.245
0.311
0.367
0.430
28
0.241
0.306
0.361
0.423
29
0.237
0.301
0.355
0.416
Cuplikan Tabel Distribusi t
0
No
10%
5%
2,5%
130
1.288
1.657
1.978
131
1.288
1.657
1.978
132
1.288
1.656
1.978
133
1.288
1.656
1.978
134
1.288
1.656
1.978
135
1.288
1.656
1.978
136
1.288
1.656
1.978
137
1.288
1.656
1.977
138
1.288
1.656
1.977
139
1.288
1.656
1.977
140
1.288
1.656
1.977
141
1.288
1.656
1.977
142
1.288
1.656
1.977
143
1.287
1.656
1.977
144
1.287
1.656
1.977
145
1.287
1.655
1.976
146
1.287
1.655
1.976
147
1.287
1.655
1.976
148
1.287
1.655
1.976
149
1.287
1.655
1.976
150
1.287
1.655
1.976
151
1.286
1.654
1.975
152
1.286
1.654
1.975
153
1.286
1.654
1.975
154
1.286
1.654
1.975
155
1.286
1.654
1.975
156
1.286
1.654
1.975
157
1.286
1.654
1.975
158
1.286
1.654
1.975
159
1.285
1.653
1.974
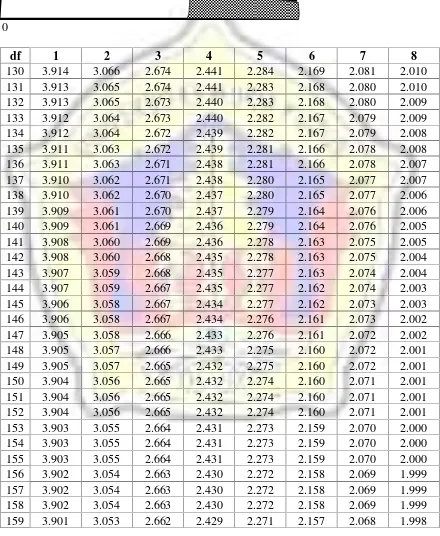
Tabel F untuk
= 0.05
0
df
1
2
3
4
5
6
7
8
130
3.914
3.066
2.674
2.441
2.284
2.169
2.081
2.010
131
3.913
3.065
2.674
2.441
2.283
2.168
2.080
2.010
132
3.913
3.065
2.673
2.440
2.283
2.168
2.080
2.009
133
3.912
3.064
2.673
2.440
2.282
2.167
2.079
2.009
134
3.912
3.064
2.672
2.439
2.282
2.167
2.079
2.008
135
3.911
3.063
2.672
2.439
2.281
2.166
2.078
2.008
136
3.911
3.063
2.671
2.438
2.281
2.166
2.078
2.007
137
3.910
3.062
2.671
2.438
2.280
2.165
2.077
2.007
138
3.910
3.062
2.670
2.437
2.280
2.165
2.077
2.006
139
3.909
3.061
2.670
2.437
2.279
2.164
2.076
2.006
140
3.909
3.061
2.669
2.436
2.279
2.164
2.076
2.005
141
3.908
3.060
2.669
2.436
2.278
2.163
2.075
2.005
142
3.908
3.060
2.668
2.435
2.278
2.163
2.075
2.004
143
3.907
3.059
2.668
2.435
2.277
2.163
2.074
2.004
144
3.907
3.059
2.667
2.435
2.277
2.162
2.074
2.003
145
3.906
3.058
2.667
2.434
2.277
2.162
2.073
2.003
146
3.906
3.058
2.667
2.434
2.276
2.161
2.073
2.002
147
3.905
3.058
2.666
2.433
2.276
2.161
2.072
2.002
148
3.905
3.057
2.666
2.433
2.275
2.160
2.072
2.001
149
3.905
3.057
2.665
2.432
2.275
2.160
2.072
2.001
150
3.904
3.056
2.665
2.432
2.274
2.160
2.071
2.001
151
3.904
3.056
2.665
2.432
2.274
2.160
2.071
2.001
152
3.904
3.056
2.665
2.432
2.274
2.160
2.071
2.001
153
3.903
3.055
2.664
2.431
2.273
2.159
2.070
2.000
154
3.903
3.055
2.664
2.431
2.273
2.159
2.070
2.000
155
3.903
3.055
2.664
2.431
2.273
2.159
2.070
2.000
156
3.902
3.054
2.663
2.430
2.272
2.158
2.069
1.999
157
3.902
3.054
2.663
2.430
2.272
2.158
2.069
1.999
158
3.902
3.054
2.663
2.430
2.272
2.158
2.069
1.999
LAMPIRAN 7
FREKUENSI IDENTITAS RESPONDEN
Statistics
Jenis Kelamin Usia Pendidikan_Tera
khir
Masa Kerja
N
Valid 159 159 159 159
Missing 0 0 0 0
Frequency Table
Jenis Kelamin
Frequency Percent Valid Percent Cumulative
Percent
Valid
Pria 103 64.8 64.8 64.8
Wanita 56 35.2 35.2 100.0
Total 159 100.0 100.0
Usia
Frequency Percent Valid Percent Cumulative
Percent
Pendidikan_Terakhir
Frequency Percent Valid Percent Cumulative
Percent
Valid
SLTA 123 77.4 77.4 77.4
D3 36 22.6 22.6 100.0
Total 159 100.0 100.0
Masa Kerja
Frequency Percent Valid Percent Cumulative
Percent
FREKUENSI VARIABEL KOMPETENSI
Statistics
x1_1 x1_2 x1_3 x1_4 Kompetensi
(X1)
N
Valid 159 159 159 159 159
Missing 0 0 0 0 0
Mean 3.76 3.87 3.97 3.93 15.53
Median 4.00 4.00 4.00 4.00 16.00
Mode 4 4 4 4 16
Sum 598 615 631 625 2469
Frequency Table
x1_1
Frequency Percent Valid Percent Cumulative
Percent
Total 159 100.0 100.0
x1_2
Frequency Percent Valid Percent Cumulative
Percent
x1_3
Frequency Percent Valid Percent Cumulative
Percent
Total 159 100.0 100.0
x1_4
Frequency Percent Valid Percent Cumulative
Percent
Kompetensi (X1)
Frequency Percent Valid Percent Cumulative
Percent
FREKUENSI VARIABEL BUDAYA ORGANISASI
Statistics
N Mean Median Mode Sum
Valid Missing
x2_1 159 0 3.86 4.00 4 613
Budaya Organisasi (X2) 159 0 30.22 31.00 31a 4805
a. Multiple modes exist. The smallest value is shown
Frequency Table
x2_1
Frequency Percent Valid Percent Cumulative
Percent
Total 159 100.0 100.0
x2_2
Frequency Percent Valid Percent Cumulative
Percent
x2_3
Frequency Percent Valid Percent Cumulative
Percent
Total 159 100.0 100.0
x2_4
Frequency Percent Valid Percent Cumulative
Percent
Total 159 100.0 100.0
x2_5
Frequency Percent Valid Percent Cumulative
Percent
x2_6
Frequency Percent Valid Percent Cumulative
Percent
Total 159 100.0 100.0
x2_7
Frequency Percent Valid Percent Cumulative
Percent
Total 159 100.0 100.0
x2_8
Frequency Percent Valid Percent Cumulative
Percent
Budaya Organisasi (X2)
Frequency Percent Valid Percent Cumulative
Percent
FREKUENSI VARIABEL KINERJA KARYAWAN
Statistics
N Mean Median Mode Sum
Valid Missing
Y_1 159 0 3.73 4.00 4 593
Kinerja Karyawan (Y) 159 0 46.10 48.00 51 7330
Frequency Table
Y_1
Frequency Percent Valid Percent Cumulative
Percent
Y_2
Frequency Percent Valid Percent Cumulative
Percent
Total 159 100.0 100.0
Y_3
Frequency Percent Valid Percent Cumulative
Percent
Total 159 100.0 100.0
Y_4
Frequency Percent Valid Percent Cumulative
Percent
Y_5
Frequency Percent Valid Percent Cumulative
Percent
Total 159 100.0 100.0
Y_6
Frequency Percent Valid Percent Cumulative
Percent
Total 159 100.0 100.0
Y_7
Frequency Percent Valid Percent Cumulative
Percent
Y_8
Frequency Percent Valid Percent Cumulative
Percent
Total 159 100.0 100.0
Y_9
Frequency Percent Valid Percent Cumulative
Percent
Total 159 100.0 100.0
Y_10
Frequency Percent Valid Percent Cumulative
Percent
Y_11
Frequency Percent Valid Percent Cumulative
Percent
Total 159 100.0 100.0
Y_12
Frequency Percent Valid Percent Cumulative
Percent
Total 159 100.0 100.0
Kinerja Karyawan (Y)
Frequency Percent Valid Percent Cumulative
33 3 1.9 1.9 8.8