C7 - 1
Distribution and Characteristic of Landslides in Volcanic Mountains
of West Java, Indonesia
Ngadisih1,3* Ryuichi Yatabe2 Netra P. Bhandary2 and Ranjan K. Dahal4
1,2
Graduate School of Science and Engineering, Ehime University, Japan
3
Department of Agricultural Engineering, Faculty of Agricultural Technology, Universitas Gadjah Mada, Indonesia
4
Department of Geology, Trichandra Campus, Tribhuvan University, Nepal *E-mail of corresponding author: [email protected], +81(0)9094580259
Abstract
West Java is the most risky province to landslide events in Indonesia due to extreme geo-morphological condition, climatic condition and densely populated with immense development activities. This study aims to explore distribution and characteristic of landslide in West Java. Geomorphological and archive inventories were prepared for the selected study area. The geomorphological inventory contains information about landslides that occurred before 1994, whereas the archive inventory includes recent landslides (1994 to 2010). Frequency-size statistics has been used to explore characteristics of landslide maps and to understand evolution of landscape in the study area due to slope movement. This study reveals that prepared landslide map includes a substantial fraction of all landslides at all scales (small-medium-large). However, archive inventory was incomplete in size aspect due to the limitation of landslide mapping technique. Geomorphological inventory showed rollover whose position is same with available literature. The rollover was interpreted as self-organized criticality of the area and limitation of inventory techniques.
Keywords: distribution, characteristic, landslides, West Java
Introduction
C7 - 2 primarily triggered by heavy rains. Other possible the landslides are triggered by earthquake and anthropogenic activities such as deforestation, road cutting, and mining. Nowadays, more and more people are affected by landslide disaster in Indonesia because of high density of population and ill-planned development in the country (Marfai et al., 2008).
When landslides are talked of in Indonesia, volcanic mountains along the collision zone of tectonic plates are the most prone area to instability. Cepede et al. (2010) reported that main effect of landslides could be found in Java (52%), Sulawesi (24%) and Sumatera (18%). The landslide disaster loss in Java is usually high because of high frequency of events as well as high density population (Hadmoko et al., 2010). It has been reported that a thousand of landslide disasters occurred in Java during the period of 1990-2005, which killed more than 1,112 people and injured 395 people. As the nation`s economic and administrative region, Java, particularly West Java has become the most populous area while economically and marginalized communities are often forced to occupy landslide prone areas. In addition, extensive infrastructure development, such as construction of national highways, railways, and roads has taken place in West Java recently. All these activities give rise to new landslide hazardous areas leading to increased landslide occurrence in future. Therefore, this research is targeted to explore distribution and characteristic of landslides in West Java.
Study area
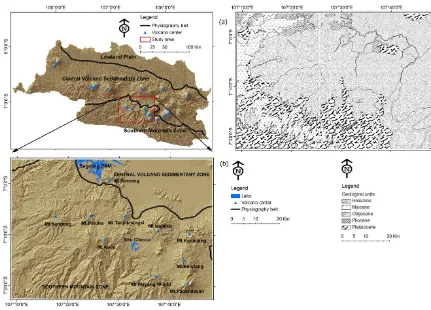
This study was carried out in southern part of West Java Province, which covers a total of 3,659 km2 between 7 00 S to 7200 S latitudes and 107100 E to 107500 E longitudes (Figure 1). It covers some parts of the Central Volcano Sedimentary Zone and the Southern Mountain Zone. The Central Volcano Sedimentary Zone is covered by products from Late Miocene to Pliocene magmatic arc, while Southern Mountain Zone is formed by subduction of the oceanic Indian plate beneath the continental Eurasian plate, and is characterized by earthquakes and active volcanoes. It consists of volcanic arc products interstratified with Late Eocene to Early Oligocene sedimentary formations.
Materials and method
C7 - 3 inventory map. Due to unavailability of recent aerial photos, however, landslides that occurred after 1994 were referred to from the landslide archives. The recent landslides do not leave any morphological signature on this topographic map. Therefore, we used Google Earth image to assist identification of landslide boundary and to minimize mapping error of landslide features on topographic maps. A field investigation was carried out in March 2012 in order to verify the landslide location and update the information. Here, geo-morphological inventory refers to the inventory that produced from aerial photos, while other ones is an archive inventory.
Figure 1: Three main physiography belt of West Java (modified after Van Bemmelen 1949), b) distribution of volcano (modified after Bronto 2008), and c) geological units in the study
area according time scale
C7 - 4 frequency-area distribution for landslides can be presented using both cumulative and non-cumulative distribution. The cumulative frequency-area distribution is expressed by Eq. (1), while non-cumulative is given by Eq. (2).
(1)
Where, NCL is the cumulative number of landslides with area greater than or equal to
the area AL. In a diagram with logarithmic axes, the Eq. (1) is represented by a straight line,
with α equal to the gradient of the interpolated straight line and C is equal to the intercept on the y axis.
(2)
Where β is the power-law, and C is a constant of non-cumulative distribution.
Many empirical observations have shown that landslides follow power-law frequency-size statistics. The term of power-law refers to mathematical relationship between two quantities such as number of landslide and its size, where the frequency of landslides increases rapidly to a maximum value and then decrease following a power-law. Several authors (e.g., Turcotte 2004; Rouai and Kharim 2005) argued that power-law behavior of landslide is a consequence of self-organized critical (SOC) behavior.
Because of SOC behavior, the non-cumulative frequency-area distribution usually satisfies the power-law behavior (Wu et al. 2011). The value of the power-law exponent is called the scaling exponent. This is generally related to triggering factors, geomorphologic characteristics, and landslide history, or indicates whether the slope movement is dominated by the many small slides, or the rarer large slides (Weissel et al. 2001). It was noticed by
Guzetti et al. (2002a) that range of value for the exponent is generally 2.0±0.5 km2 for various geographic locations, geologic settings and landslide triggering mechanisms. Indeed, the power-law () is obtained from frequency of landslides with medium to large areas, whereas the frequency of landslides with small areas shows the rollover effect.
Results and analysis
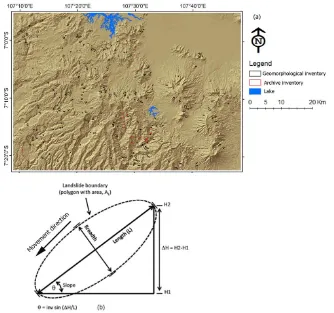
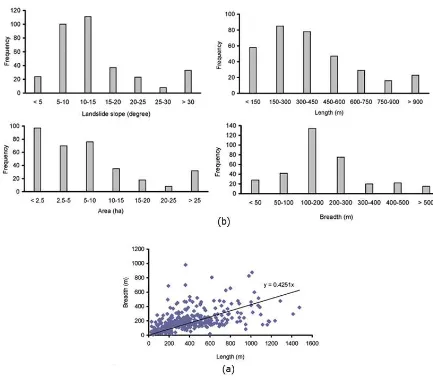
A total 336 landslides were identified and mapped in the study area (Figure 2a). The aerial photo interpretation recognized 266 landslides, while the remaining was identified from archives. The landslide sizes including projected area, length, breadth and slope as illustrated in Figure 2(b). General character of landslide in the study area can be recognized from histogram as seen in Figure 3.
C7 - 5 mostly clustered in 10 to 15 degrees. About 80% of landslides have size less than 2.5 ha. The length of landslide was concentrated at a range of 150 m to 300 m while the breadth at 100 m to 200 m. Landslide breadth was found to be half of the landslide length, and it shows a linearly increasing trend (Figure 3b). Similarly, frequency of landslide gradually decreases with the increase of dimension of landslide such as slope, area, length and breadth (Figure 3a).
Figure 2: a) Landslide maps in the study area consists of geomorphological and archive inventories, and b) illustration of landslide size was used in this study, i.e., area, length,
breadth or width, and slope of landslides
Table 1 shows that the geomorphological inventory is characterized by large size of landslide. For archive inventory, a few large landslides were reported in the study area. The landslide area ranges from 1.2410-4
to 1.11 km2, where landslides that occurred before 1994 range from 1.2410-4 to 8.8410-2
km2. Both inventories have similar range of slope, i.e., 5 to 50 degrees. In case of width of landslide, the geomorphological inventory informs that landslides range from 7.1410-5 to 1.6010-3
km, while the landslides that occurred from 1994 to 2012 was found to have range between 6.9210-6 to 2.8010-4
km. The length of landslide in the study area ranges from 2.0610-5 to 2.0210-3
C7 - 6 inventory shows that landslides range from 7.1410-5 to 2.0210-3
km, while the archive inventory indicates a smaller range of landslides (i.e., 2.0610-5 to 5.9910-4
km).
The cumulative frequency versus landslide area (AL) for three landslides inventories
are plotted in log-log graph (Figure 4a). The curve can be fitted by a power law function for landslide areas greater than 1.23 km2 for landslide inventory and map A, and 210-2 km2 for map B, respectively. The exponent, , of the power law function ranges between 0.998 and 1.870 where the coefficient, C, is six thousand times smaller for the curve fitting frequency-area on map B. This is caused by a greater relative number of large slope movements at map A.
Figure 3: Physical dimension of landslides: slope, length, breadth, and area
The cumulative frequency-size distribution could be restrictive and misleading (Pelletier et al., 1997), thus non-cumulative statistics has also been applied in this study. The derivative of the cumulative number (NCL) of landslides with area greater or equal to a
C7 - 7 rollover was observed at map A that shown by decreasing frequency density for small landslide areas (i.e., 210-2
km2). This was same with rollover position of historical inventory in central Italy analyzed by Guzetti et al. (2002b). The rollover may be found in all frequency curves, which is interpreted by some authors (e.g., Wu et al., 2011; Chen, 2012) due to SOC, while this was identified by others (e.g., Guzetti et al., 2002a; Van Den Eeckhaut et al., 2007) as the drawbacks of landslide mapping techniques.
Table 1 Summarize the main statistic-feature of landslide size
The presence of rollover at map A is probably indicates a transformation of triggering factors slope movements in the study area. In case of landslide, geological processes and triggering factors are internal pressure or constraints of system. The pressure builds the system until it exceeds threshold shown by rollover (Figure 4b). Here, mega-earthquake might be main triggering factor for landslides that occurred before 1994 which has led to huge slope movement. Later, the system has evolved into an organized form. Anthropogenic activities such as road constructions and plowing of farmlands are external constraints of system, which are disrupting the self-organized of natural system. This identified as major factor of causing recent landslides (map B) which is characterized by small sizes. This is real because previous section describes that study area immense with development activities.
N Range Minimum Maximum
Map B: Archive inve ntory (lands lide s that occurre d from 1994 to 2012)
Area (m2) 70 8.83E+04 1.24E+02 8.84E+04
Slope (degree) 70 45.00 5.00 50.00
Breadth (m) 70 272.87 6.92 279.79
Length (m) 70 578.51 20.59 599.11
C7 - 9 Figure 4: Frequency-area statistics of landslide using a) cumulative frequency distribution, and b) non-cumulative frequency distribution on a log-log scale. Red squares represent all landslide dataset, blue circles represent landslides that occurred before 1994 (Map A), and black triangles represent landslides that occurred after 1994 to 2012 (Map B).
Later, non-cumulative frequency distribution was fitted for areas greater than rollover for finding a power-law (). Despite map B and all landslide datasets do not show rollover in Figure 4b, the power-law () could be generated from the frequency of area greater than 610-4 km and 210-2
km for map B and all landslide data, respectively. They were considered as transition position between medium-large size and small size of landslides. The result revealed an exponent, , of 1.55 for map A, 0.43 for map B, and 1.60 for overall landslide datasets. The exponents map A and entire landslide data were found in range suggested by Guzetti et al. (2002a), but not for map B due to differences in the character of inventories. Comparing to other landslide maps, the archive inventory (map B) is more incomplete in terms of landslide size. This is in accordance to the statement Guzetti et al. (2005), that complete inventory is not applicable to historical or archive inventory. Because depicting boundaries between the failure areas (depletion, transport and deposition areas) and unaffected terrain in the field is not easy. Natural processes and the anthropogenic activities are considered as major issues in recognizing landslide features in the field.
Conclusions
The inventory map consists of a total of 366 landslides, of which 21% were obtained from the archive inventory. The landslide shaped sizes in terms of area, length, breadth, and slope were derived from the landslide inventories. Except for the slope, the landslides in geomorphological inventory are characterized by large sizes while they are small in the archive inventory. This was also evidenced by power-law and coefficient for both cumulative and non-cumulative distributions of landslide area. Rollover was exhibited in geomorphological inventory, and its position was similar to the historical inventory of landslides in central Italy. The rollover behavior of landslides indicates that evolution of landscape of the study area following SOC (self organized criticality) model and demerits of landslide mapping techniques.
References
1. Bronto, S. (2008). Tinjauan geologi gunung api Jawa Barat-Banten dan implikasinya. Geoplika 3(2): 047-061.
C7 - 10 3. Chen, C.-Y. (2012). Landslide and basin self-organized criticality in the Lushan hot
spring area. Journal of Mountain Science 9: 463–471.
4. Data dan Informasi Indonesia (DIBI), 2012. http://dibi.bnpb.go.id/
5. Guzzetti, F., Aleotti, P., Malamud, B.D. and Turcotte, D.L. (2002)a. Comparison of three landslide event inventories in Central Italy and Northern Italy. Proceedings of the 4th EGS Plinius Conference held at Mallorca, Spain.
6. Guzzetti, F., Malamud, B.D., Turcotte, D.L. and Reichenbach, P. (2002)b. Power-law correlations of landslide areas in central Italy. Earth and Planetary Science Letters 195: 169-183.
7. Guzzetti, F., Reichenbach, P., Cardinali, M., Galli, M., Ardozzone, F., 2005. Probabilistic landslide hazard assessment at the basin scale. Geomorphology 72: 272– 299.
8. Hadmoko, D.S., Lavigne, F., Sartohadi, J., Hadi, P., Winaryo. (2010). Landslide hazard and risk assessment and their application in risk management and landuse planning in eastern flank of Menoreh Mountains, Yogyakarta Province, Indonesia. Natural Hazards 54: 623-642.
9. Marfai, M.A., King, L., Singh, LP., Mardiatno, D., Sartohadi, J., Hadmoko, D.S. and Dewi, A. (2008). Natural hazards in Central Java Province, Indonesia: an overview. Environmental Geology 56: 335 – 351.
10.Pelletier, J.D., Malamud, B.D., Blodgett, T., Turcotte, D.L. (1997). Scale-invariance of soil moisture variability and its implications for the frequency-size distribution of landslides. Engineering Geology 48: 255-268
11.Rouai, M., Kharim, Y.E. (2005). Fractal statistics of landslides in the Rif belt (Morocco). Geophysical Research Abstracts 7: 01219.
12.Turcotte, D.L. (2004). The relationship of fractals in geophysics to ‘‘the new science’’. Chaos, Solitons and Fractals 19: 255-258.
13.Van Bemmelen, R.W. (1949). The geology of Indonesia. In: Carranza E.J.M., Wibowo, H., Barritt, S.D., Sumintadireja., P., 2008. Spatial data analysis and integration for regional-scale geothermal potential mapping, West Java, Indonesia. Geothermics 37: 267-299.
14.Van Den Eeckhaut, M., Poesen, J., Verstraeten, G., Vanacker, V., Nyssen, J., Moeyersons, J., van Beek, L.P.H. and Vandekerckhove, L. (2007). Use of LIDAR-derived images for mapping old landslides under forest. Earth Surf. Process. Landforms 32: 754–769
15.Weissel, J.K., Stark, C.P. and Hovius, N. (2001). Landslides triggered by the 1999 Mw7.6 Chichi earthquake in Taiwan and their relationship to topography. International Geoscience and Remote Sensing Symposium (IGARSS) 2: 759–761.