Gratis Konsultasi
Skripsi!!!
Jasa Olahdata :
SPSS, AMOS, LISREL, EVIEW, SMART PLS,
Garansi sampe LULUS
sidang!!!
Rahasia dijamin
BBM : 7ED67817
ACADEMIC PAPER
Factors affecting Mexican college
students’ purchase intention
toward a US apparel brand
Min-Young Lee
University of Kentucky, Lexington, Kentucky, USA
Youn-Kyung Kim
University of Tennessee, Knoxville, Tennessee, USA, and
Lou Pelton, Dee Knight and Judith Forney
University of North Texas, Denton, Texas, USA
Abstract
Purpose– This paper on Mexican college students aims to examine the effects of general consumer variables (i.e. normative interpersonal influence and brand consciousness) and brand-specific variables (i.e. perceived quality and emotional value) on purchase intention toward a US apparel brand.
Design/methodology/approach– The study is designed to determine the factors influencing Mexican college students’ purchase intention toward a US apparel brand. Purchase intention is explained with several variables: normative interpersonal influence, brand consciousness, perceived quality, and emotional value. A total of 256 college students in Mexico participated in the survey. Findings– Using structural equation modeling (SEM), the study finds that Mexican college students’ normative interpersonal influence positively affected brand consciousness. Brand consciousness is positively related to emotional value, but not to perceived quality of a US brand. Emotional value positively influences purchase intention toward a US brand, while perceived quality negatively influences purchase intention.
Practical implications– This study provides valuable strategic implications for US retailers who plan to enter the Mexican market. According to the findings of the study, US retailers could focus on the emotional aspects of US brands in order to appeal to Mexican college students, especially those who are brand conscious.
Originality/value– Given that the Mexican market provides growth opportunities for US apparel retailers, there has been a dearth of empirical research on Mexican college students’ attitudes and perceptions toward US brands. In this regard, this paper is designed to determine the factors influencing Mexican college students’ purchase of US apparel brands.
KeywordsBrand awareness, Perception, Students, Buying behaviour, Customer orientation, Mexico Paper typeResearch paper
The retail market in the US, like other developed countries in western Europe, is at the mature stage, characterized by retail overcapacity and intensified competition combined with the sluggish population growth (Berneret al., 2001). In this competitive
The current issue and full text archive of this journal is available at www.emeraldinsight.com/1361-2026.htm
This project was funded by US Department of Education.
JFMM
12,3
294
Received October 2006 Accepted December 2006
Journal of Fashion Marketing and Management
Vol. 12 No. 3, 2008 pp. 294-307
qEmerald Group Publishing Limited 1361-2026
environment, retailers seek to expand operations abroad in order to attract new international customers (Steenkamp and Hofstede, 2002). Apparel retailers, in particular, are becoming transnational businesses as they sell their brands in many more countries than in the past. Consumers in developing countries such as Mexico and China are becoming wealthier and better informed. These consumers with increasing income are presented with foreign brands and thus have additional brand choices in their own market. Accordingly they are more sensitive to what the brand offers, how it speaks to them, and how it addresses their needs (Anholt, 2000).
In order to survive intense competition, US apparel retailers need to employ unique concepts or techniques that differentiate them from international competitors (Good and Granovsky, 1995). Some US apparel retailers (e.g. Polo, Gap, and Guess) are recognized globally for the quality, value, and status appeal those brands represent. The attributes associated with US apparel brands likely enhance the appeal of these retailers to international consumers. This appeal is stronger in developing countries where higher income disparities and status mobility exist (Kottak, 1990). Consumers in developing countries, wishing to lead a life similar to western cultures, seek to emulate Western practices by purchasing foreign brands (Batra et al., 2000; Kinra, 2006). However, in some markets, the attractiveness of US brands is not enough to entice consumers. Anholt (2000) warns against using a simple and robust approach like “buy this, it’s American” (p. 26). Understanding what consumers want and developing targeted strategies may be one of the biggest challenges to US retailers in entering the international market (Hyllegardet al., 2005).
Consumers perceive brands as providing both emotional benefits (e.g. display of status, wealth and prestige) and utilitarian benefits (e.g. quality and low price) (Batra et al., 2000). Their brand perception may influence their intention to purchase the brand. The present study aims to determine the factors affecting Mexican college students’ purchase intentions toward a US clothing brand that is available in their national market. Clothing, a vehicle through which people express their unique views (Goldsmith et al., 1996), is an important product category that illustrates the relationship among individuals’ interests, their perceptions, and their behavior in consumption. Based on the results of this study, implications will be drawn for US apparel retailers regarding what actions they need to take for appropriate marketing mix changes for the Mexican consumer market.
The Mexican consumer market
The implementation of the North American Free Trade Agreement (NAFTA) in 1994 has brought Mexico into the world economy, and increased its imports, including US textiles and apparel. The sale of US apparel in Mexican retail stores is in its rapid growth mode (Market Latin America, 2005). Because of the range of choices that became available with NAFTA, the Mexican consumer has developed the ability to discriminate among brands and find what he or she is looking for (Frastaci, 1999).
In addition to the proximity to the US, the current Mexican retail scene has several characteristics that provide attractiveness to US apparel retailers. Mexican consumers are exhibiting an increasing demand for foreign products, ranging from electronics, to upscale consumer goods, and to novelty items. In most cases, this preference for imported goods is tied to a high level of brand loyalty (Bos, 1994), leading to a long-term success for retailers. Furthermore, Mexicans tend to view US-made apparel
Factors affecting
purchase
intention
as high quality with a good fashion image. Thus, Mexican consumers are willing to pay more for these attractive attributes (Frastaci, 1999; Keillor et al., 1996). The Mexican population is very young; more than 50 percent of the population is under 21 years old. This growing proportion of young people ensures a steadily growing customer base for retailers (Latin America Monitor, 2005) and guarantees a potentially large market in the future as the Mexican economy continues to grow (Frastaci, 1999). Finally, a Deloitte research study identifies Mexico as an attractive country to invest in retailing (Deloitte, 2006).
Given the Mexican market that provides growth opportunities for US apparel retailers, there has been a dearth of empirical research on Mexican consumers’ attitudes and perceptions toward US brands. In this regard, this study is designed to determine what factors influence the purchase intention of US apparel brands among Mexican college students, who constitute an important consumer segment purchasing US brands (Scardino, 2003).
Hypotheses development
This study is designed to determine the factors influencing Mexican college students’ purchase intention toward a US apparel brand. Purchase intention is explained with several variables: normative interpersonal influence, brand consciousness, perceived quality, and emotional value. The relationships among these variables are explained by the hypotheses in the following sections.
Normative interpersonal influence ! brand consciousness
Individuals are influenced by others on development of attitudes, interests, norms, and purchase behavior. These individuals conform to group norms or modify their judgments based upon others’ evaluations. Accordingly, susceptibility to interpersonal influence has been used as an important individual difference variable for the study of consumer behavior (Beardenet al., 1989).
Bearden et al.(1989) reports the development of an interpersonal influence scale consisting of two dimensions: an informational and normative dimension. The authors defines the informational influence as “the tendency to learn about products and services by observing others or seeking information from others” and the normative influence as “the need to identify with or enhance one’s image in the opinion of significant others through the acquisition and use of products and brands, the willingness to conform to the expectations of others regarding purchase decisions” (Beardenet al., 1989, p. 474). Because consumers are likely to wear clothing to display their image or social status to others and thus conform to the expectations of others (Kaiser, 1998; O’Cass and McEwen, 2004), the present study will focus on the normative component.
Susceptibility to normative group influence relates to an individual’s status consumption and conspicuous consumption tendencies. This applies clothing that is a publicly visible product. Clothing brands that serve to communicate social distinctions (e.g. status) reflect consumers’ social life, aspirations, and their affiliation (Levy, 1959; Solomon, 1986). The social role of clothing is even more important in developing countries, where interpersonal relationships are of prime importance (Geret al., 1993). Consumers in Mexico, which is considered to be a collectivist society, tend to be group-oriented (Hofstede, 2001) and maintain interpersonal relationships by being in
JFMM
12,3
tune with the wishes and feelings of others (Albert, 1996). In addition, Mexican consumers are status-oriented and want to exhibit their social standing through their possessions (Frastaci, 1999). These characteristics heighten their awareness of and attraction to brands in the market. This increases their brand consciousness, defined as the degree to which a consumer is oriented towards buying well-known branded products (Shim and Gehrt, 1996).
In collectivist societies, compared to individualist societies, consumers rely more on interpersonal relationships for information search or exchange. This information search or exchange is especially important regarding brand choice because, in a collectivist society, the positive experience with the brand could enhance belongingness to the group (Moneyet al., 1998). Therefore, it can be posited that:
H1. Mexican college students who have a higher level of normative interpersonal influence will have a higher level of brand consciousness.
Brand consciousness ! perceived quality, emotional value
Many consumers form perceptions about a brand based upon quality (Doyle, 2001). A brand’s country of origin has been associated with consumers’ perceptions of quality; consumers in developing countries perceive foreign brands to be of a higher quality than domestic brands (Iyer and Kalita, 1997; Kinra, 2006).
Individuals interested in apparel brands tend to pay more attention to physical properties and features of the clothing that include quality and fit (Kaiser, 1998). Also, quality has been associated with brand name (Batraet al., 2000; Maxwell, 2001); this association is greater to US brands as they are perceived as high quality by Mexican consumers (Frastaci, 1999). According to Jamal and Goode (2001), a brand-conscious consumer tends to place more importance on attributes such as brand name and country of origin than one who is not interested in buying well-known branded products. Based on this reasoning, it can be posited that Mexican college students who are brand conscious will have a positive perception toward the quality of a US apparel brand. Thus:
H2. Mexican college students who have a higher level of brand consciousness will perceive a US apparel brand to have higher quality.
Products and brands may provide non-utilitarian benefits such as fun and enjoyable experiences that generate distinct emotional value for consumers (Holbrook, 1986). Emotional value is defined as the benefit derived from the feeling or affective states (i.e. enjoyment or pleasure) that a product generates (Sweeney and Soutar, 2001). As a product category that induces high involvement and interest due to its symbolic and hedonic nature, clothing tends to evoke emotion as consumers go through the stages of selection and use (Kimet al., 2002).
In developing countries, foreign brands are perceived as possessing attractive attributes such as with status and esteem, which enhances the emotional reward (e.g. a sense of pleasure and happiness) that a consumer derives from the use of those brands (Bhat and Reddy, 1998; Kinra, 2006). More specifically, Shen et al. (2002) find that consumers in developing countries such as China, Singapore, and Hungary prefer products from western countries over locally made products because western brands provide more emotional benefits. This finding can be explained in several ways. In developing countries, imports are usually more expensive and scarcer than domestic
Factors affecting
purchase
intention
products, making them more desirable from consumers (Bearden and Etzel, 1982). According to Frastaci (1999), products that come from the US are perceived to be attractive by consumers in developing countries because of the newness and the novelty. Also, consumers in developing countries are relatively less affluent than those in developed countries and thus they often seek to emulate the western consumption practices and purchase the brands that symbolize western lifestyles associated with affluence.
These arguments apply to Mexican consumers, especially those who are brand-conscious. Because Mexican consumers are known to have strong affinity toward American value (Vaezi, 2005), it can be suggested that brand-conscious consumers will possess high affinity toward American apparel brands. Additionally, it has been reported that a positive relationship exists between brand consciousness and hedonic value (Wang et al., 2000). For these reasons, it is anticipated that Mexican college students who have greater brand consciousness perceive greater emotional value from the US apparel brand they purchase. Thus:
H3. Mexican college students who have a higher level of brand consciousness will perceive a US apparel brand to have higher emotional value.
Perceived quality ! emotional value
It has been reported that utilitarian (functional) value and hedonic (emotional) value are conceptually related (Babinet al., 1994). Specifically, product quality has been linked to affect because perceived quality, reinforced by retail atmospherics, creates personal shopping value and encourages patronage (Darden and Babin, 1994; Wakefield and Baker, 1998). Therefore, higher product quality not only enhances utilitarian value, but rewards the consumer emotionally by providing more gratifying experience (Babin et al., 2004). Also, it is reported that consumers attribute high-perceived quality, luxury, prestige, and high class to status fashion brands (Shermach, 1997). Clearly, perceived quality appears to bring emotional value to consumers. Thus:
H4. Mexican college students who perceive a US apparel brand to have higher quality also will perceive it to have higher emotional value.
Perceived quality, emotional value ! purchase intention
Consumers may intend to purchase a particular brand because they perceive the brand to offer the right features, quality, or performance benefits. The perception of high quality may be closely linked to the differentiation and superiority of a particular brand and thus encourage them to choose that brand over competing brands (McConnell, 1968; Yooet al., 2000). Simply put, other aspects of any two brands being equal, consumers may purchase the brand with higher quality. Thus:
H5. Mexican college students who perceive a US apparel brand to have higher quality will have a higher purchase intention toward the brand.
While consumers may choose a particular brand based on quality, their brand purchase is increasingly driven by their emotional needs as well. Because emotional value is closely related to positive feelings from using the brand, it increases consumer intention to repurchase the brand (Stauss and Neuhaus, 1997; Yu and Dean, 2001). In other words, consumers who are emotionally satisfied with the purchase of a brand
JFMM
12,3
tend to re-purchase the brand even when provided with other options (Gobe, 2001). Also, Batra and Homer (2004) argue that the emotional benefits desired by consumers from a brand have a greater impact on intentions and actual behavior (e.g. brand choice) than on brand attitudes. Hence, it can be postulated that Mexican college students’ purchase intention toward a brand will increase as their emotional value increases toward the brand. Thus:
H6. Mexican college students who perceive a US apparel brand to have higher emotional value will have a higher purchase intention toward the brand.
Methods Sample
The sample for this study included 256 Mexican consumers from a university in Monterrey, Mexico. A total of 67 percent of the sample was female. The ages in the sample ranged from 19 to 27, with a mean age of 23 years. The respondent’s average expenditure on clothing purchases in the past 12 months was approximately $10,324 Mexican peso (equivalent to $925 US dollar).
Measures
The measures consist of general consumer variables (i.e. normative influence and brand consciousness) and brand-specific variables (i.e. perceived quality, emotional value, and purchase intension). The items used to measure the constructs in this study are derived from previous studies. Each item is rated on a six-point scale anchored by “strongly disagree” (1) and “strongly agree” (6).
Scale items for normative influence are adapted from Bearden et al.(1989); brand consciousness, from Shim and Kotsiopulos (1993); perceived quality, from Doddset al. (1991); and emotional value, from Sweeney and Soutar (2001). The scale items for purchase intention are newly developed for this study measured by two items: (1) “I intend to buy this brand frequently,” and (2) “I plan to buy this brand more often.” Table I provides the summary description and Cronbach’s alphas for the variables in this study.
The measures used in this study are initially developed in the USA using American consumers. Consequently, applying these measures to a different cultural group (i.e. Mexico) could potentially be problematic. To solve this problem, several methods were applied. In an effort to enhance face validity, a group of Mexican expert judges (academics and practitioners) qualitatively tested an initial pool of items. Second, equivalence for all items was sought by conducting back-translation. A US-born American citizen who was fluent in Spanish first translated the original English version of the questionnaire into Spanish, and a native Spanish speaker who was fluent in English then translated the Spanish questionnaire into English. Finally the two English versions were compared for conceptual equivalency.
Brand selection
For brand-specific variables, the apparel brand “Polo” is selected as a US apparel brand for two reasons: Polo is one of the representative US apparel brands and possesses a social status of a luxury fashion brand in the US (Seckler, 2006); and Polo shows strong presence in Mexico, available in brick-and-mortar stores including designer boutiques and flagship stores (Bow, 1999).
Factors affecting
purchase
intention
Results
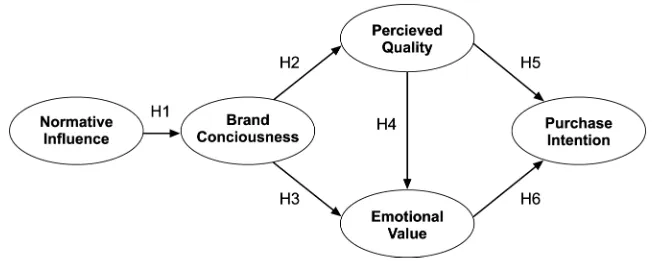
The proposed model (Figure 1) consists of one exogenous variable (normative influence) and four endogenous variables (brand consciousness, perceived quality, emotional value, and purchase intention). Structural equation modeling (SEM) with AMOS graphics version 5.0 is used to analyze the data and parameters are estimated using maximum likelihood method. The main data analysis is conducted following the two-step approach suggested by Anderson and Gerbing (1988): validating the measurement model and fitting the structural model. The former is accomplished primarily through confirmatory factor analysis, while the latter is accomplished primarily through path analysis with latent variables. The overall model is evaluated with the goodness-of-fit index (GFI), the comparative fit index (CFI), and the root mean square error of approximation (RMSEA).
Measurement model
Prior to confirmatory factor analysis (CFA), exploratory factor analysis (EFA) using principal component analysis with varimax rotation, is performed to identify the factor
Constructs Items
Standardized
estimate t-value
Cronbach’s alpha Normative influence By buying the same brands as my
friends, I achieve a sense of belonging 0.74 9.81* I buy the latest fashion when I am
sure my friends like them 0.73 9.72*
If other people see me using a product,
I buy the brand they expect me to buy 0.70 9.37* 0.86 I like to know what brands make a
good impression on others 0.66 8.93*
I achieve a sense of belonging by buying the same brands that others
purchase 0.72 11.33*
If I want to be like someone, I try to
buy same brands that they buya 0.66 – Brand-consciousness It is important to buy well-known
clothing brandsa 0.82 –
I try to stick to certain brands 0.58 7.63* 0.70 I pay attention to brand name 0.57 7.67*
Perceived quality Be reliable 0.80 11.52*
Be durable 0.78 11.35* 0.94
Be high qualitya 0.75 –
Emotional value Make me feel good 0.85 20.24*
Give me pleasure 0.92 25.09* 0.82
Make me want to use it 0.88 22.05*
Feel comfortable using ita 0.92 –
Purchase intention I intend to buy this brand frequentlya 0.88 –
I plan to buy this brand more often 0.84 13.09* 0.85 Notes:aThe corresponding parameter is fixed to a value of 1.00 to set the scale of measurement; *significant atp,0.001
structure of the observed variables. Factors with an eigenvalue greater than 1.0 and items with factor loading above 0.60 are included in further analyses.
CFA is used to validate the measurement model that consisted of five constructs measured by 22 observed variables. During the process of CFA, four items are deleted from the model because of large standardized residuals greater than 2.58, indicating high correlations among the error terms (Schumacker and Lomax, 2004). The final model consists of five constructs with 18 observed variables (Table I). As illustrated in Table I, all lambda coefficients of hypothesized paths are highly significant, ranging from 0.57 to 0.92, with thetstatistic between 7.63 and 25.09 (p,0.001). Also, this
model provides very good fit to the data: x2ð124Þ ¼207:0, p,0.001; x2=dfratio¼1:67; GFI¼0:92; CFI¼0:97; RMSEA¼0:05.
The construct validities of the latent constructs are evaluated by both convergent and discriminant validity. All path weights are significant (p,0.001) and the
composite reliabilities of all constructs are greater than the minimum criteria of 0.70 (Nunnally and Bernstein, 1994), indicating adequate convergent validity. In addition to the above evidence of convergent validity, Fornell and Larcker (1981) suggests that the average variance extracted (AVE) provides evidence of the overall convergent validity of each construct. This measure indicates the amount of variance explained by the construct relative to the amount of variance that may be attributed to measurement error and should exceed 0.50. Table II presents that most AVE values exceed 0.50 except one construct (i.e. brand consciousness), ranging from 0.54 to 0.80. Even if the AVE value of brand consciousness (0.45) is a little less than the acceptable level, it is significantly larger than the shared variance.
Figure 1. Proposed model
1 2 3 4 5
1. Normative influence 0.54
2. Brand consciousness 0.44 0.45
3. Perceived quality 0.06 0.01 0.62
4. Emotional value 0.07 0.05 0.42 0.80
5. Purchase intention 0.17 0.15 0.08 0.40 0.75
Notes:Diagonal entries (italic) show the average variance extracted by the construct; Off-diagonal entries represent the variance shared (squared correlation) between constructs
Table II. Construct validities of the measurement model
Factors affecting
purchase
intention
In terms of discriminant validity, Fornell and Larcker (1981) indicate that the AVE for each construct should be greater than the squared correlation (i.e. shared variance) between that construct and any other construct. None of the squared correlations exceed the AVE values for any of the constructs (Table II).
Structural model and hypotheses testing
A structural model is constructed to examine the hypothesized relationships among constructs. As illustrated in Table III, goodness-of-fit statistics, indicating the overall acceptability of the structural model analyzed, are acceptable: x2ð128Þ ¼239:1, p,0.001;x2=df ratio¼1:87; GFI¼0:91; CFI¼0:96; RMSEA¼0:06. As illustrated in Table III, the most path coefficients are significant (p,0.05).
The results of hypotheses testing can be found in Figure 2. As posited inH1, the positive coefficient estimates for the paths from normative influence to brand consciousness are significant (g¼0:69,p,0.001).H2is not supported, indicating no significant relationship between brand consciousness and perceived quality (b¼0:14, p,0.09). A directional influence from brand consciousness to perceived quality is
Hypothesis Structural paths
Standardized estimate
Standard
error t-value
H1 Normative influence!brand consciousness 0.69 0.11 7.65* * *
H2 Brand consciousness!perceived quality 0.14 0.06 1.71
H3 Brand consciousness!emotional value 0.19 0.07 3.13* *
H4 Perceived quality!emotional value 0.62 0.12 8.84* * *
H5 Perceived quality!purchase intention 20.22 0.15 22.50*
H6 Emotional value!purchase intention 0.78 0.09 8.87* * *
Notes: Fit statistics – x2ðdfÞ ¼x2=df ratio=pvalue x2ð128Þ ¼239:1=1:87=0:000; root mean square error of approximation (RMSEA) – 0.06; comparative fit index (CFI) – 0.96; goodness-of-fit index (GFI) – 0.91; *p,0.05, * *p,0.01, * * *p,0.001
Table III.
Standardized coefficients and fit statistics for the structural model
Figure 2. Result of SEM
JFMM
12,3
found, supporting H3 (b¼0:19, p,.01). The influence of perceived quality to
emotional value is found as well, supportingH4(b¼0:62,p,0.001).
Contrary to the expectation, the result does not support a positive effect of perceived quality on purchase intention (H5); rather, there was a negative effect (b¼20:22, p,0.05). Finally, a positive effect of emotional value on purchase intention is
significant (b¼0:78,p,0.001), supportingH6.
Discussion
This study demonstrates that Mexican college students’ normative influence, brand consciousness, and emotional value are direct and indirect antecedents of purchase intention. The positive relationship between Mexican college students’ susceptibility for normative influence and brand consciousness suggests that they are likely to buy well-known clothing brands to conform to the expectations of others or to achieve a sense of belonging.
The positive relationship between brand consciousness and emotional value for the US apparel brand suggests that brand-conscious Mexican college students have positive attitude toward the US apparel brand and consider the US brand as providing high emotional value. However, there is no relationship between brand consciousness and perceived quality, indicating that Mexican college students, regardless of the level of their brand consciousness, perceives the US apparel brand as durable (M¼4:75), reliable (M ¼4:80), and high quality (M ¼4:86).
Contrary to the previous findings of a positive relationship between perceived quality and purchase intentions (e.g. Yoo et al., 2000), in this study, a negative relationship is found between these two variables. The negative effect of perceived quality on purchase intention of the Polo brand can be explained in several ways. First, Mexican college students may not perceive a functional aspect of clothing as important as emotional aspect of clothing when they make a purchase decision. Second, due to the greater availability of inexpensive local brands compared to more expensive US brands and their preference for familiar business and products (Ahmed and d’Astous, 2003), the likelihood of Mexican consumers’ buying US brands may be lower. Third, although the demand for American products is increasing, Mexican products are still in greatest demand, implying that Mexican consumers’ perceptions toward domestic products are very favorable and that US retailers are facing challenges against the competition from Mexican retailers (Frastaci, 1999).
However, the significant relationship between perceived quality and emotional value, which influence purchase intention, explains indirect relationship between perceived quality and purchase intention. In other words, if positive perception of brand quality yields an emotional value, these two combined benefits will influence purchase intention. Emotional value is found to be a significant predictor of Mexican college students’ purchase intention for the US apparel brand. This supports Chaudhuri and Holbrook’s (2001) finding that emotional values influenced purchase intentions through brand loyalty and affect. This study clearly demonstrates that emotional value plays a critical role in forming Mexican college students’ purchase intention toward a US apparel brand.
Conclusions
This study provides valuable strategic implications for US retailers who plan to enter the Mexican market. The results suggest that consumers’ susceptibility for normative
Factors affecting
purchase
intention
influence has a positive influence on purchase intention for the US apparel brand through brand consciousness and emotional value. Thus, US retailers could focus on the emotional aspects of US brands in order to appeal to Mexican college students, especially those who are brand conscious. Advertising messages could impart emotionally-appealing messages stressing the famous US apparel brand. Also, these advertisements can feature the US apparel brand endorsed by reference groups (e.g. peer group and aspirational group) who are important to Mexican college students. In a retail setting, stores can convey the feelings of fun and enjoyment by offering a wide assortment of products and an appealing ambience. In order to overcome the negative relationship between Mexican consumers’ perceived quality and purchase intention toward US brands, US retailers could attempt to convince Mexican consumers of a standardized quality and respond to their price sensitivity at the same time.
Clearly the use of a student sample in this study limits the generalizability of the findings, as students represent only a subset of Mexican consumers. Future research should be conducted with a sample more representative of the entire consumer population including teens and Generation X. Also, cross-cultural studies are recommended to compare consumers in industrialized countries (e.g. US, Canada, and western European countries) and consumers in emerging countries (e.g. China, India, and Russia) in their attitudes and perceptions toward global brands. This study used an apparel brand that is associated with hedonic attributes, which may have resulted in the significant influence of emotional value on purchase intention. Future studies may be extended to other consumer products.
References
Ahmed, S.A. and d’Astous, A. (2003), “Product-country images in the context of NAFTA: a Canada-Mexico study”,Journal of Global Marketing, Vol. 17 No. 1, pp. 23-43.
Albert, R. (1996), “A framework and model for understanding Latin American and Latino/Hispanic cultural patterns”, in Landis, D. and Bhagat, R. (Eds), Handbook of Intercultural Training, Sage, Thousand Oaks, CA, pp. 327-48.
Anderson, J.C. and Gerbing, D.W. (1988), “Structural equation modeling in practice: a review of recommended two-step approach”,Psychological Bulletin, Vol. 103 No. 3, pp. 411-23. Anholt, S. (2000), “The nation as brand”,Across the Board, Vol. 37 No. 10, pp. 22-7.
Babin, B.J., Darden, W.R. and Griffin, M. (1994), “Work and/or fun: measuring hedonic and utilitarian shopping value”,Journal of Consumer Research, Vol. 20 No. 4, pp. 644-56. Babin, B.J., Chebat, J-C. and Michon, R. (2004), “Perceived appropriateness and its effect on
quality”,Journal of Retailing and Consumer Services, Vol. 11 No. 5, pp. 287-98.
Batra, R. and Homer, P.M. (2004), “The situational impact of brand image beliefs”,Journal of Consumer Psychology, Vol. 14 No. 3, pp. 318-30.
Batra, R., Ramaswamy, V., Alden, D.L., Steenkamp, J-B.E.M. and Ramachander, S. (2000), “Effects of brand local and nonlocal origin on consumer attitudes in developing countries”,
Journal of Consumer Psychology, Vol. 9 No. 2, pp. 83-5.
Bearden, W.O. and Etzel, M.J. (1982), “Reference group influence on product and brand purchase decisions”,Journal of Consumer Research, Vol. 9 No. 2, pp. 183-94.
Bearden, W.O., Netemeyer, R.G. and Teel, J.E. (1989), “Measurement of consumer susceptibility to interpersonal influence”,Journal of Consumer Research, Vol. 15 No. 4, pp. 473-81.
JFMM
12,3
Berner, R., Khermouch, G. and Pascual, A. (2001), “Retail reckoning”,BusinessWeek Online, available at: www.businessweek.com/magazine/content/01_50/b3761089.htm
Bhat, S. and Reddy, S.K. (1998), “Symbolic and functional positioning of brands”,Journal of Consumer Marketing, Vol. 15 No. 1, pp. 32-43.
Bos, C.A. (1994), “The road to Mexico”,Target Marketing, Vol. 17 No. 4, pp. 48-9. Bow, J. (1999), “Mexico city stores: high-end survivors”,WWD: Women’s Wear Daily, p. 9. Cervantes, F. (1980), “The forgotten consumers: the Mexican Americans”, in Bogozzi, R.et al.
(Eds),Educators’ Conference Proceedings, American Marketing Association, Chicago, IL, pp. 180-3.
Chaudhuri, A. and Holbrook, M.B. (2001), “The chain of effects from brand trust and brand affect to brand performance: the role of brand loyalty”,Journal of Marketing, Vol. 65 No. 2, pp. 81-93.
Darden, W.R. and Babin, B.J. (1994), “Investigation of product liability attitudes and opinions: a consumer perspective”,Journal of Consumer Affairs, Vol. 28 No. 1, pp. 54-80.
Deloitte (2006),Global Powers of Retailing 2006: Managing Risk and Reward, Deloitte, available at: www.deloitte.com/dtt/cda/doc/content/Global%20Powers_06_2.pdf
Dodds, W.B., Monroe, K.B. and Grewal, D. (1991), “Effect of price, brand, and store information on buyers’ product evaluations”,Journal of Marketing Research, Vol. 28, pp. 307-19. Douglas, M. and Isherwood, B.C. (1979),The World of Goods, Basic Books, New York, NY. Doyle, P. (2001), “Shareholder-value-based brand strategies”,Brand Management, Vol. 9 No. 1,
pp. 20-30.
Fornell, C. and Larcker, D.F. (1981), “Evaluating structural equation models with unobservable variables and measurement error”,Journal of Marketing Research, Vol. 18 No. 1, pp. 39-50. Frastaci, M. (1999), “Approaching Mexican retailers”,Apparel Industry, Vol. 60 No. 5, pp. 26-30. Ger, G., Belk, R.W. and Lascu, D.N. (1993), “The development of consumer desire in marketing and developing economies: the cases of Romania and Turkey”,Advances in Consumer Research, Vol. 20 No. 1, pp. 102-7.
Gobe, M. (2001),Emotional Branding: The New Paradigm for Connecting Brands to People, Allworth Press, New York, NY.
Goldsmith, R.E., Flynn, L.R. and Moore, M.A. (1996), “The self-concept of fashion leaders”,
Clothing and Textiles Research Journal, Vol. 14 No. 4, pp. 242-8.
Good, A.H. and Granovsky, S. (1995), “Retail goes global”,Canadian Business Review, Vol. 22 No. 2, pp. 31-3.
Hofstede, G. (2001),Comparing Values, Behaviors: Institutions and Organizations across Nations, Sage, Thousand Oaks, CA.
Holbrook, M.B. (1986), “Emotion in the consumption experience: toward a new model of the human consumer”, in Peterson, R.A. (Ed.), The Role of Affect in Consumer Behavior, Heath, Lexington, MA, pp. 17-52.
Hyllegard, K., Eckman, M., Descals, A.M. and Borja, M.A. (2005), “Spanish consumers’ perceptions of US apparel specialty retailers’ products and services”,Journal of Consumer Behaviour, Vol. 4 No. 5, pp. 345-62.
Iyer, G.R. and Kalita, J.K. (1997), “The impact of country-of-origin and country-of-manufacture cues on consumer perceptions of quality and value”,Journal of Global Marketing, Vol. 11 No. 1, pp. 7-27.
Factors affecting
purchase
intention
Jamal, A. and Goode, M. (2001), “Consumers’ product evaluation: a study of the primary evaluative criteria in the precious jewellery market in the UK”, Journal of Consumer Behaviour, Vol. 1 No. 2, pp. 140-55.
Johansson, J.K. (1997), Global Marketing, Foreign Entry, Local Marketing, and Global Management, McGraw-Hill, New York, NY.
Kaiser, S.B. (1998), Social Psychology of Clothing: Symbolic Appearances in Context, Fairchild Publications, New York, NY.
Keillor, B.D., Parker, R.S. and Schaefer, A. (1996), “Influences on adolescent brand preferences in the United States and Mexico”,Journal of Advertising Research, Vol. 36 No. 3, pp. 47-56. Kim, H., Damhorst, M. and Lee, K. (2002), “Apparel involvement and advertisement process”,
Journal of Fashion Marketing and Management, Vol. 6 No. 3, pp. 277-302.
Kinra, N. (2006), “The effect of country-of-origin on foreign brand names in the Indian market”,
Marketing Intelligence and Planning, Vol. 24 No. 1, pp. 15-30. Kottak, C.P. (1990),Prime Time Society, Wadsworth, Belmont, CA.
Latin America Monitor (2005), “Latin America Monitor Mass grocery retail”, Latin America Monitor: Mexico Monitor, Vol. 22 No. 12, pp. 6-8.
Levy, S.J. (1959), “Symbols for sale”,Harvard Business Review, Vol. 37 No. 4, pp. 117-9. McConnell, D. (1968), “The development of brand loyalty: an experimental study”,Journal of
Marketing Research, Vol. 5 No. 1, pp. 13-19.
Market Latin America(2005), “Mexico’s consumers are optimistic-and spending”,Market Latin America, Vol. 13 No. 10.
Maxwell, S. (2001), “An expanded price/brand effect model: a demonstration of heterogeneity in global consumption”,International Marketing Review, Vol. 18 No. 3, pp. 325-43. Money, R.B., Gilly, M.C. and Graham, J.L. (1998), “Explorations of national culture and
word-of-mouth referral behavior in the purchase of industrial services in the United States and Japan”,Journal of Marketing, Vol. 62 No. 4, pp. 76-87.
Nunnally, J.C. and Bernstein, I. (1994),Psychometric Theory, McGraw-Hill, New York, NY. O’Cass, A. and McEwen, E. (2004), “Exploring consumer status and conspicuous consumption”,
Journal of Consumer Behaviour, Vol. 4 No. 1, pp. 25-39.
Saegert, J., Hoover, R.J. and Hilger, M.T. (1985), “Characteristics of Mexican American consumers”,Journal of Consumer Research, Vol. 12 No. 1, pp. 104-9.
Scardino, E. (2003), “Mass makes move to win back misses”,DSN Retailing Today, Vol. 42 No. 1, p. 41.
Schumacker, R.E. and Lomax, R.G. (2004),A Beginner’s Guide to Structural Equation Modeling, 2nd ed., Lawrence Erlbaum Associates, Mahwah, NJ.
Seckler, V. (2006), “Luxe study: rating the brands by status”, Women’s Wear Daily, Vol. 191 No. 123, p. 24.
Shen, D., Lennon, S., Dickson, M.A., Montalto, C. and Zhang, L. (2002), “Chinese consumers’ attitudes toward US- and PRC-made clothing: from a cultural perspective”, Family and Consumer Sciences Research Journal, Vol. 31 No. 1, pp. 19-49.
Shermach, K. (1997), “What consumers wish brand managers knew”,Marketing News, Vol. 31 No. 12, pp. 9-17.
Shim, S. and Gehrt, K.C. (1996), “Hispanic and Native American adolescents: an exploratory study of their approach to shopping”,Journal of Retailing, Vol. 72 No. 3, pp. 307-24.
JFMM
12,3
Shim, S. and Kotsiopulos, A. (1993), “A typology of apparel shopping orientation segments among female consumers”,Clothing and Textiles Research Journal, Vol. 12 No. 1, pp. 73-84. Solomon, M.R. (1986), “Deep-seated materialism: the case of Levi’s 501 jeans”,Advances in
Consumer Research, Vol. 13 No. 1, pp. 619-22.
Stauss, B. and Neuhaus, P. (1997), “The qualitative satisfaction model”,International Journal of Service Industry Management, Vol. 8 No. 3, pp. 236-49.
Steenkamp, J.E.M. and Hofstede, F. (2002), “International market segmentation: issues and perspectives”,International Journal of Research in Marketing, Vol. 19 No. 3, pp. 185-213. Sweeney, J.C. and Soutar, G. (2001), “Consumer perceived value: the development of a multiple
item scale”,Journal of Retailing, Vol. 77 No. 2, pp. 203-20.
Vaezi, S. (2005), “Marketing to Mexican consumers”,Brand Strategy, No. 190, pp. 43-5. Wakefield, K.L. and Baker, J. (1998), “Excitement at the mall: determinants and effects on
shopping response”,Journal of Retailing, Vol. 74 No. 4, pp. 515-40.
Wang, C-L., Chen, Z-X., Chan, A. and Zheng, Z-C. (2000), “The influence of hedonic values on consumer behaviors: an empirical investigation in China”,Journal of Global Marketing, Vol. 14 Nos 1/2, pp. 169-86.
Winsted, K.F. (1997), “The service experience in two cultures: a behavioral perspective”,Journal of Retailing, Vol. 73 No. 3, pp. 337-60.
Yoo, B., Donthu, N. and Lee, S. (2000), “An examination of selected marketing mix elements and brand equity”,Journal of the Academy of Marketing Science, Vol. 28 No. 2, pp. 195-211. Yu, Y.-T. and Dean, A. (2001), “The contribution of emotional satisfaction to consumer loyalty”,
International Journal of Service Industry Management, Vol. 12 No. 3, pp. 234-50.
Corresponding author
Min-Young Lee can be contacted at: [email protected]
Factors affecting
purchase
intention
307
To purchase reprints of this article please e-mail:[email protected]
An application of the ECSI model
as a predictor of satisfaction and
loyalty for backpacker hostels
Bill Chitty, Steven Ward and Christina Chua
Murdoch Business School, Murdoch University, Perth, Australia
Abstract
Purpose– To determine which factors account for customer satisfaction with a service and their loyalty to a given service provider, in the particular, context of “backpacking” in Australia, a significant element of the country’s hospitality and tourism economy.
Design/methodology/approach– A series of hypotheses was developed from the services marketing literature and built into a 52 item questionnaire administered to 281 backpackers staying at the three youth hostels in Australia, who thus responded whilst actually experiencing the service encounter rather than in recalling it later. The European Customer Satisfaction Index (ECSI) was used to measure the strength and direction of the determinants of customer satisfaction, and the impact that the antecedents of satisfaction had on loyalty to the generic provider.
Findings– The results of confirmatory factor analysis of the questionnaire responses suggest that brand image is a predictor of satisfaction with a hostel, while perceived value indicates a degree of loyalty towards the “brand”.
Research limitations/implications– The ECSI model’s generic measuring criteria limit its generalisability. Further, research could usefully investigate other variables applicable to both hostels and conventional hotels to be included in a measurement model of satisfaction and loyalty for the whole hospitality industry.
Practical implications– Backpacker hostels are an example of experienced-based service encounters with few clear comparative advantages. The marketing of the generic brand must therefore foster a brand image congruent with the experience actually delivered and the potential customers’ expectations of it, thereby reducing decision risk.
Originality/value– The unusual context and particular methodology cast fresh light on an important challenge for marketing planners in the service industries.
KeywordsCustomer satisfaction, Brand loyalty, Tourism, Australia Paper typeResearch paper
Introduction
The term “backpacker” has been used by the tourism industry to describe predominantly young, budget-conscious tourists on extended or working holidays in Australia, South East Asia and New Zealand (Loker-Murphy, 1993; McCulloch, 1992; Pearce, 1990; Spreitzhofer, 1998). Backpackers are important from a tourism development perspective because, on average, they stay longer (68 versus 28 nights), spend more than other tourists ($A5 284 versus A2,604), and visit more locations than other international visitors (BTR, 2002; Jarvis, 1993, p. 11). An international visitor survey conducted by the Bureau of Tourism Research in Australia found that, for the nine months ending 31 March 2002, 11 per cent of all international visitors to Australia were classified as backpackers, that backpackers accounted for 27 per cent of visitor
The current issue and full text archive of this journal is available at
www.emeraldinsight.com/0263-4503.htm
nights spent in Australia, and that they spent approximately $A2,028.5 million
(BTR, 2002), approximately equal to US$1,718.5 million ore1,277.0 million.
Independence is the prominent trait of backpackers that differentiates them from the majority of tourists (Jarvis, 1993; Loker-Murphy, 1996; Loker-Murphy and Pearce, 1995; Pearce, 1990). It is therefore crucial that marketers understand what factors influence the backpackers’ perceived value with of and satisfaction of tourist services, in this case the budget accommodation that is often called “backpacker hostels”.
Thus, the general research objectives of this paper were:
. to test the applicability of the European Customer Satisfaction Index (ECSI)
model as a means of identifying the key attributes that determine backpackers’ perceived value of backpacker hostels; and
. to determine the strength and degree to which perceived value influences
backpackers’ satisfaction, and ultimately their loyalty to backpacker hostels.
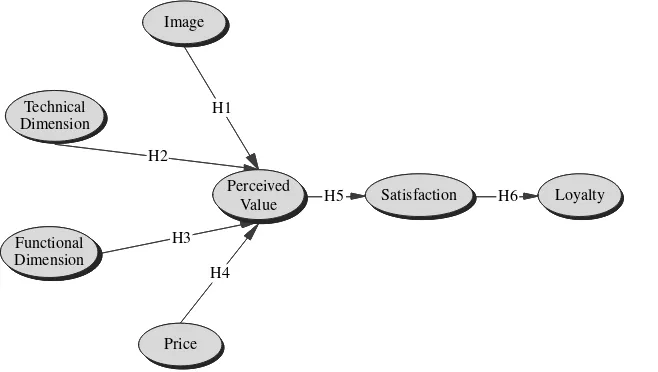
The ESCI model is a conceptual framework of customer satisfaction that includes the independent variables of technical and functional dimensions, image, and price. It is described more fully in the first section of the literature review, which follows. The second objective is based on an assumed relationships between perceived value and customer satisfaction. Specifically, backpackers’ loyalty to a hostel, based on word-of-mouth referrals and their won repeat-purchase intentions, is the posited outcome of satisfaction. This network of causal factors forms the main focus of the study.
Literature review and research hypotheses The ECSI framework
The ECSI is derived from successful applications of the Swedish and American national customer satisfaction indices, designed to improve the measurement of customer satisfaction, and has been validated in such service industries as telecommunications, postal services and banks.
Kristensenet al.(2000, p. S1008) describe it as “a structural equation model with
unobservable latent variables ...that link customer satisfaction to its determinants
and, in turn, to its consequence, namely customer loyalty”. The original ECSI model included customer expectations as an independent variable. Their role in determining perceived value is not discussed in the current study because the backpackers surveyed had stayed at the hostel for more than one night prior to the survey. Thus, their expectations would have been influenced by that experience, rather than other stays elsewhere. (This issue is addressed in greater detail in the Results section.) The revised model suggests that perceived value has an impact on satisfaction, which, in turn, is an antecedent to backpacker loyalty. Perceived value is assumed to result from a backpacker’s perceptions of the core service provided (termed “technical dimensions”), perceptions of service processes (termed “functional dimensions”), the image of the service provider (in this case, YHA Australia, a member of the Hostelling International Network) and the price of the accommodation. This conceptual framework is shown in Figure 1.
Image
Keller (1993) has suggested that image is based on customers’ beliefs about a brand, while Gro¨nroos (2000) argues that it is a value-added antecedent determining
MIP
25,6
satisfaction and loyalty. Despite its clear relevance to customer satisfaction, image does not appear to have been explicitly examined in much of the associated research. It is intuitively reasonable to assume that backpackers’ perceptions of value will often be influenced by the image of a youth hostel, since its “products” cannot easily be distinguished from those of other budget accommodation. According to Fournier and Yao (1997), if backpackers believe that one institution is more credible and trustworthy than another, they develop a favourable image of that hostel. That in turn tends to filter marketing communications and affect the word-of-mouth information that influences
value perceptions. Kristensen et al. (2000) have noted that image has a significant
impact on customer satisfaction and loyalty in a number of ECSI studies. Therefore, we propose that:
H1. Image has a direct impact on a customer’s perception of the value of a
backpacker hostel’s service.
Technical dimensions
Technical (or outcome) dimensions of a service encounter are the tangible objects that remain after the completion of the service production process, when interactions
between providers and their customers have ceased (Dobholkar et al., 1996;
Gro¨nroos, 2000; Morgan and Piercy, 1992). In the case of backpackers, the technical dimensions are what they receive or experience after checking into a backpacker hostel. They include such physical facilities as availability of parking spaces or clean and comfortable accommodation, as well as such other benefits as a TV room, laundry and kitchen areas.
One of the objectives of this research is to determine how these technical dimension of a service experience influence backpackers’ perceived value of the services performed by backpacker hostels. We hypotheses that:
H2. A customer’s perception of the value of a backpacker hostel’s service is
influenced by technical dimensions of the service performance.
Figure 1. Conceptual framework of customer loyalty H1
H5 H6
H4 H3 H2 Technical
Dimension
Functional Dimension
Perceived
Value Satisfaction Loyalty
Image
Price
An application of
the ECSI model
Functional dimensions
The functional dimension of the service process, also described as “process quality” dictates how the service and its concurrent production and consumption process are
received and experienced by customers (Dhabolkaret al., 1996; Gro¨nroos, 2000; Morgan
and Piercy, 1992). Unlike the technical dimension, which can be objectively evaluated, the functional dimension is intangible and subjectively determined by customers (Gro¨nroos, 2000). Both dimensions of the service product influence customers’
perception of value. In earlier studies, Parasuramanet al. (1985) and Suprenant and
Solomon (1987) suggest that friendliness, courtesy and personalised service are components of the functional dimension that contribute to and customer satisfaction. Some specific functional dimensions in the context of backpacker hostels are the behaviour of the staff, the ease of checking in and out, and whether the backpackers are shown to their rooms or left to find them on their own.
Because the evaluation of the functional dimension varies between individuals, it plays an important role in determining customer satisfaction. A related purpose of the current research is therefore to ascertain how the functional dimension of a service encounter affects backpackers’ perceived value of the service offered by a backpacker hostel. Thus:
H3. A customer’s perception of the value of a backpacker hostel’s service is
influenced by functional dimensions of the service performance.
Price
Price is the cost incurred in making a purchase (Tse, 2001) which, together with service quality, influences perceptions of value (Rust and Oliver, 1994, p. 2). It affects spending behaviour because consumers’ discretionary spending limits will determine what is to be bought on the basis of the price (Monroe, 1990). How much they are willing to pay differs because their readiness depends on their needs, and the importance of the
service to them at a given time and place (Heskettet al., 1997). Price is believed to have
an impact on perceived quality because high-quality products and services normally cost more than low-quality equivalents (Curry and Riesz, 1988; Erickson and
Johansson, 1985; Lichtensteinet al., 1988).
As a result, consumers, particularly inexperienced ones, tend to base their
expectations and perceptions of image, quality and value on price (Doddset al., 1991;
Monroe, 1990; Zeithamlet al., 1990). We therefore hypothesis that:
H4. A customer’s perception of the value of a backpacker hostel’s service is
influenced by price.
Perceived value
Perceived value of a service has been defined by McDougall and Levesque (2000) as the benefits customers believe they receive relative to the costs associated with its consumption. Zeithaml and Bitner (2000) have suggested that it is an overall evaluation of a service’s utility, based on customers’ perceptions of what is received at what cost, and that working definition was adopted for the present study.
Value includes not only quality, but also price. Rust and Oliver (1994) contend that a service may be of excellent quality but still be rated as poor value by customers if the
price is too high. Heskettet al.(1997) argue that value is not necessarily equated with
MIP
25,6
low prices because services with a perceived high value may in practice carry high or low prices. Their proposition that the value of a service to customers determines customer satisfaction and loyalty is supported by the classic work of Kotler and Levy (1969) and Howard and Sheth (1969). The findings of personal interviews conducted by the authors as part of a pilot study suggest that the technical and functional dimensions of service delivery, as well as price, are important to backpackers in choosing budget accommodation. Given that perceived value is the result of the interactions of all the independent variables in the conceptual model, backpackers’ perceptions of value were measured in the study.
Satisfaction
Satisfaction is a response that occurs when consumers experience a pleasurable level of consumption-related fulfilment when evaluating a product or service (Oliver, 1997, p. 13). Satisfaction ratings are the means to strategic ends, such as customer retention, and directly affect profits (Jones and Sasser, 1995; Reichheld, 1996). Mittal and Kamakura (2001) argue that repurchase behaviour should be linked to satisfaction because the cost of retaining and maintaining an existing customer is less than the cost of acquiring a new one. Satisfaction (or dissatisfaction) has been defined as the perceived match or mismatch between, on the one hand, prior expectations of performance and perceptions of the value of the value of an exchange or transaction experience and, on the other, post-consumption evaluation of performance and value (McGuire, 1999; Oliver, 1997; Tse, 2001). The level of satisfaction or dissatisfaction reflects perceptions and attitudes formed from previous service experiences, and influences repurchase intentions (McGuire, 1999). It may also result from a summary cognitive and affective reaction to a service incident, or a long-term service relationship (Rust and Oliver, 1994, p. 2).
Customer satisfaction is an important element in service delivery because understanding and satisfying customers’ needs and wants can generate increased market share from repeat custom and referrals (Barsky, 1992). It therefore has a significant effect on future purchase intentions (Cronin and Taylor, 1992; McAlexander
et al., 1994) and on the formation of customer loyalty. When perceived value increases, the likelihood that customers will stay loyal is expected to increase, while a decrease in value will result in customers being more receptive to competitors’ marketing communications (Gro¨nroos, 2000). Therefore, we further propose that:
H5. Customer satisfaction is a direct effect of a customer’s perception of the value
of backpacker hostels.
Loyalty
Loyalty has been defined by Oliver (1997, p. 392) as:
...a deeply held commitment to rebuy or repatronise a preferred product/service consistently
in the future, thereby causing repetitive same-brand or same brand-set purchasing, despite situational influences and marketing efforts having the potential to cause switching behaviour.
There are two possible ways to conceptualize customer loyalty: behavioural, which is based on repeat-purchase behaviour, and attitudinal, which reflects the inherent affective and cognitive components of loyalty. There is a significant difference between satisfaction, the result of past service encounters, and loyalty, an ongoing relationship
An application of
the ECSI model
with a specific service provider. The concept of backpacker loyalty to one “brand” of hostels implies a rejection of other service providers on the grounds that theirs are inferior to the preferred brand.
In order to identify the links between satisfaction and loyalty in this study, satisfaction is defined as a customer’s post-consumption evaluation of a service, which includes cognitive and affective components, while loyalty is treated as a customer’s commitment to a service provider, which develops from satisfaction and includes the cognitive, affective and conative (intention) components that lead to repeat purchase.
Henning-Thurau et al. (2001) argue that loyalty should be examined from a
relationship-marketing perspective since customers have several service experiences with the service provider, and their satisfaction arises in part from their participation in those service encounters. If this is so, the ECSI model, which was originally developed as a very general explanation of customer loyalty, appears to be a useful framework to examine backpackers’ interactions with YHA Australia staff and the accommodation provided by the organisation.
Previous research also suggests that customer satisfaction can influence customer
loyalty and future purchase intentions (Abdullah et al., 2000). Several authors have
suggested that it is the most important element of customer loyalty (Anderson and
Fornell, 1994; Cronin and Taylor, 1992; Fornell, 1992; Oliva et al., 1992; Oliver and
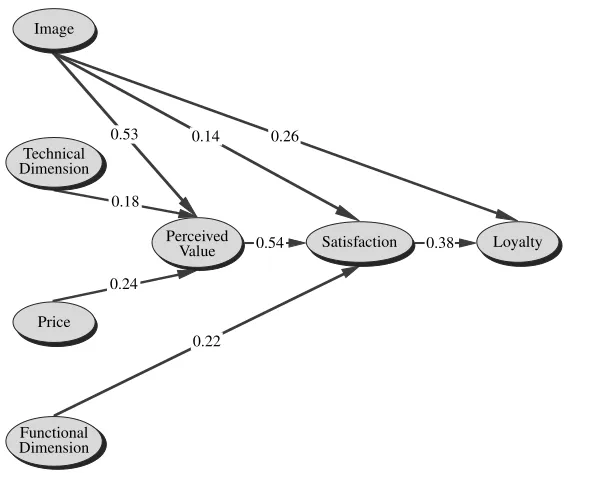
Linda, 1980; Reichheld, 1993). The conceptual framework in Figure 1 is similar to the ECSI model in that it suggests that perceived value influences customer satisfaction and, subsequently, loyalty.
Loyalty is the dependent variable in the current research, and can be examined from two perspectives: “psychological” and “behavioural” (Chaudhuri, 1999; Fournier and Yao, 1997). Backpackers may develop loyalty towards backpacker hostels if they have a positive perception of value associated with the service, and are satisfied with the level of service they receive. The psychological element consists of brand attitudes, while the behavioural component refers to habitual behaviour. For example, when backpackers form a positive psychological loyalty towards YHA Australia, they will tend to continue using its hostels whenever they travel and, after some time, may simply return to the same service provider out of habit. The current research examines the strength and direction of the link between customer satisfaction and customer loyalty for backpacker hostels, as well as assessing whether the model is an effective instrument to measure the two constructs in that context.
Consequently, we finally hypothesise that:
H6. Customer loyalty is a direct consequence of customer satisfaction with the
service performance of backpacker/youth hostels.
Research methodology Sample
The survey sample contained slightly more males than females (57-43 per cent). The great majority (85 per cent) were aged between 20 and 29 years. Exactly half the respondents were British passport holders, followed by Irish (12 per cent) and Dutch (5 per cent) nationals. Almost half (48 per cent) were travelling alone, and roughly two-thirds (65 per cent) held a working-holiday visa that enabled them to travel and work in the country for a year. This relatively long time scale enabled
MIP
25,6
those backpackers to stay for reasonable periods in a particular location. Almost half (45 per cent) intended to spend at least 21 days in Perth.
Survey instrument
The survey questionnaire was developed from the literature review. A pilot study of 50 randomly selected backpackers staying at one YHA Australia hostel assessed its reliability and validity. Some questions were duly revised to improve respondent comprehension and an “unable to judge” category was added for questions that related to the use of some of the hostels’ facilities because some backpackers stay at hostels solely for accommodation. Respondents expressed the strength and directions of their
feelings on a seven-point Likert scale from “strongly disagree” (¼1) to “strongly
agree” (¼7). Price was measured by asking respondents whether they expected to pay
more than $A20 per person for a night’s stay.
The final questionnaire contained 52 questions addressing all the variables shown in Figure 1: image, technical dimensions, functional dimensions, price, perceived value, satisfaction and loyalty.
Results
Descriptive statistics
The measurement properties of the conceptual framework in Figure 1 are shown in Table I.
Analysis
The data were screened using the SPSS program (Version 11). A list wise deletion of missing cases was undertaken and outliers were examined to ensure that extreme values did not influence the results. The assumptions of normality, linearity and homo skedasticity were assessed by examining skewness and kurtosis values and scatter plot diagrams (Tabachnick and Fidell, 1989).
In order to evaluate simultaneously the hypothetical relationships shown in Figure 1, and to evaluate the measurement properties of the important factors in the model so that the findings of the study could more widely applied, it was decided to conduct confirmatory factor analysis (CFA) using AMOS 4.01 (Arbuckle and Wothe, 1997). This is a useful means to assess the extent to which a proposed measurement model reflects reality (the data) in terms of validity and reliability, and can also be used to examine a number of hypothesized paths, or relationships, between important marketing variables – in this case, price, perceived value, satisfaction and loyalty. The other strong advantage of CFA is that findings, especially relationships between factors, can be graphically displayed, which greatly enhances utility as managerial decision aids. In our study, CFA was an effective way to make direct comparisons between the results and what would be expected on the basis of the conceptual model. The analysis consisted of two major steps, starting with first validating the measurements of each shown in Figure 1 and then examining the hypothesized relationships shown.
The validation of measures used in the study were first estimated by determining by CFA a set of congeneric factors, which represented the latent “constructs of interest” (or major variables) under study. The weighted factor scores from that process yielded the index variables, and a further predictive CFA was then conducted.
An application of
the ECSI model
Fit statistics
Scale and items and loadings to latent constructs x2(df) RMSEA RMR Mean (std deviation) areliability
Image (four items) AVE¼ 0.66.
The reputation of hostels is important to me (0.30). This hostel makes a good impression on its guests (0.91). This hostel has a good reputation amongst backpackers (0.73). I feel this hostel suits my needs (0.70)
0.02 (1) 0.00 0.00 1.96 (0.39) 0.76
Technical dimension (six items) AVE¼ 0.58. Satisfied with kitchen (0.58).
Satisfied with TV room (0.67). Satisfied with internet facilities (0.60). Satisfied with telephone facilities (0.72). Satisfied with meals (0.44).
Satisfied with location (0.52)
9.38 (8) 0.02 0.06 5.22 (4.11) 0.82
Functional Dimension (four items) AVE ¼0.85. Staff were polite (0.91).
Staff were helpful (0.92). Staff were friendly (0.94).
Staff had knowledge about attractions and activities (0.64)
0.29 (1) 0.00 0.00 6.35 (0.95) 0.90
Value (four items) AVE¼ 0.81.
The hostel offers good value for money (0.81).
I believe this hostel offers good quality accommodation (0.78). I will enjoy my stay at this hostel (0.76).
I believe this hostel provides good accommodation for the price (0.92)
19.83(4) 0.17 0.04 6.00 (1.10) 0.89
(continued)
Table
I.
Measurement
properties
of
the
one-factor
congeneric
models
–
fit
statistics
(
n
¼
281)
MIP
25,6
Fit statistics
Scale and items and loadings to latent constructs x2(df) RMSEA RMR Mean (std deviation) areliability
Satisfaction (four items) AVE ¼0.75.
I am satisfied with the interactions. I have with this hostel’s staff (0.67). I am satisfied with the interaction. I have with other guests (0.65). Overall
I feel this hostel is better than expected (0.85). All things considered
I am satisfied with my stay at this hostel (0.86)
0.28 (1) 0.00 0.00 6.45 (1.13) 0.86
Loyalty (four items) AVE¼ 0.72.
If I were faced with the same choice again I would stay at this hostel (0.85). If I were faced with the same choice again I would stay at this type of room (0.55).
I would stay in hostels operated under the same chain elsewhere (0.61). I will recommend this hostel to my friends (0.90)
13.20 (2) 0.14 0.06 5.61 (1.13) 0.86
Table
I.
An
application
of
the
ECSI
model
Whilst the discriminatory validity of the constructs is normally examined in that process, the use of congeneric factors represented a compromise, given the larger sample size that would have been required to validate the model with a greater number of parameters. As Holmes-Smith and Rowe (1994, p. 6) put it, the one-factor congeneric model is “the simplest form of a measurement model and represents the regression of a set of observed indicator variables on a single latent variable”. It permits a realistic interpretation of the data by considering the varying degrees to which each item contributes to the overall measure, and is a quasi-test of validity. For a model to fit, individual items must all measure a “composite variable” of the same kind, and, therefore must be valid measures of the single latent trait (Holmes-Smith and Rowe, 1994).
The fit of such a model to observed data can be examined in a number of ways (Byrne, 1998). Although the most commonly suggested fit statistic in structural
equation modelling is thex2statistic, with a non-significant value indicating a good fit
of the model to the data, the adequacy of this statistic is unknown (Huet al., 1992). For
example, the failure to obtain a non-significantx2may reflect a poorly specified model,
the power of the statistical test, or a failure to satisfy assumptions underlying it (Marsh, 1994). In an effort to overcome those limitations, other fit statistics were also used. They included the root mean square residual (RMR) and the root mean square error of approximation (RMSEA). The RMR is a summary of the average of residual variances and covariances, with values of 0.05 and below. It is generally suggested as evidence of a good fit (Byrne, 1998), though Kline (1998) has suggested that a value of less than 0.10 is acceptable. The RMSEA statistic provides an estimate of how well the model with the parameter values derived from the sample could be expected to fit the population covariance matrix (Browne and Cudeck, 1993). Values of less than 0.05 indicate a good fit, while those up to 0.08 indicate reasonable fit and results between 0.08 and 0.10 indicate mediocre fit. These statistical tests were all applied in the study. CFA was used to examine the discriminant validity of the latent variables by testing competing factor structures. As part of the analysis, the fit of a series of hierarchical nested models was compared for relative goodness-of-fit (Byrne, 1998), beginning with the null model, which assumes each item loads on to a separate latent variable. The next model assumed that all items loaded on a single factor, while the last model assumed items loaded on their respective latent variables. The improvement in fit was
indicated by the change in thex2, relative to the change in the number of degrees of
freedom. Once baseline models were identified, and measures validated, reliability was assessed through Cronbach’s (1951).
Results for the measurement models – fit statistics
Before running the analyses, the existing scales were examined for possibly redundant items. The measurement properties and the model fit of the subsequent one-factor congeneric models are shown in Table I. The indices suggested that the sub-scales fitted the data reasonably well, pointing to the validity of each in terms of measuring what they purport to measure (Nunnally and Bernstein, 1994). The results also suggest that the factor structures of the scales are good indicators of the extent to which
observed measures relate to the same thing: the latent variable, in this case. The a
reliabilities shown in Table I vary from 0.76 to 0.90, and the average variance extracted (AVE) from 0.58 to 0.85, both ranges being above the established standard for