Concentration of Selected Radionuclides in Sediment and Surface Seawater
in Belitung Island, Indonesia
Murdahayu Makmur, Mohamad Nur Yahya and Deddy Irawan Permana Putra
Center for Technology of Radiation Safety and Metrology,National Nuclear Energy Agency of Indonesia Jl. Lebak Bulus Raya No. 49 Jakarta Selatan, 12440 Indonesia, E-mail:[email protected]
Abstract.Global fallout radionuclides were injected into the oceansmainly in the late 1950s and early 1960s, after large-scale atmospheric nuclear weapons tests were carried out. The highest deposition occurred in the mid-latitudes of the western North Pacific Ocean and Western North Atlantic Ocean. The global sea water exchange between the different oceans plays an important role in the movement mass, heat and other substances include anthropogenic matters. As a part of the Indonesian maritime continent, Karimata Strait where the Belitung Islands lied, plays an important role as a transfer matters of the oceanic conjunction between Pacific and Indian Ocean. No baseline existed for the radionuclides in Belitung Island, where the baseline study is imperative to create a reference and to record the influence functioning of upcoming power plants. The present baseline concentration of the considered radionuclide’s show low concentration of cesium and plutonium in sediment and surface seawater and their concentration is comparable to most oceanic waters.
Keyword:Plutonium, cesium, baseline data, Belitung Island, Karimata Strait
Introduction
Plutonium and cesium in the Pacific Ocean has originated mostly from global fallout from large atmospheric nuclear weapons tests, from which the major oceanic input occurred in the early 1960s. There are two principal sources of 137Cs, 239Pu and
240
Pu, that is global stratospheric fallout and close-in fall out from the North Pacific Proving Grounds (NPPG) in the Marshall Islands. (Hirose et al., 2006), (Yamada et al., 2006). Besides that, pluto-nium isotopes normally produced in reactor fuel as a mixture of isotopes. The predominant isotope,239Pu is produced by neutron capture in 238U. If a fuel element containing239Pu is left in a reactor for any length of time further neutron capture can occur to yield higher isotopes like240Pu, 241Pu and 242Pu. In addition, small quantities of two other isotopes,236Pu and238Pu, are produced during the irradiation (Zheng & Aono, 2012).
Plutonium in the ocean is transported by physical and bio geochemical processes. The residence time of plutonium in surface waters of the open ocean ranges from 6 to 21 years, and is generally shorter than that of 137Cs. In contrast to
137
Cs, plutonium is a typical particle-reactive radionuclide; plutonium in particulate matter of surface waters occupies from 1% to 10%, whereas particulate 137Cs is less than 0.1% of the total. Plutonium vertically moves with sinking biogenic particles and regenerates into soluble forms in deep waters as a result of microbial decomposition of particles (Hirose et al., 2006).
Average 137Cs activities, 239,240Pu activities in the surface waters of the western North Pacific are 2.70+0.25 Bq/m3 and 1.65+0.12 Bq/m3(Yamada et al., 2006).137Cs levels in surface seawater have been declining to its present median value of about 3 Bq/m3.239,240Pu levels in surface seawater are much lower, with a median of about 6 mBq/m3. 239,240Pu
appears to be partly scavenged by particles and is therefore more readily transported down the water column. As with seawater, 239,240Pu concentrations are lower than137Cs in surface sediment. The median
137
Cs concentration in surface sediment is 1.4 Bq/kg dry, while that of 239,240Pu is only 0.2 Bq/kg dry (Duran et al., 2004).
The Indonesian Through Flow (ITF) is the connection between two oceanic basins in the tropical region, Pacific Ocean and Indian Ocean. There are three Indonesian Through Flow (ITF) branches: the flow through the Makassar Strait; through the South China Sea; and through the eastern Indonesian basins (Du & Qu, 2010). In the South China Sea, the water exchanged between the Pacific Ocean and South China Sea within the depth range of the thermocline, later observations revealed that there is a Kuroshio branch toward the South China Sea both winter and summer and the intrusion of the North Pacific Tropical Water seems to occur during most. The South China Sea connects in the south with the Sulu and Java Seas through the Shallow Mindoro (-200 m) and Karimata (50m) straits dan in the north with East China Sea through the shallow Taiwan Strait (<100m) and with the Pacific Ocean through the deep Luzon Strait (>2000m) (Qu et al., 2009).
The work reported here will present the
239,240
Pu and 137Cs activity at Belitung Sea in Sediment and surface seawater that lied in the Karimata Strait in connection with South China Sea, as a baseline data before the first Indonesia NPP built in Bangka Belitung Province.
Material and Methods
Sediment and Sea Water Sample Collection
Sampling Location
The locations of the sampling sites are shown in Fig. 1. Belitung Island, located in Bangka Belitung Province, is an island lied in the Karimata Strait. The Belitung sea is well suited to study and characterize the Cesium and Plutonium, can be representative the anthropogenic input from South China sea through the Secondary ITF (Indonesian Through Flow).
Sediment Sample Collection
Sediment sample was collected around Belitung Island in February 2015, using the sediment corer. Surface water sample (80 l) were collected around the Belitung Sea and pre-concentration processes are required for analysis of anthropogenic radionuclides in seawater due to extremely low concentration.
Preconcentration of cesium from seawater and sediment
All sediment sample were oven dried, then 1 kg placed in marinally to direct count by gamma spectrometer. Preconcentration for cesium, using copper nitrate salt and potassium hexacyanoferrates precipitation, before separated from seawater, and dried before placing in the PVC container. The cesium preconcentration was conducted according procedure described by Wo and Ahmad study. (Wo & Ahmad, 2004).
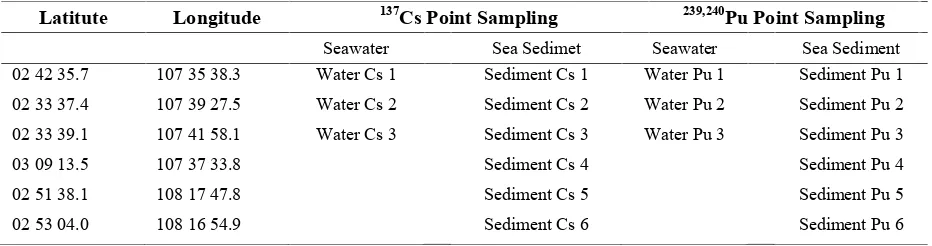
Fig. 1. Map showing the sediment and surface sea water sampling location in the Belitung Sea, Bangka Belitung Province, Indonesia. The coordinate of the sampling point could be seen in the Table 1.
Tabel 1. Coordinate of sampling point in the coast of Belitung Island
Latitute Longitude 137Cs Point Sampling 239,240Pu Point Sampling
Seawater Sea Sedimet Seawater Sea Sediment
02 42 35.7 107 35 38.3 Water Cs 1 Sediment Cs 1 Water Pu 1 Sediment Pu 1
02 33 37.4 107 39 27.5 Water Cs 2 Sediment Cs 2 Water Pu 2 Sediment Pu 2
02 33 39.1 107 41 58.1 Water Cs 3 Sediment Cs 3 Water Pu 3 Sediment Pu 3
03 09 13.5 107 37 33.8 Sediment Cs 4 Sediment Pu 4
02 51 38.1 108 17 47.8 Sediment Cs 5 Sediment Pu 5
Preparation plutonium from sea seawater and sediment
For plutonium, a few gram were heated in a furnace at 550oC for 6 hours to decompose the organic matter sediment samples were digested using micro-wave digestion (Milestone Start D). After digestion, the liquid sample would go to Plutonium separation by anion exchange and column chromatography section. The preconcentration from 80 l seawater using permanganate and manganese chlorida described by levy (Levy et al., 2011).
Measurement cesium with gamma spectrometer and plutonium with alpha spectrometer
Cesium (137Cs) was measured using gamma spectrometer Canberra type GX 2018, Canberra type GC 2020 and Ortex type GMX 25P4-76, completed with HPGe Detector with counting efficiencies of 20–25% (relative to NaI(Tl) detector). The counting time for each sample was 172.800-259.200s. Pluto-nium was counted by alpha analyst consisted of 8 vacuum chambers with solid-state detectors, a pulse height analyzer and a computer system with counting efficiency of 18-23%). The contents of 239,240
Pu were deduced from the countrates of plutonium isotopes, including a yield tracer of242Pu, as measured by alpha spectrometry. Because the energies of alpha rays from239Pu and 240Pu are too close to be distinguished from one another, we determined the sum of activities239,240Pu. (Kinoshita et al., 2011).
Result and Discussion
Surface Sea Water
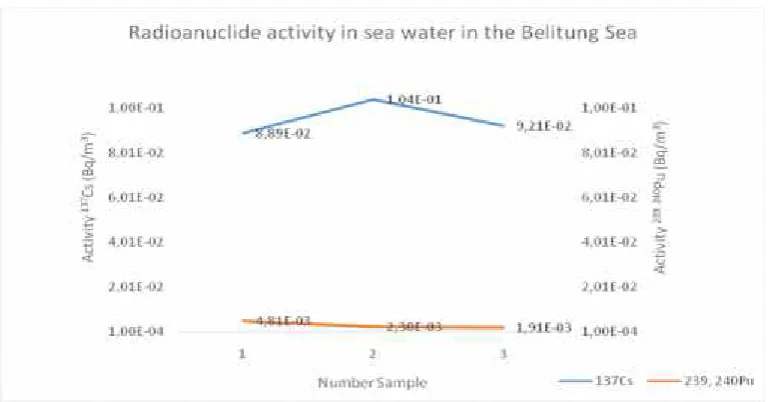
The activity concentrations of cesium (137Cs) and plutonium (239,240Pu) radionuclides, in surface water Belitung Sea are presented in Figure 2. Activity137Cs and239,240Pu in the surface seawater in Belitung Sea were 9.5E-02±7.16E-3 Bq/m3 and 3.01E-3±8.1E-4Bq/m3 respectively. In the figure 2 could be seen, that the activity 137Cs higher than 239,240
Pu. Generally, the activity 137Cs in seawater higher than 239,240Pu because plutonium vertically moves with sinking biogenic particles and regenerates into soluble forms in deep waters as a result of microbial decomposition of particles (Hirose et al., 2006).
In monitoring 137Cs in sediment and sea water in the Indonesia Sea in 2011-2013 reported that on the western coasts of West Sumatra, Bangka Island, North Java, South Java and Madura Island, the137Cs concentrations in the seawater were 0.12±0.66 Bq/m3. In the along coast of the Bangka Island, the activity of 137Cs in the sea water were 0.31±0.03 Bq/m3 in 2011 and 0,26±0.02 Bq/m3 in 2013 (Suseno & Prihatiningsih, 2014). No significant different value between these data from Bangka Sea (1050–1060) and Belitung Sea (1070), because no radioactive input from these island.
In the other paper, (Suseno & Budi, 2015) report that the activity concentration of 137Cs in the surface seawater of the South Java Sea ranged from below MDA to 0.13 Bq/m3. On the other hand, the activity concentration of 137Cs in the surface seawater of the West Sumatra Sea ranged from below MDA to 0.28 Bq/m3. The concentration of this study was comparable with the concentration data from South Java and West Sumatera Sea.
The study that performance by the other (Wo & Pacific, activity of137Cs in the surface sea water are 2.70+0.25 Bq/m3, in the Sulu and Indonesian seas are eastern Indian Ocean are 2.42+0.12 Bq/m3. Otherwise, in the South China Sea are 2.70+0.11 Bq/m3. (Yamada et al., 2006).
Data concentration of137Cs in the surface water of the northwest Pacific after the Fukushima nuclear accident at 2011 around 826 mBq/l (Yu et al., 2015). The Fukushima accident also add the value of the anthropogenic matter to the environment and according TEPCO, estimated published in May 2012, the release 137Cs into atmosphere about 10 pBq. Radionuclides released into atmosphere are subjected to a variety of physical processes that determine their eventual fate,137Cs can rapidly bond to aerosol id is thus highly subject to washout removal (scavenging) by rain from contaminated air masses. In the Asia, the air mass from Fukushima was detected in the Philippines (0.48 mBq/m3), Vietnam (0.03 mBq/m3), South Korea (1,25 mBq/m3), Taiwan (1,44 mBq/m3) and China (1,55 mBq/m3), and no data from Indonesia (Thakur et al., 2013).
Pu from this research about 3.01E-3±8.1E-4 Bq/m3, if we compare, it is found that the239,240Pu in the Belitung sea lower than western North Pacific, the Sulu and Indonesia Sea and also from South China Sea. In ASPAMARD data compilation for Pacific Ocean, activity 239,240Pu in surface seawater ranged from 0.8 to 84.3 mBq/m3 with a median of
5.9 mBq/m3 (n=261). However, about 92% of the data were between the range of 0.8–14 mBq/m3only (Duran et al., 2004).
Sea Sediment
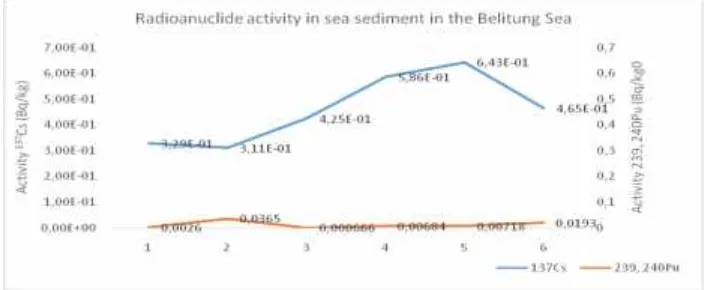
The Activity of 137Cs and 239,240Pu in the sea sediment around the Belitung Island range from 3.11E-01±3.36E-02 Bq/kg to 6.43E-01±6.57E-02 Bq/kg and 6.66E-04±2.52E-04Bq/kg to 3.65E-02±1,62E-02Bq/kg respectively, are show in the Figure 3.
In the ASPAMARD, 137Cs concentrations was observed in surface sediment (0-2 cm) collected from areas in the Northern Hemisphere ranged from 0.08 to 23.4 Bq/kg dry, with a median concentration of 1.4 Bq/kg dry (n=86). The highest137Cs levels in surface sediment were observed in the East Sea/Sea of Japan within the 35oto 40oN band. The239,240Pu concentra-tions in surface sediment (0-2 cm) ranged from 0.02 to 3.7 Bq/kg dry with a median of 0.2 Bq/kg dry (n = 30). (Duran et al., 2004).
Activity Ratio239,240Pu/137Cs in Seawater and Sedimen at Belitung Sea
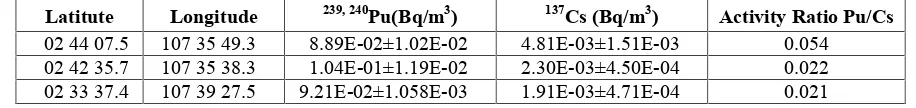
The activity ratio 239,240Pu/137Cs indicate the source of the anthropogenic radionuclide measured in some place. The activity ratio of 239,240Pu/137Cs in sea water at Belitung Sea are shown at Table 2.
The activity ratio239,240Pu/137Cs from this study were 0.021–0.054 are significantly near by the ratio predicted from the atmospheric fallout of 0.025 however lower than the mean global fallout ratio of 0.176±0.014. (Yamada et al., 2006). Its mean that, the anthropogenic sources in Belitung sea come from global fallout. The ratio from this study also lower than the atom ratios in the surface waters of the western North Pacific Ocean and its adjacent seas range from 0.199±0.026 to 0.248±0.027. (Yamada et al., 2006).
Tabel 2. Activity Ratio of 239, 240Pu/137Cs in the Surface Seawater in Belitung Sea
Latitute Longitude 239, 240Pu(Bq/m3) 137Cs (Bq/m3) Activity Ratio Pu/Cs 02 44 07.5 107 35 49.3 8.89E-02±1.02E-02 4.81E-03±1.51E-03 0.054 02 42 35.7 107 35 38.3 1.04E-01±1.19E-02 2.30E-03±4.50E-04 0.022 02 33 37.4 107 39 27.5 9.21E-02±1.058E-03 1.91E-03±4.71E-04 0.021
Summary
The present baseline concentration of the considered radionuclide’s show low concentration of cesium and plutonium in sediment and surface seawater and their concentration is comparable to most oceanic waters. The activity137Cs and 239,240Pu in the surface seawater in Belitung Sea were 9.5E-02±7.16E-3 Bq/m3 and 3.01E-3±8.1E-4 Bq/m3 respectively and in the sea sediment were s and 239,240
Pu in the sea sediment around the Belitung Island range from 3.11E-01±3.36E-02 Bq/kg to 6.43E-01±6.57E-02 Bq/ kg and 6.66E-04±2.52E-04 Bq/kg to 3.65E-02± 1,62E-02 Bq/kg respectively. This value is lower than the ASPAMARD data from Pacific Ocean. The activity ratio239,240Pu/137Cs from this study were 0.021-0.054 are significantly near by the ratio predicted from the atmospheric fallout of 0.025 however lower than the mean global fallout ratio, its mean that, the anthropogenic sources in Belitung sea come from global allout.
Acknowledge
This work was supported by the DIPA PTKMR BATAN, and many thanks for marine radioecology group have been supported this research in sampling, did the laboratory work and measurement.
References
Du, Y., & Qu, T. (2010). Three in flow pathways of the Indonesian through flow as seen from the simple ocean data assimilation. Dynamics of
Atmospheres and Oceans, 50(2), 233–256.
http://doi.org/10.1016/j.dynatmoce.2010.04.001. Duran, E. B., Povinec, P. P., Fowler, S. W., & Airey,
P. L. (2004). Pu levels in the Asia-Pacific regional seas. Journal of Environmental
Radio-activity, 76, 139–160. http://doi.org/10.1016
/j.jenvrad. 2004.03.023.
Hirose, K., Aoyama, M., Kim, C. S., Kim, C. K., & Povinec, P. P. (2006). Plutonium isotopes in seawater of the North Pacific : Effects of close-in
fallout. Radionuclides in the Environment:
International Conference on Isotopes in
Environ-mental Studies (Vol. 8). Elsevier Masson SAS.
http://doi.org/10.1016/S1569-4860(05) 08005-8.
J. Zheng, T. Aono, S. U. et al. (2012). Distribution of Pu Isotopes in Marine Sediments in the Pacific 30 km off Fukushima after the Fukushima Daiichi Nuclear Power Plant Accident.
Geochemical,46, 361–369.
Kinoshita, N., Sumi, T., Takimoto, K., Nagaoka, M., Yokoyama, A., & Nakanishi, T. (2011). Science of the Total Environment Anthropogenic Pu distribution in Tropical East Pacific. Science of
the Total Environment, The, 409, 1889–1899.
http://doi.org/10.1016/j. scitotenv.2011.01.047 Levy, I., Povinec, P. P., Aoyama, M., Hirose, K.,
Sanchez-cabeza, J. A., Comanducci, J., … Yim, S. A. (2011). Marine anthropogenic radiotracers in the Southern Hemisphere : New sampling and analytical strategies. Progress in Oceanography, 89, 120–133. http://doi.org/ 10.1016/j.pocean. 2010. 12.012.
Qu, T., Song, Y. T., & Yamagata, T. (2009). An introduction to the South China Sea through-flow : Its dynamics, variability, and applica-tion for climate. Dynamics of Atmospheres and
Oceans, 47, 3–14. http://doi.org/10.1016/
j.dynatmoce.2008.05.001
Suseno, H., & Budi, I. (2015). Radiocesium monitor-ing in Indonesian waters of the Indian Ocean after the Fukushima nuclear accident. Marine
Pollution Bulletin, 97(1-2), 539–543. http://
doi.org/10.1016/j.marpolbul. 2015.05.015. Suseno, H., & Prihatiningsih, W. R. (2014).
Monitoring and 2013 Cs at marine coasts in Indonesia between 2011. Marine Pollution
Bulletin,88, 319–324.
Thakur, P., Ballard, S., & Nelson, R. (2013). Science of the Total Environment An over-view of Fukushima radionuclides measured in the northern hemisphere. Science of the Total
Environment, The, 458-460, 577–613.
http://doi.org/10.1016/j.scitotenv.2013.03. 105. Wo, Y. M., & Ahmad, Z. (2004). Determination of
137
Cs in Seawater Surrounding Peninsular Malaysia Case Study. Journal of Nuclear and
Related Technologies,1(2), 19–28.
Yamada, M., Zheng, J., & Wang, Z. (2006).137Cs , 239,240
Pu and atom ratios in the surface waters of the western North Pacific Ocean, eastern Indian Ocean and their adjacent seas. Science of the
Total Environment, The, 366, 242–252.
Yu, W., He, J., Lin, W., Li, Y., Men, W., Wang, F., & Huang, J. (2015). Distribution and risk assessment of radionuclides released by Fuku-shima nuclear accident at the northwest Pacific.
Journal of Environmental Radioactivity,142, 54–
61. http://doi.org/10.1016/j.jenvrad. 2015. 01.005.
Discussion
Q : Andreas Belhofer
How far is Belitung Island from the location of planned Power Plant ?
A : Murdahayu
It is not so far (it is about< 100 km)
Q : Stephen Solomon
Regarding the result of activity, I found that error looks very high, it is a mistake in typing the numerical result ?
A : Murdahayu
It is a miss type, I will make a correct typing in the revision paper, Thank for the correction.
Q : Gede S.Wijaya
Did you use a tracer to check the recovery process of Pu measurement? And how much is that recovery.
A : Murdahayu