BACHELOR THESIS & COLLOQUIUM – ME141502
A STUDY OF LNG DISTRIBUTION DESIGN BY CONSIDERING
TRANSSHIPMENT MODEL FOR EASTERN PART OF INDONESIA
MUHAMMAD SATRIO NURRAHMAN
NRP. 04211441000028
SUPERVISOR :
A.A.B. Dinariyana D.P. S.T., MES, Ph.D.
Prof. Dr. Ketut Buda Artana, S.T., M.Sc.
DOUBLE DEGREE PROGRAM IN
DEPARTMENT OF MARINE ENGINEERING
FACULTY OF MARINE TECHNOLOGY
INSTITUT TEKNOLOGI SEPULUH NOPEMBER
SURABAYA
i
BACHELOR THESIS & COLLOQUIUM – ME 141502
A STUDY OF LNG DISTRIBUTION DESIGN BY CONSIDERING
TRANSSHIPMENT MODEL FOR EASTERN PART OF INDONESIA
Muhammad Satrio Nurrahman
NRP. 0421141000028
SUPERVISOR :
A.A.B. Dinariyana D.P. S.T., MES, Ph.D.
Prof. Dr. Ketut Buda Artana, S.T., M.Sc.
DOUBLE DEGREE PROGRAM IN
DEPARTMENT OF MARINE ENGINEERING
FACULTY OF MARINE TECHNOLOGY
INSTITUT TEKNOLOGI SEPULUH NOPEMBER
SURABAYA
iii
SKRIPSI – ME 141502
STUDI
TENTANG
DESAIN
DISTRIBUSI
LNG
DENGAN
MEMPERTIMBANGKAN
MODEL
TRANSSHIPMENT
UNTUK
WILAYAH TIMUR INDONESIA
Muhammad Satrio Nurrahman
NRP. 04211441000028
DOSEN PEMBIMBING :
A.A.B. Dinariyana D.P. S.T., MES, Ph.D.
Prof. Dr. Ketut Buda Artana, S.T., M.Sc.
PROGRAM GELAR GANDA
DEPARTEMEN TEKNIK SISTEM PERKAPALAN
FAKULTAS TEKNOLOGI KELAUTAN
INSTITUT TEKNOLOGI SEPULUH NOPEMBER
SURABAYA
v
APPROVAL FORM
A STUDY OF LNG DISTRIBUTION DESIGN BY CONSIDERING TRANSSHIPMENT MODEL FOR EASTERN PART OF INDONESIA
BACHELOR THESIS & COLLOQUIUM
Submitted to comply one of the requirements obtaining Bachelor Degree Engineering at
Reliability, Availability, Management and Safety (RAMS) Laboratory Double Degree Program in Department of Marine Engineering
Faculty of Marine Technology Institut Teknologi Sepuluh Nopember
Prepared by:
MUHAMMAD SATRIO NURRAHMAN NRP. 04211441000028
Approved by Supervisor of Bachelor Thesis & Colloquium:
A.A.B. Dinariyana D.P. S.T., MES, Ph.D. ( )
vii
APPROVAL FORM
A STUDY OF LNG DISTRIBUTION DESIGN BY CONSIDERING TRANSSHIPMENT MODEL FOR EASTERN PART OF INDONESIA
BACHELOR THESIS & COLLOQUIUM
Submitted to comply one of the requirements of obtaining Bachelor Degree Engineering at
Reliability, Availability, Management and Safety (RAMS) Laboratory Double Degree Program in Department of Marine Engineering
Faculty of Marine Technology Institut Teknologi Sepuluh Nopember
Prepared by:
MUHAMMAD SATRIO NURRAHMAN NRP. 04211441000028
Approved by
Head of Marine Engineering Department FTK-ITS
Dr. Eng Muhammad Badrus Zaman, S.T., M.T. NIP. 197708022008011007
ix
APPROVAL FORM
A STUDY OF LNG DISTRIBUTION DESIGN BY CONSIDERING TRANSSHIPMENT MODEL FOR EASTERN PART OF INDONESIA
BACHELOR THESIS & COLLOQUIUM
Submitted to comply one of the requirements of obtaining Bachelor Degree Engineering at
Reliability, Availability, Management and Safety (RAMS) Laboratory Double Degree Program in Department of Marine Engineering
Faculty of Marine Technology Sepuluh Nopember Institute of Technology
Prepared by:
MUHAMMAD SATRIO NURRAHMAN NRP. 04211441000028
Approved by
Representative of Hochschule Wismar in Indonesia
xi
DECLARATION OF HONOR
I hereby who signed below declare that :
This bachelor thesis has written and developed independently without any plagiarism act, and confirm consciously that all data, concepts, design, references, and material in this report own by Reliability, Availability, Management and Safety (RAMS) in Department of Marine Engineering ITS which are the product of research study and reserve the right to use for further research study and its development.
Name : Muhammad Satrio Nurrahman
NRP : 04211441000028
Bachelor Thesis Title : A Study of LNG Distribution Design by Considering Transshipment Model for Eastern Part of Indonesia
Department : Marine Engineering
If there is plagiarism act in the future, I will fully responsible and receive the penalty given by ITS according to the regulation applied.
Surabaya, 30 July 2018
xiii
A STUDY OF LNG DISTRIBUTION DESIGN BY CONSIDERING TRANSSHIPMENT MODEL FOR EASTERN PART OF INDONESIA
Name : Muhammad Satrio Nurrahman
NRP : 04211441000028
Supervisor 1 : A.A.B. Dinariyana D.P. S.T., MES, Ph.D. Supervisor 2 : Prof. Dr. Ketut Buda Artana, S.T., M.Sc.
ABSTRACT
Indonesia is one of the largest archipelago country that the usage of sea transportation is one of the most effective transportation method to distribute energy for power plant. The presence of electrical energy in Indonesia is still not provided due to the limited of the facilities and the distribution of the electrical energy sources. LNG supply chain is needed to distribute LNG to fulfill the demand in the area that have been planned by PLN for power plants. The LNG carrier can reach the requests of the little islands, so it turn out to be more compelling choice for the supply chain. This thesis will design transshipment model scenario of LNG distribution in eastern part of Indonesia and it will be simulated using discrete-event simulation. There will be some of scenario that create in Papua and West Papua regions. The purpose of this thesis is to know the transshipment modelling scenario in discrete-event simulation, to identify variables that affects modelling of supply chain scenario and to find feasible supply chain technically. The chosen methods for this thesis are literature review and collecting data that is done by reviewing on the internet about discrete-event simulation and the project data. The data is processed by using ARENA DES-Software which will be known the simulation of some model and scenario that considered and determined, then will know the feasible scenario and model.
Based on the results of this thesis, there are 2 models of distribution by considering transshipment model. The first model is using 1 transshipment point in Sorong area and the second model is using 2 transshipment points in Sorong and Jayapura area. Each model will have 8 scenarios based on the size of receiving terminal tank capacity and combination of fleet. Each variation of receiving terminal tank capacity will have 2 fleet combination and each fleet combination will follow with the level of inventory to transporting LNG. The scenarios and models that have been designed still have an inaccuracy when running the simulation to make the results achieved is not maximal but still exist in some locations in the LNG supply chain that runs out of LNG as fuel. In the distribution design, for the first model scenario 6, 7 and 8 is the recommended scenario that determining the tank capacity variation with 7 days for safety stock. However, in the second model, scenario 5, 6, 7 and 8 is the recommended scenario with tank capacity variation also including 7 days for safety stock. The recommended scenarios will use LNG vessel with the 7500 m3, 12000 m3 and 23000 m3 capacity. The fleet combination is considered with difference number of vessel. For the same tank capacity variation and same fleet combination will be divided into two scenarios that considered based on the inventory level to make a signal to transporting LNG for
the fleet. The consideration of inventory level is 50% and 60% of the LNG inside the inventory.
xv
STUDI TENTANG DESAIN DISTRIBUSI LNG DENGAN
MEMPERTIMBANGKAN MODEL TRANSSHIPMENT UNTUK WILAYAH TIMUR INDONESIA
Nama : Muhammad Satrio Nurrahman
NRP : 04211441000028
Dosen Pembimbing 1 : A.A.B. Dinariyana D.P. S.T., MES, Ph.D. Dosen Pembimbing 2 : Prof. Dr. Ketut Buda Artana, S.T., M.Sc.
ABSTRAK
Indonesia merupakan negara kepulauan yang terbesar sehingga membuat penggunaan transportasi laut menjadi metode transportasi yang paling efektif untuk mendistribusi energi ke pembangkit. Kehadiran energi listrik di Indonesia masih tidak tersedia dikarenakan fasilitas dan distribusi sumber energi listrik yang terbatas. Rantai pasok LNG dibutuhkan untuk mendistribusi LNG guna memenuhi kebutuhan di wilayah yang telah direncanakan oleh PLN sebagai pembangkit. Kapal pengangkut LNG dapat menggapai permintaan di pulau-pulau kecil, sehingga menjadikan pilihan yang tepat untuk merancang rantai pasok. Tugas akhir ini akan mendesain model
transshipment scenario mengenai distribusi di wilayah timur Indonesia dan akan
disimulasikan. Akan dirancang beberapa skenario di Papua dan Papua Barat. Tujuan dari tugas akhir ini untuk mengetahui skenario model transshipment di dalam diskrit event simulasi, untuk mencari tahu variabel yang memengaruhi model dari skenario rantai pasok dan mencari rantai pasok yang layak secara teknis. Metode yang digunakan untuk tugas akhir ini adalah dengan studi literature dan mengumpulkan data yang dapat diatasi dengan mengulang dari internet tentang simulasi diskrit event dan data proyek. Data diolah dengan menggunakan software ARENA yang akan mengetahui simulasi beberapa model dan skenario yang sudah ditentukan, lalu akan terlihat skenario dan model yang layak.
Berdasarkan hasil tesis ini, ada 2 model distribusi dengan mempertimbangkan model
transshipment-nya. Model pertama menggunakan 1 titik transshipment di daerah
Sorong dan model kedua menggunakan 2 titik transshipment di daerah Sorong dan Jayapura. Setiap model akan memiliki 8 skenario berdasarkan ukuran kapasitas tangki terminal penerima dan adanya kombinasi armada. Setiap variasi kapasitas tangki terminal penerima akan memiliki 2 kombinasi armada dan setiap kombinasi armada akan mengikuti jumlah persediaan sebagai sinyal untuk mengangkut LNG. Skenario dan model yang telah dirancang masih memiliki ketidaktepatan saat menjalankan simulasi untuk membuat hasil yang dicapai tidak maksimal tetapi masih ada di beberapa lokasi dalam rantai pasokan LNG yang kehabisan LNG sebagai bahan bakar. Dalam desain distribusi ini, untuk model pertama skenario 6, 7 dan 8 adalah skenario yang direkomendasikan dengan menentukan variasi kapasitas tangki sebanyak 7 hari untuk safety stock. Namun, dalam model kedua, skenario 5, 6, 7 dan 8 adalah skenario yang direkomendasikan dengan variasi kapasitas tangki juga sebanyak 7 hari untuk safety stock. Skenario yang direkomendasikan akan menggunakan kapal LNG dengan kapasitas 7500 m3, 12000 m3 dan 23000 m3.
Kombinasi armada ditentukan dengan perbedaan jumlah kapal untuk mengangkut LNG tiap variasi. Untuk variasi kapasitas tangki yang sama dan kombinasi armada yang sama akan dibagi menjadi dua skenario yang dipertimbangkan berdasarkan tingkat persediaan dalam memberikan sinyal untuk mengangkut LNG. Pertimbangan tingkat persediaan adalah 50% dan 60% di dalam persediaan.
Kata Kunci: LNG, Kapal Pengangkut LNG, Rantai Pasok, Model Transshipment, Simulasi
xvii
PREFACE
Praise to Allah SWT who has given grace and hidayah to the author, so the author can finish this thesis with the title “A Study of LNG Distribution Design by Considering Transshipment Model for Eastern Part of Indonesia” on time in order to comply the requirement of obtaining a Bachelor Degree Engineering on Department of Marine Engineering, Faculty of Marine Technology, Sepuluh Nopember Institute of Technology.
The author realizes that this writing can’t be solved without the support of various parties both morally and materially. Therefore, the authors would like to express their gratitude to all those who have helped in the preparation of this bachelor thesis especially to:
1. Both parents, an honored my father Dony Noerwahjono, my beloved mother Yuniarti Nugrohorini, my lovely brother and sister Muhammad Nur Pratama and Sabrina Nuraulia Putri who have given moral and material support to the author.
2. Dr. Eng. Muhammad Badrus Zaman., ST., MT. as Head of Marine Engineering Department, Faculty of Marine Technology ITS.
3. Mr. Indra Ranu Kusuma, ST., M.Sc. as a lecture advisor since first semester until eighth semester who giving a lot advice and help for the author. 4. A.A.B. Dinariyana D.P., S.T., MES, Ph.D. and Prof. Dr. Ketut Buda Artana,
S.T., M.Sc. as supervisors in this research.
5. Dr. Dhimas Widhi Handani, S.T., M.Sc. and Raja Oloan Saut Gurning, S.T., M.Sc., Ph.D. as the lecturer in RAMS Laboratory.
6. Deborah Krisnensia Candra who giving a support for the author from the beginning of bachelor thesis until the end.
7. Wiwit Marta for guiding and teaching the author to use ARENA Software. 8. Nyimas Safira Amalia S.T., B.Eng. who have given moral support and share
her knowledges to the author.
9. Aditya Rizal Suswiwantoro for accompanying to done the bachelor thesis along the process of writing bachelor thesis.
10. All member of Reliability, Availability, Management and Safety (RAMS) Laboratory for the support and knowledges.
11. All of friends in Double Degree Marine Engineering ITS-Hochschule Wismar batch 2014 for all the support, memories and knowledges.
12. All of friends in MERCUSUAR’14 for the support, memories and knowledges from first semester until eighth semester.
13. All civitas academic in Department of Marine Engineering, Faculty of Marine Technology, Sepuluh Nopember Institute of Technology who giving a lot of knowledge and great times to the author.
14. Great amounts of friends that can’t be mentioned, for their support, help and knowledges for this thesis.
The author realizes that this bachelor thesis remains far away from the perfect form. Therefore, every construction suggestion and idea from all parties are highly expected by author for this bachelor thesis correction and improvement in the future.
Finally, may Allah SWT bestow His grace, Hidayah, Contentment and blessing to all of us. Hopefully this bachelor thesis can have an advantageous for all of us especially for the readers.
Surabaya, 30 July 2018
xix
TABLE OF CONTENTS DECLARATION OF HONOR ... xi ABSTRACT ... xiii ABSTRAK ... xv PREFACE ... xviiTABLE OF CONTENTS ... xix
LIST OF TABLES ... xxi
LIST OF FIGURES ... xxiii
CHAPTER I ... 1 1.1. Background ... 1 1.2. Statement of Problems ... 3 1.3. Constraints ... 3 1.4. Research Objectives ... 3 1.5. Research Benefits ... 3 CHAPTER II ... 5 2.1. LNG Basic Concept ... 5 2.2. LNG Supply Chain ... 6 2.2.1. Gas Reserves ... 7 2.2.2. LNG Carrier ... 8
2.2.3. Barge Container Skid ... 9
2.2.4. LNG Hub Storage ... 10
2.2.5. Receiving Terminal ... 10
2.3. Power Plant in Papua ... 11
2.3.1. Papua Province ... 11
2.3.2. West Papua Province ... 13
2.4. System ... 15
2.5. Transshipment Model ... 16
2.6. Simulation ... 17
2.7. ARENA DES-Software... 18
CHAPTER III ... 23
3.1. Methodology Flow Chart ... 23
3.2.1. Determining Problem ... 24 3.2.2. Literature Study... 24 3.2.3. Collecting Data ... 24 3.2.4. Demand and Supply Data Analyzing ... 24 3.2.5. Generate Route Model ... 24 3.2.6. Consider Scenario ... 25 3.2.7. Discrete-Event Simulation ... 25 3.2.8. Conclusion & Suggestion ... 25 CHAPTER IV ... 27 4.1. Data Analyzing ... 27 4.1.1. Power Plants Identification ... 27 4.1.2. Fleet Identification ... 30 4.2. Generate Distance Matrix ... 31 4.3. Simulation LNG Distribution... 31 4.3.1. Voyage ... 32 4.3.2. Receiving Terminal ... 34 4.3.3. LNG Distribution Route Simulation ... 35 CHAPTER V ... 45 5.1. Conclusion ... 45 5.2. Suggestion ... 46 REFERENCES ... 47 ATTACHMENT 1 ... 49 ATTACHMENT 2 ... 51 ATTACHMENT 3 ... 53 AUTHOR BIOGRAPHY ... 59
xxi
LIST OF TABLES
Table 1.1 Natural Gas Reserves (per January) Database ... 1 Table 1.2 Electricity Power Projection in Papua ... 2 Table 1.3 Electricity Power Projection in West Papua ... 2 Table 2.1 Power Plant Development Planning List ... 13 Table 2.2 Power Plant Development Planning List ... 15 Table 4.1 Power Plants Gas Fueled in Eastern Part of Indonesia ... 27 Table 4.2 Power Plants Gas Fueled in Eastern Part of Indonesia (Continued) ... 28 Table 4.3 LNG Demand Calculation ... 29 Table 4.4 Ship Particular ... 31 Table 4.5 Round Trip Sail Duration Model 1 Calculation ... 33 Table 4.6 Round Trip Sail Duration Model 2 Calculation ... 34 Table 4.7 Scenario Consideration ... 42 Table 4.8 Model 1 Simulation Results ... 43 Table 4.9 Model 1 Simulation Results (continued) ... 43 Table 4.10 Model 2 Simulation Results ... 43 Table 4.11 Model 2 Simulation Results (continued) ... 44
xxiii
LIST OF FIGURES
Figure 2.1 LNG Supply Chain ... 7 Figure 2.2 Indonesia Natural Gas Reserves ... 7 Figure 2.3 Small LNG Vessel ... 8 Figure 2.4 LNG Shuttle / Bunker Barge) ... 10 Figure 2.5 Development Planning Map Interconnection System 70 kV and 150 kV
Jayapura ... 12 Figure 2.6 Development Planning Map Interconnection System Wamena ... 12 Figure 2.7 Electricity Development Planning Map at Sorong System ... 14 Figure 2.8 Electricity Development Planning Map at Manokwari System ... 14 Figure 4.1 Receiving Terminal Location ... 30 Figure 4.2 LNG Distribution Route Model 1 ... 36 Figure 4.3 LNG Distribution Route Model 2 ... 37 Figure 4.4 Create Module of LNG ... 38 Figure 4.5 Route 1 Distribution Design ... 38 Figure 4.6 Decide the Signal to Transport ... 39 Figure 4.7 Unloading Distribution Design for Route 1... 39 Figure 4.8 Process Module Ribbon ... 40 Figure 4.9 ARENA Logical Model (Model 1) ... 41 Figure 4.10 ARENA Logical Model (Model 2) ... 42
1
CHAPTER I INTRODUCTION 1.1. Background
Indonesia is an archipelago or islands country which is consists of 17.504 islands scattered in an area of 1.904.569 km2. The islands condition is still
complicated in developing the aspects of technology, economy and etc. Many islands in Indonesia are not well developed especially in Central Indonesia, even some islands are well developed. All Indonesia’s islands and citizen deserved to be well developed for their hometown.
Based on the Handbook of Energy and Economic Statistics of Indonesia issued by Energy and Mineral Resources Ministry, gas fields located in Indonesia have considerable potential and already proven the existence of some large gas fields exist in Indonesia.
Table 1.1 Natural Gas Reserves (per January) Database
Year Proven (TSCF) Potential (TSCF) Total (TSCF)
2007 106.00 59.00 165.00 2008 112.50 57.60 170.10 2009 107.34 52.29 159.63 2010 108.40 48.74 157.14 2011 104.71 48.18 152.89 2012 103.35 47.35 150.70 2013 101.54 48.85 150.39 2014 100.26 49.04 149.30 2015 97.99 53.34 151.33 2016 101.22 42.84 144.06
Source: Directorate General of Oil and Gas
Table 1.1 shows that gas fields owned by Indonesia are large enough to boost the existing economy in the country, can utilize natural gas as a power plant. PT. PLN has successfully utilized natural gas in the form of LNG as a source for power plants in several islands in Indonesia. Based on PLN Statistics and Electricity Statistics from Directorate General of Electricity, the last 5 years until 2016 power plants using natural gas in some areas have been built with installed capacity in the amount of; 4343.82 MW, 4389.08 MW, 4310.50 MW, 4310.50 MW and 4420.50 MW. Thus, PT. PLN will continue to develop and build power plants in various regions of Indonesia using energy from LNG.
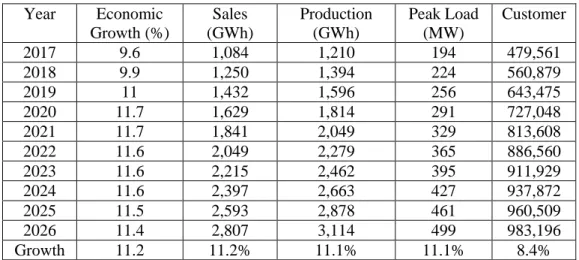
Economic conditions in the region of Papua in the last five years is lower than the previous average of 4.9% per year while the West Papua region grew better than the previous average of 10.45% per year. This economic condition will affect the high consumption of electricity in these two provinces. Thus, the electricity needs of these two provinces will met by PLN by adding power plants in these two provinces. This is shown in tables 1.2 and 1.3 below which describes the amount of electricity demand by comparison of the existing economic growth in the two provinces.
Table 1.2 Electricity Power Projection in Papua Year Economic Growth (%) Sales (GWh) Production (GWh) Peak Load (MW) Customer 2017 9.6 1,084 1,210 194 479,561 2018 9.9 1,250 1,394 224 560,879 2019 11 1,432 1,596 256 643,475 2020 11.7 1,629 1,814 291 727,048 2021 11.7 1,841 2,049 329 813,608 2022 11.6 2,049 2,279 365 886,560 2023 11.6 2,215 2,462 395 911,929 2024 11.6 2,397 2,663 427 937,872 2025 11.5 2,593 2,878 461 960,509 2026 11.4 2,807 3,114 499 983,196 Growth 11.2 11.2% 11.1% 11.1% 8.4%
Source: Rencana Usaha Penyediaan Tenaga Listrik (RUPTL) PLN 2017-2026 Table 1.3 Electricity Power Projection in West Papua
Year Economic Growth (%) Sales (GWh) Production (GWh) Peak Load (MW) Customer 2017 4.9 483 610 108 194,605 2018 5.1 522 655 116 209,047 2019 5.7 564 703 125 223,577 2020 6.1 609 755 134 238,712 2021 6.0 652 802 142 247,797 2022 6.0 695 850 150 254,400 2023 6.0 740 900 159 261,091 2024 6.0 788 952 168 267,912 2025 6.0 838 1,006 178 274,807 2026 5.9 891 1,062 188 281,739 Growth 5.8 7.0% 6.4% 6.3% 4.2%
Source: Rencana Usaha Penyediaan Tenaga Listrik (RUPTL) PLN 2017-2026
Based on the electricity power projection needs from PT. PLN in 2017, the peak load on Papua Province requires 499 MW of electricity and the province of West Papua requires 188 MW of electricity. With the large demand difference between the current production capacity, it is necessary to developing the power plants to meet those needs. PLN's plan to build a gas-fired power plant is based on Minister of Energy and Mineral Resources Regulation no. 37 of 2015 on the provisions and procedures for determining the allocation, utilization and natural gas price. The allocation of utilization of natural gas as fuel for power generation gets priority number five after: utilization for transportation, household and small customer; increased national oil and gas production; fertilizer industry; and industry made from natural gas. The government has set a gas allocation produced by Tangguh LNG Train 3 about 75% of the 3.8 Million Ton Per Annum (MTPA) to PLN to operate PLTGU which is a 35,000 MW electricity generation program in Indonesia.
3
Based on the allocation of gas fuel and the planned power plant construction, the government should also prepare the supporting facilities and the concept of natural gas distribution from the Tangguh LNG Refinery to the power plant in Papua. A scenario of LNG supply chain is necessary since government had committed to allocate local production of natural gas to supply power plants in Indonesia.
1.2. Statement of Problems
Based on the description above the statement of problem of this thesis are: 1. What are possible scenarios (route, receiving terminal capacity, fleet
size) to distribute LNG for power plants in Papua and Papua Barat? 2. How to simulate the model and scenario?
3. What is the feasible LNG distribution model and scenario technically? 1.3. Constraints
The constraints of this thesis are;
1. This thesis is focusing on the LNG supply distribution from Tangguh LNG Storage Papua area power plants.
2. Tangguh LNG Storage have port facilities which can provide all type of LNG carrier.
3. All power plants analyzed based from Rencana Usaha Penyediaan Tenaga Listrik (RUPTL) PLN 2017-2025 and also for the gas power plants (PLTG/MG).
4. Supply LNG only for the certain power plant aimed. 1.4. Research Objectives
The objectives of this thesis are;
1. To determine a transshipment modelling and some scenarios of LNG distribution.
2. To simulate the model and scenarios using Discrete-Event Simulation method.
3. To find feasible LNG distribution technically. 1.5. Research Benefits
Benefits that can be collected from this thesis writing task are:
1. Deliver solution of LNG supply chain for power plants in eastern Indonesia.
2. Understand the facilities that should be prepared for LNG distribution.
3.
Assure efficiency and reliability of LNG supply for power plants in5
CHAPTER II LITERATURE REVIEW 2.1. LNG Basic Concept
Liquefied Natural Gas (LNG) is natural gas that predominantly is methane, CH4 with some mixture of ethane C2H6 that has been converted into liquid form for
ease and safety of non-pressurized storage or transport. The natural gas condensed into liquid at -162oC (-260oF) at almost atmospheric pressure. The liquefaction
process involves removal of certain components such as dust, acid, gases, helium, water and hydrocarbons which could cause difficulty downstream and processed through desulfurization, dehydration and carbon dioxide cleaning. All this process will make the gas become odorless, colorless, non-toxic and non-corrosive.
This liquid form makes it possible in transporting the gas at big amount of gas by LNG carrier vessel. It takes up about 1/600 volume of natural gas in the gaseous state at standard conditions for temperature and pressure. It will make the long distance transport destination of gas more economics while there is no pipeline. When transporting the natural gas with pipeline is not possible or not economical, it can be transported by LNG carrier, where many of tank type for LNG are membrane or “moss”.
The energy density that produces by LNG is comparable with petroleum fuel and diesel fuel. LNG is a clean energy, 1 KWH gas energy of LNG contain 446 gram CO2, also the content of nitrogen oxide is around 20-37% and carbon dioxide 57%
that less than coal. Besides that, it because the flash point of LNG is higher than petroleum fuel. These characteristic makes LNG become the safe energy. LNG have higher calories (12000 kcal/kg) than other types of fuel. This gas type produces less pollution, but the production cost is relatively high and requirement for storage that use expensive cryogenic tank for commercial application. Cryogenic is a liquid form from elements or molecule that melting under 100oF temperature. LNG is originated
from natural gas that have a mixture from some different gases so that don’t have specific flash point. The flash point is depending on the source of usage gas and the process to liquefied the gas form. The highest flash point for LNG is around 24 MJ/L at -164oC temperature and the lowest point is 21 MJ/L (Oscarino, 2010)
Exploration activities are started on developing the onshore and offshore area in some places. Using seismic technology with hydrocarbon high probability, identification activities are done in the target areas. After done the environmental impact assessment (AMDAL) or environmental management and monitoring studies (UKL/UPL), working area manager could do well drilling test. LNG terminal have facilities to transporting LNG from tanker to LNG storage tank on the land, transferring to high pressure booster pumps, evaporating the LNG to produce high pressure natural gas. LNG terminal designed to receive LNG from some LNG production facilities (Oscarino, 2010)
There is some benefit in utilize natural gas as power plant fuel, include:
The usage in power plant: natural gas can be used in Combine Cycle Gas Turbine (CCGT) which can make this facility in having higher thermal efficiency than coal or oil for power plant with same capacity for the power plant.
Environment advantage: natural gas is one of the cleanest source of energy and have more efficient form than other energies, almost produce zero particular and less content of NOx and CO2 than other
fossil fuels.
LNG have less fire risk than other types of hydrocarbon, LNG leaks is easy to detect because of the cloud humidity is visible, also fire rate of LNG is slower than humanmovement.
2.2. LNG Supply Chain
Supply chain is a series of relationships between companies or activities that carry out the supply of goods or services from the place of origin to the buyer or customer. Supply chain concerns the ongoing relationship of goods, money and information. Goods generally flow from upstream to downstream, money flows from downstream to upstream, while information flows from upstream to downstream and downstream to upstream. When viewed horizontally, there are five main components or actors in the supply chain, i.e. suppliers, manufacturers, distributors, retailers and customers. Vertically, there are several main components of supply chain, namely buyer, transporter, warehouse, seller and etc. Supply chain management is the planning, design and controlling the flow of information and goods throughout the supply chain that aims to meet the requirements of the customer, efficiently for the present and the future (Schroeder, 2003).
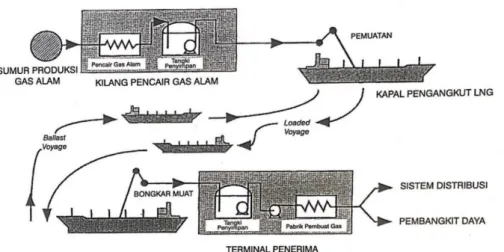
Supply Chain is a travel chain of natural gas taken up to the end user. The initial process of the LNG supply chain involves transporting natural gas from its production fields through pipelines to the liquefaction plant. Prior to the liquefaction of the gas, treatment was first undertaken to remove contaminants to substances such as carbon dioxide, water and sulfur to avoid them freezing and eventually breaking down when the gas was cooled to -162°C. Liquefaction plant is similar to a large refrigerator equipped with compressor, condenser, expansion valve and pressure evaporator. LNG generated through the liquefaction plant is routed through pipes to storage tanks / storage tanks. Pipelines and storage tanks must be isolated to maintain low temperatures so that both items are specially designed to accommodate cryogenic liquids. The LNG is then extracted from a storage tank for loaded into the LNG carrier to the receiving terminal. Before reaching the user, the LNG is first converted into a gas phase back in the regasification plant. The following is a figure of LNG supply chain from the gas field to the last user.
7
Figure 2.1 LNG Supply Chain (Source: Ketut Buda Artana, 2006) 2.2.1. Gas Reserves
A petroleum reservoir or oil and gas reservoir is a subsurface pool of hydrocarbons contained in porous or fractured rock formations. Petroleum reservoirs are broadly classified as conventional and unconventional reservoirs. In case of conventional reservoirs, the naturally occurring hydrocarbons, such as crude oil or natural gas, are trapped by overlying rock formations with lower permeability. While in unconventional reservoirs the rocks have high porosity and low permeability which keeps the hydrocarbons trapped in place, therefore not requiring a cap rock. Reservoirs are found using hydrocarbon exploration methods.
Figure 2.2 Indonesia Natural Gas Reserves (Source: Ditjen Migas, 2016)
Gas reservoirs have been divided into three groups; dry gas, wet gas and retrograde-condensate gas. A dry-gas reservoir is defined as producing a single composition of gas that is constant in the reservoir, wellbore, and
lease-separation equipment throughout the life of a field. Some liquids may be recovered by processing in a gas plant. A wet-gas reservoir is defined as producing a single gas composition to the producing well perforations throughout its life. Condensate will form either while flowing to the surface or in lease-separation equipment. A retrograde-condensate gas reservoir initially contains a single-phase fluid, which changes to two phases (condensate and gas) in the reservoir when the reservoir pressure decreases. Additional condensate forms with changes in pressure and temperature in the tubing and during lease separation. From a reservoir standpoint, dry and wet gas can be treated similarly in terms of producing characteristics, pressure behavior, and recovery potential. Wellbore hydraulics may be different. Studies of retrograde-condensate gas reservoirs must consider changes in condensate yield as reservoir pressure declines, the potential for decreased well deliverability as liquid saturations increase near the wellbore, and the effects of two-phase flow on wellbore hydraulics.
2.2.2. LNG Carrier
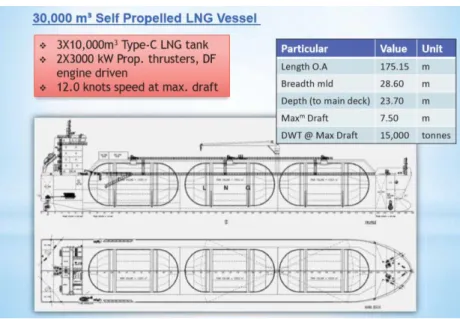
LNG Carrier is a tank ship designed for transporting liquefied natural gas (LNG). As the LNG market grows rapidly, the fleet of LNG carriers continues to experience tremendous growth. The majority of new ships under construction are in the size of 120,000 – 140,000 m3 (4,200,000 – 4,900,000
cu ft), but there are orders for ships with capacity up to 260,000 m3 (9,200,000
cu ft). As of 2016, there were 451 LNG ships engaged in the deep sea movement of LNG. In the case of small scale LNG carriers (LNG carriers below 40,000 m3 (1,400,000 cu ft)), the optimal size of a ship is determined by
the project for which it is built, taking into consideration volume, destination and vessel characteristics.
9
2.2.3. Barge Container Skid
Small and medium economy countries are developing their infrastructures in remote locations. They need LNG for:
1. Power production, as those places are not connected to the national power grids
2. Industrial raw materials 3. Transportation fuel
Regular sized LNG vessels can’t enter to those locations. Hence small-scale LNG carriers are necessary for transporting LNG to those remote locations. There are challenges in small scale LNG transportation that necessity based on transportation method. Customized designs are required for each case to transport LNG, initial investment is a factor in developing small-scale LNG infrastructures, requires a sustainable transportation model to compete with road transportation in future and it need to consider the problems in coastal and river waterway transportation which will gave an affection in:
1. Designs of small coastal LNG carrier/river barges
2. Design of small LNG terminal, loading/unloading facilities Also while there are challenges, there will be solutions for small-scale LNG transportation, such as:
1. Based on the propulsion system: a. Self-propelled LNG carrier b. Non-propelled LNG carrier 2. Based on LNG containment system:
a. ‘Type-C’ LNG tanks
b. ‘Membrane Type’ LNG tank 3. Based on the draft limitation of the waterways:
a. Regular draft LNG carriers b. Shallow draft LNG carriers
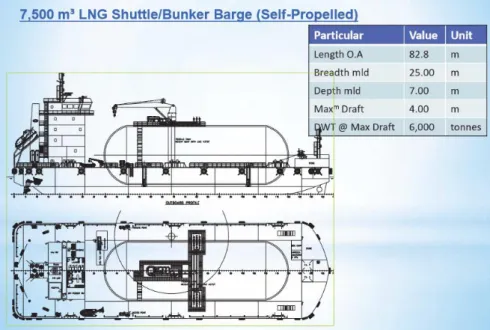
Figure 2.4 LNG Shuttle / Bunker Barge (Source: Keppel Offshore & Marine Technology Centre) 2.2.4. LNG Hub Storage
A liquefied natural gas storage tank or LNG storage tank is a specialized type of storage tank used for the storage of Liquefied Natural Gas. LNG hub storage is a storage that located in one of the power plant demand area and located as the main storage before distribute to the rest power plant in that area. LNG storage tanks can be found in ground, above ground or in LNG carriers. The common characteristic of LNG Storage tanks is the ability to store LNG at the very low temperature of -162 °C (-260 °F). LNG storage tanks have double containers, where the inner contains LNG and the outer container contains insulation materials. The most common tank type is the full containment tank. Tanks vary greatly in size, depending on usage.
In LNG storage tanks if LNG vapors are not released, the pressure and temperature within the tank will continue to rise. LNG is a cryogen, and is kept in its liquid state at very low temperatures. The temperature within the tank will remain constant if the pressure is kept constant by allowing the boil off gas to escape from the tank. This is known as auto-refrigeration.
The world's largest above-ground tank (Delivered in 2000) is the 180 million liters full containment type for Osaka Gas Co., Ltd. (2) The world's largest tank (Delivered in 2001) is the 200 million liters Membrane type for Toho Gas Co., Ltd.
2.2.5. Receiving Terminal
Liquefied natural gas terminal is a structure for liquefied natural gas to store. It can comprise special tanks, ships or even building structures. Port infrastructures and pipelines are also a part of LNG terminals. Liquefied natural gas is the form used to transport natural gas over long distances, often by sea. In most cases, LNG terminals are purpose-built ports used exclusively
11
to export or import LNG. The function of an LNG import terminal is to receive LNG cargos, store LNG, and re-vaporize the LNG for sale as gas. Odorant injection may be required if gas is to be exported through a transmission grid. There are two main systems used for LNG vaporization: submerged combustion vaporizers and open-rack vaporizers (ORVs). In submerged combustion vaporizers, the LNG passes through tubes immersed in a water bath, which is heated by submerged burners. In ORVs, water runs down the outside of the vaporizer tubes (usually vertical) as a film. River water or seawater is normally used.
2.3. Power Plant in Papua
Papua region is divided into West Papua Province and Papua Province with 40 districts, a total area of 424,500 km2 and 16 million inhabitants. In section will be further explained on the condition of electricity in Papua province and West Papua based on the Rencana Usaha Penyediaan Tenaga Listrik (RUPTL) 2017-2026.
2.3.1. Papua Province
Papua Province consists of 36 districts and 1 municipality with the distribution location of the capital far between each other. The power supply uses a 20 kV system and still isolated, partly using a low voltage 220 Volt network directly to the load. In addition, there are still some district capitals that have not received electricity from PLN. The ratio of the number of PLN electricity household customers in 2015 to the province of Papua is around 45.93%, still very low amount.
Papua province is currently supplied by several power plants whose total peak load reaches 145.9 MW. PLN through RUPTL 2017-2026 projected that electricity demand will increase by 8.4% annually or reach 499 MW in 2026 (see table).
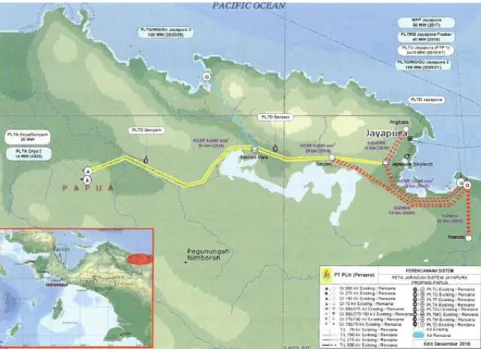
The development plans of power plant facilities, transmission and distribution networks in Papua Province are carried out with due regard to the needs and potential of the local primary energy and population distribution. In order to meet the needs of the load in period 2017-2026, planned an addition of power plant capacity of about 755 MW, the details as shown in table 2.1. In addition to the construction of new power plants, the PLN RUPTL also mentions the planning infrastructure supporting electrical energy distribution that can be seen in Figure 2. The picture describes the development plan of interconnection system of 70 kV and 150 kV Jayapura.
Figure 2.5 Development Planning Map Interconnection System 70 kV and 150 kV Jayapura (Source: RUPTL PLN 2017-2026)
Figure 2.6 Development Planning Map Interconnection System 150 kV Wamena (Source: RUPTL PLN 2017-2026)
13
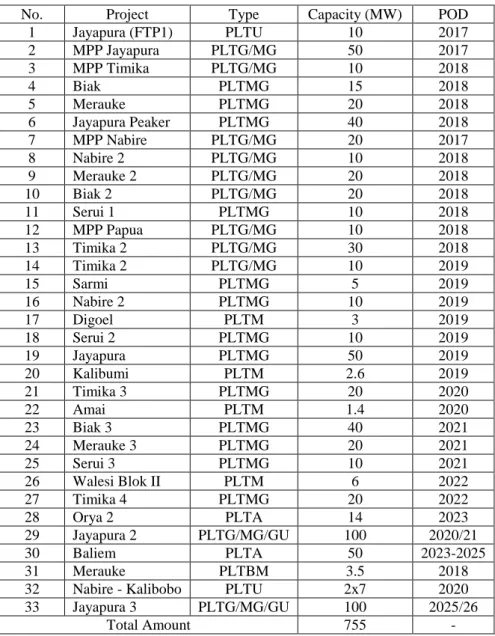
Table 2.1 Power Plant Development Planning List
No. Project Type Capacity (MW) POD
1 Jayapura (FTP1) PLTU 10 2017 2 MPP Jayapura PLTG/MG 50 2017 3 MPP Timika PLTG/MG 10 2018 4 Biak PLTMG 15 2018 5 Merauke PLTMG 20 2018 6 Jayapura Peaker PLTMG 40 2018 7 MPP Nabire PLTG/MG 20 2017 8 Nabire 2 PLTG/MG 10 2018 9 Merauke 2 PLTG/MG 20 2018 10 Biak 2 PLTG/MG 20 2018 11 Serui 1 PLTMG 10 2018 12 MPP Papua PLTG/MG 10 2018 13 Timika 2 PLTG/MG 30 2018 14 Timika 2 PLTG/MG 10 2019 15 Sarmi PLTMG 5 2019 16 Nabire 2 PLTMG 10 2019 17 Digoel PLTM 3 2019 18 Serui 2 PLTMG 10 2019 19 Jayapura PLTMG 50 2019 20 Kalibumi PLTM 2.6 2019 21 Timika 3 PLTMG 20 2020 22 Amai PLTM 1.4 2020 23 Biak 3 PLTMG 40 2021 24 Merauke 3 PLTMG 20 2021 25 Serui 3 PLTMG 10 2021 26 Walesi Blok II PLTM 6 2022 27 Timika 4 PLTMG 20 2022 28 Orya 2 PLTA 14 2023 29 Jayapura 2 PLTG/MG/GU 100 2020/21 30 Baliem PLTA 50 2023-2025 31 Merauke PLTBM 3.5 2018
32 Nabire - Kalibobo PLTU 2x7 2020
33 Jayapura 3 PLTG/MG/GU 100 2025/26
Total Amount 755 -
Source: Rencana Usaha Penyediaan Tenaga Listrik (RUPTL) PLN 2.3.2. West Papua Province
West Papua Province consists of 10 districts and 1 municipality with the electrical system still isolated, consisting of 6 systems 20 kV and the load above 1 MW are Sorong system, Fakfak, Manokwari, Kaimana, Teminabuan and Bintuni. The ratio number of PLN electricity household customers in 2015 to West Papua province amounted to 82.70 % with a peak load of 70.2 MW supplied from several plants. Figure 2.11 and Figure 2.12 shown the power system development planning in Manokwari and Sorong areas.
Figure 2.7 Electricity Development Planning Map at Sorong System (Source: RUPTL PLN 2017-2026)
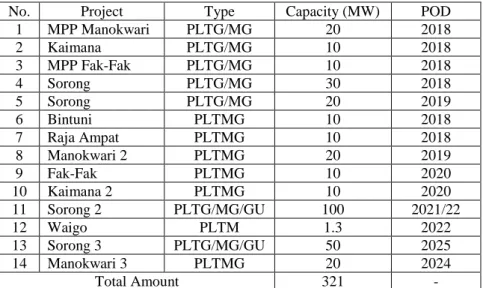
Figure 2.8 Electricity Development Planning Map at Manokwari System (Source: RUPTL PLN 2017-2026) The construction planning of electricity facilities in West Papua Province are necessary is done because most of the power supply comes from excess power or power excess delivered from private companies that have uncertain reliability supply. In addition, the plant with HSD fuel and steam still not sufficient the needs of electricity. To meet the electricity needs until 2026 period, it has planned to build several power plants with total capacity about 321 MW.
15
Table 2.2 Power Plant Development Planning List
No. Project Type Capacity (MW) POD
1 MPP Manokwari PLTG/MG 20 2018 2 Kaimana PLTG/MG 10 2018 3 MPP Fak-Fak PLTG/MG 10 2018 4 Sorong PLTG/MG 30 2018 5 Sorong PLTG/MG 20 2019 6 Bintuni PLTMG 10 2018 7 Raja Ampat PLTMG 10 2018 8 Manokwari 2 PLTMG 20 2019 9 Fak-Fak PLTMG 10 2020 10 Kaimana 2 PLTMG 10 2020 11 Sorong 2 PLTG/MG/GU 100 2021/22 12 Waigo PLTM 1.3 2022 13 Sorong 3 PLTG/MG/GU 50 2025 14 Manokwari 3 PLTMG 20 2024 Total Amount 321 -
Source: Rencana Usaha Penyediaan Tenaga Listrik (RUPTL) PLN 2.4. System
System is defined as a collection of objects incorporated in a regular interaction and interdependency. Several components that establish a system are:
Entity:
Entities or object studies in the system are object items that are processed through systems such as products, customers, and documents. Entities can have unique characteristics such as cost, size, priority, quality or condition. Entities can be grouped into human or animal (customer, patient, etc.), non-human (products, components, documents, garbage, etc.) and intangible (phone calls, electronic mail, etc.).
Attribute:
Attribute is a properties or characteristics of entities that specific
Activities:
Activities can be interpreted as activities / tasks performed entities within a certain period of time, can also be viewed as tasks performed in the system (either directly or indirectly) in processing entities. Examples of activities are serving customers, cutting components, repairing an equipment, etc. Activity takes time and requires a resource. Activities may be classified as entity-processing activities (check-in, product inspection, fabrication, etc.), entity and resource displacements (forklift displacements, transit in conveyor belts etc), and resource adjustment / repair / maintenance (machine setup, repair engine, etc.).
State:
State is defined as variable that give a description of status on system in certain relative time against the purpose.
Event:
Event is an event (instant) that can change the status of the system (variable state). Endogenous event is an activity or event that occurs in the system, for example the incidence of completion of a customer service. Exogenous events are activities or events outside the system (environment) that affect the system, e.g. the arrival of a customer into the bank.
Resource:
Resources is an object or equipment used in conducting an activity. Resources provide support facilities, equipment, and labor to complete a job. Resources typically have characteristics of capacity, speed, cycle time, and reliability. Resources can be grouped as human or animate (operator, doctor, repair officer, etc.), inanimate (equipment, equipment, workspace, etc.), and intangible (information, electrical power, etc.). Resources can also be classified as dedicated or shared resources, permanent or consumable, and mobile or stationary.
Delay:Delay is a duration of time unspecified indefinite length, which is not known until it ends.
2.5. Transshipment Model
Transshipment is a combination between transportation and deconsolidation. Transportation is done during all the stages, from the source to an intermediate storage location through to a final destination. Either the same vessel is used to carry it to its destined locations.
The transshipment problem is a transportation problem in which each origin and destination can act as an intermediate point through which goods can be temporarily received and then transshipped to other points or to the final destination. (Gass, 1969, 232).
Transshipment or Transhipment is the shipment of goods or containers to an intermediate destination, and then from there to yet another destination. This logistics operation could be also named as re-exporting. Transshipment has become an integral part of the logistic strategy of many shipping companies. Indeed, from its origin to its final destination, any given cargo might have transshipped three or four times. Transshipment can be viewed as routing goods in such a way that would decrease shipping costs, take advantage of economies of scale and improve the range of services or routes offered to customers. In particular, transshipment services provide shippers with additional routing options (especially towards final destinations at smaller ports) and reduced transit times. Earlier, before the development of large oceangoing container ships, transshipment was simply an induced operation when a small part of the cargo on the board of a vessel had to be unloaded in an intermediary port due to different destination of the main cargo on the board.
The level of transshipment through a given port or a country is in general the result of strategic decisions made by the shipping companies themselves. In order to satisfy the demands of carriers, transshipment ports need to satisfy a number of attributes:
17
Availability of an array of high-frequency feeder services, connecting the hub with its network of feeder ports
Convenient geographical location with access to major trade routes and other transshipment centers
Efficient, highly productive and competitively priced port and terminal services
Availability of modern high-tech infrastructure (e.g., berths, gantry cranes, container storage space) as well as equipment that allows for a quick turnaround time of large vessels
2.6. Simulation
Simulation is the imitation of the operation of a real-world process or system over time. The act of simulating something first requires that a model be developed; this model represents the key characteristics, behaviors and functions of the selected physical or abstract system or process. The model represents the system itself, whereas the simulation represents the operation of the system over time.
Simulation is used in many contexts, such as simulation of technology for performance optimization, safety engineering, testing, training, education, and video games. Often, computer experiments are used to study simulation models. Simulation is also used with scientific modelling of natural systems or human systems to gain insight into their functioning, as in economics. Simulation can be used to show the eventual real effects of alternative conditions and courses of action. Simulation is also used when the real system cannot be engaged, because it may not be accessible, or it may be dangerous or unacceptable to engage, or it is being designed but not yet built, or it may simply not exist.
There are three type of simulation; discrete event simulation, static and dynamic, and Monte Carlo. They were defined as:
1. Monte Carlo Simulations:
This type of simulation techniques is a simulation that sampling from a particular probability distribution involves the use of random numbers. Monte Carlo simulation is sometimes called Stochastic Simulation. This technique considered using random or pseudo random numbers. It is important to know what random numbers are. The example is when tossing a coin, if coin is unbiased, probability of coming head is 0.5. This simulation technique does not play time as substantial role, the observations as a rule are independent and it is possible to express the response as a rather simple function of the stochastic input variates. 2. Static and Dynamic Simulations:
Static model of simulation doesn’t consider time, so the model is comparable to a snapshot or a map. A simulation of a system at one specific time, or a simulation in which time is not a relevant parameter for example. The example a model of the weight of a salamander as being proportional to the cube of its length has variables for weight and length, but not for time. Dynamic model of simulation is changes by the time. A simulation representing a system evolving over time. The example is the
number of salamanders in an area undergoing development changes with time and model of such a population is dynamic.
3. Discrete-event Simulation:
This simulation is a models the operation of a system as a Discrete Sequence of Events in time. Each event occurs at a particular instant in time and marks a change of state in the system. Between consecutive events, no change in the system is assumed to occur; thus the simulation can directly jump in time from one event to the next.
Consider simulation of some system which evolves through time. There is a huge variety of such applications. One can simulate a weather system, for instance. A key point, though, is that in that setting, the events being simulated would be continuous, meaning for example is to simulate the operation of a warehouse. Purchase orders come in and are filled, reducing inventory, but inventory is replenished from time to time. Here a typical variable would be the inventory itself, i.e. the number of items currently in stock for a given product. To graph that number against time, get what mathematicians call a step function, i.e. a set of flat line segments with breaks between them. The events which decreases and increases in the inventory are discrete variables, not continuous. (Matloff, 2008)
To solve problem about supply chain, several methods is developed. Discrete event simulation and system dynamics will give as an understanding behavior of systems over time and compare their performance under different conditions. Discrete event simulation is mainly used to study and evaluate the detailed operations of a supply chain in high level of accuracy. Discrete event simulation is more often modelling system performance, inventory planning/management, production planning and scheduling. While system dynamics commonly used to model issues regarding information sharing, bull-whip effect and inventory planning/management. 2.7. ARENA DES-Software
ARENA is one of some software that can be used and have a specialty in simulation including discrete-event simulation that usually using this software to create a computer simulation of a system. Computer simulation is refer to methods for studying a wide variety of models of real-world systems by numerical evaluation using software designed to imitate the system’s operations or characteristics. Simulation is the process of designing and creating a computerized model of a real or proposed system for the purpose of conducting numerical experiments to give us a better understanding of the behavior of that system for a given set of conditions.
Simulation models are start by create a system that will be simulated e.g. a
simple processing system. The simulation usually involves waiting lines or queue as
building blocks. Then after the system is create, the next step is deciding and collecting the output performance measures. The output performance measures are:
19
The Total Productionis number of parts that complete their service at the drill press and leave.
The Average Waiting Time in Queue is a time in queue records that only the time a part is waiting in the queue and not the time it spends being served at the drill press. The average algorithm is:
∑𝑁𝑖=𝑙𝑊𝑄𝑖
𝑁 (2.1)
Where:
WQi : Waiting time in queue of the i part.
N : Number of parts leave the queue during the running time. This is generally called a discrete-time or discrete-parameter statistic since it refers to data. These are called tally statistics since values of them are “tallied” when they are observed.
The Maximum Waiting Time in Queue is a worst-case measure, which might be of interest in giving service-level guarantees to customers. Small is good.
The Time Average Number of Parts Waiting in the queue is a weighted average of the possible queue lengths weighted by the proportion of time during the run that the queue was at that length. In integral calculus terms, this is:
∫ 𝑄(𝑡)𝑑𝑡
𝑙𝑒𝑛𝑔𝑡ℎ 𝑜𝑓 𝑟𝑢𝑛 (2.2)
Where:
Q(t) : Number of parts in the queue at (t) time. Length of run : Length of the simulation is running.
Such time-persistent statistics are common in simulation. This indicates how long the queue is (on average).
The maximum number of parts that were ever waiting in the queue is a better indication of how much floor space is needed than is the time average.
The Average and maximum total time in system also called cycle time is the time that elapses between part’s arrival and departure.
The Utilization is defined as the proportion of time it is busy during the simulation. The utilization is:
∫ 𝐵(𝑡)𝑑𝑡
Where:
B(t) : Time of the utilization is busy during the simulation.
Length of run : Length of the simulation is running.
Resource utilizations are obvious interest in many simulation, but it’s hard to say whether they considered to be high (close to 1) or low (close to 0).
Then the next are the Queueing Theory. The most popular queueing theory is M/M/1 queue. The first M states that the arrival process is Markovian. The second M is stands for the service-time distribution and here is also an exponential. The “1” indicates that there’s just a single server. Most of the output performance measures can be expressed as simple formulas, it is:
𝜇𝑆2 𝜇𝐴− 𝜇𝑆
(2.4)
Where:
µA : the expected value of the interarrival-time distribution.
µS : the expected value of the service-time distribution.
For the expert user of ARENA there are some of algorithm that provided by the software. The algorithm especially about probability and statistics that can be used for simulating. For the probability algorithm, there is the random variables algorithm that can be used to quantifying and simplifying events by defining random variables. There are two basic forms in random variables, discrete and continuous. In this research discrete event simulation is used, so here the explanation for the discrete random variable.
1. Discrete
For discrete random variable, there will be a list of random possible values. There are also some of the function that related to the discrete random variables. First is the Probability Mass Function (PMF), the function that gives the probability that X will take on each of the possible values. Here is the function (Kelton, 2010).
𝑝(𝑥𝑖) = 𝑃(𝑋 = 𝑥𝑖) (2.5)
Where:
X : Random variable. xi : Non-random values.
Statement “X = xi” is an event that may or may not happen. The PMF may
be expressed in a variety different ways, a numerical list or table, graph, or some kind of mathematical formula. Then, the second is Cumulative
21
probability that X will be less than or equal to argument, the following function is describe CDF (Kelton, 2010).
𝐹(𝑥) = ∑𝑎𝑙𝑙 𝑖 𝑠𝑢𝑐ℎ 𝑡ℎ𝑎𝑡𝑝(𝑥𝑖) 𝑥𝑖≤𝑥
(2.6)
This summation is taken over all possible values xi that are ≤ the argument
x of F. Note that 0 ≤ F(x) ≤ 1 for all x, that F(x) → 0 as x → -∞, and that F(x) → 1 as x → +∞. Thus, F(x) is a non-decreasing function going from 0 up to 1 as x goes from left to right. F(x) is a “step” function that’s flat between adjacent possible values xi, and takes a “jump” of height p(xi)
above xi.
The next function is Probability of an event involving a discrete random variable X that generally can be found by adding up the appropriate values of the PMF, for instance,
𝑃(𝑎 ≤ 𝑋 < 𝑏) = ∑𝑎𝑙𝑙 𝑖 𝑠𝑢𝑐ℎ 𝑡ℎ𝑎𝑡𝑝(𝑥𝑖) 𝑎≤𝑥𝑖<𝑏
(2.7)
This just says to add up the probabilities of those x’s that are at least a but (strictly) less than b. Note that with discrete random variables, should be careful about weak vs strong inequalities.
Just as data sets have a “center” measured by the average of the data, random variables have a “center” in a certain sense. The Expected Value of the discrete random variable X is defined as,
𝐸(𝑋) = ∑𝑎𝑙𝑙 𝑖𝑥𝑖𝑝(𝑥𝑖) (2.8)
This function is also called the mean or expectation of X and is often denoted by µ or, if there’s need to identify the random variable, µx. This is
a weighted average of the possible values, with the weights being the respective probabilities of occurrence of each xi. Those xi’s with high
probability of occurrence are counted more heavily than are those that are less likely to occur. E(X) is just the simple average of the xi’s since they
all “count” the same. E(X) is not to be interpreted as the value of X that expected to get when do the experiment defining X. Indeed, E(X) might not even be a possible value of a discrete random variable X (the xi’s might
be integers but, depending on the situation, E(X) need not be an integer). The last thing, as the data sets have a measure of variability, so to do random variables. The variance of the discrete random variable X is defined as
For a discrete random variable the variance is calculated by summing the product of the square of the difference between the value of the random variable and the expected value and the associated probability of the value of the random variable, taken over all of the values of the random variable. From the equation above the equivalent formula for the variance of the discrete random variable is Var(X) = E(X2) – [E(X)]2. This is weighted
average of the squared deviation of the possible values xi around the
expectation, with the weights being the probability of occurrence of each xi. The variance is a measure of the “spread” of the random variable about
23
CHAPTER III METHODOLOGY 3.1. Methodology Flow Chart
3.2. Definition of Methodology Flow Chart 3.2.1. Determining Problem
This stage is an early stage to construct the thesis. In this stage, questions and problems are being prepared specifically in order to determine the specific objectives of this thesis. The content of the thesis is to overcome the statement of the problems mentioned earlier and it will be done by collect some information about the problems. Therefore, the purpose of this thesis can be understood in this stage.
3.2.2. Literature Study
After the problems is raised, the next step is literature study with the goal to explaining the review, give summary of the basic theory of this research and give information related to this research. Since this thesis is an implementation of some theories to reach a goal, various literature of a topic is required to construct into one project. The study of literature is done by reading papers, journals, thesis, media and literature books that relates and able to support this thesis.
3.2.3. Collecting Data
After literature study has been done, collecting data is being performed. A specific data as required in this thesis are being gathered in this stage, these are:
1. Type, Capacity and Location of power plants
2. Size, speed, fuel consumption and capacity of carrier 3. Geography of Papua and Papua Barat
4. Location, facility and characteristic of LNG source 3.2.4. Demand and Supply Data Analyzing
On this stage, all possible scheme of LNG supply chain whether by all modes of transportation is assessed with the current condition of sites. Afterwards, distances between LNG suppliers, transshipment point and power plants are calculated, also the distance between each power plants for each possible modes of distribution. Daily demand of LNG for each power plant is also calculated by converting its capacity with several equations depending on type of power plants.
3.2.5. Generate Route Model
On this stage, determine the supply chain possible routes, round trip time and total amount of LNG that have to be carried scenario using transshipment models by considering the data of distances and daily demands of LNG. Each scenario will be generated by qualitative judgement of researcher by considering the available data. Afterwards will be used to determine capacity of fleets, capacity of receiving terminal and number of fleets required.
25
3.2.6. Consider Scenario
In this step, after have the model of the transshipment for the LNG distribution in Papua and West Papua region, scenario will be needed to make some possibilities for the distribution. The determination of some scenario for each distribution model will consider the variation of receiving terminal tank capacity, fleet combination for each route and the level of inventory for each receiving terminal tank for signal to transport.
3.2.7. Discrete-Event Simulation
a. Create Model in ARENA Software
Next step after analyzing scenario of LNG distribution is to make conceptual model which is represent the scenario. Model is made in software with modules that available which may vary in different software. The model is simulated to assess whether the scenario is acceptable when demand of LNG is increased over time, as follows the increasing of produced electricity by power plants. Discrete-event simulation is a tool to be applied in order to achieve the objective.
b. Verification and Validation Model
Model verification is performed simultaneously with the running model simulation process by ensuring that the model can run (not error) on the model. While the verification is done to determine whether the model is in accordance with the real system. The validation process is done by performing a real output comparison of the system with the output of the simulation model. In this research, the validation is not needed because this model is not the real case that already constructed.
3.2.8. Conclusion & Suggestion
Last stage is to make a conclusion from the whole process that have been done before from the statement of problems.
From conclusions there is a suggestion that can be given based on the results from analyzing to become the next project. So that the next project can be better than this research.
27
CHAPTER IV
DATA ANALYZING AND DISCRETE-EVENT SIMULATION 4.1. Data Analyzing
4.1.1. Power Plants Identification
In this research, the power plants data is chosen based on Rencana
Usaha Penyediaan Tenaga Listrik (RUPTL) 2017-2026. Power plants that used
for this research are power plants that use gas for the fuel and located in Papua and West Papua Provinces. In the Papua and West Papua Provinces, there are two types of power plant that fueled by gas, such as; Gas Power Plants and Gas Mechanical Power Plant. The difference between that two types of power plants is for Gas Power Plants use gas turbine to generate the mechanical energy which is converted into electrical energy, meanwhile for the Gas Mechanical Power Plants use internal combustion engine to generate mechanical movement that converted to electrical energy.
Data of Gas Power Plants and Gas Mechanical Power Plants that already constructed and still on progress or planned according to RUPTL 2017-2026 are shown in table 4.1.
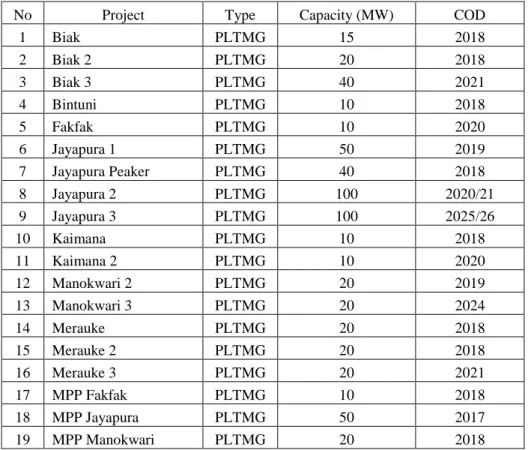
Table 4.1 Power Plants Gas Fueled in Eastern Part of Indonesia
No Project Type Capacity (MW) COD
1 Biak PLTMG 15 2018 2 Biak 2 PLTMG 20 2018 3 Biak 3 PLTMG 40 2021 4 Bintuni PLTMG 10 2018 5 Fakfak PLTMG 10 2020 6 Jayapura 1 PLTMG 50 2019 7 Jayapura Peaker PLTMG 40 2018 8 Jayapura 2 PLTMG 100 2020/21 9 Jayapura 3 PLTMG 100 2025/26 10 Kaimana PLTMG 10 2018 11 Kaimana 2 PLTMG 10 2020 12 Manokwari 2 PLTMG 20 2019 13 Manokwari 3 PLTMG 20 2024 14 Merauke PLTMG 20 2018 15 Merauke 2 PLTMG 20 2018 16 Merauke 3 PLTMG 20 2021 17 MPP Fakfak PLTMG 10 2018 18 MPP Jayapura PLTMG 50 2017 19 MPP Manokwari PLTMG 20 2018
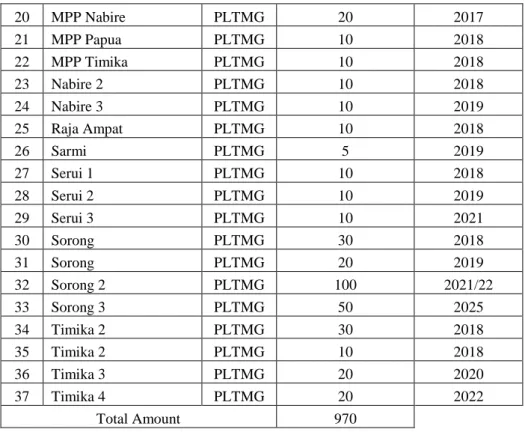
Table 4.2 Power Plants Gas Fueled in Eastern Part of Indonesia (Continued) 20 MPP Nabire PLTMG 20 2017 21 MPP Papua PLTMG 10 2018 22 MPP Timika PLTMG 10 2018 23 Nabire 2 PLTMG 10 2018 24 Nabire 3 PLTMG 10 2019 25 Raja Ampat PLTMG 10 2018 26 Sarmi PLTMG 5 2019 27 Serui 1 PLTMG 10 2018 28 Serui 2 PLTMG 10 2019 29 Serui 3 PLTMG 10 2021 30 Sorong PLTMG 30 2018 31 Sorong PLTMG 20 2019 32 Sorong 2 PLTMG 100 2021/22 33 Sorong 3 PLTMG 50 2025 34 Timika 2 PLTMG 30 2018 35 Timika 2 PLTMG 10 2018 36 Timika 3 PLTMG 20 2020 37 Timika 4 PLTMG 20 2022 Total Amount 970
The table above shown all power plants in Papua and West Papua region to proceed the LNG distribution scheme. The least capacity demand is at 5 MW in Sarmi power plant and the most capacity demand is at 100 MW in several power plants such as; Jayapura 2 & 3 and Sorong 2. As explained in chapter 2 that government allocated LNG to produced domestic power plants and in this occasion the source of LNG is supplied from Tangguh LNG Plant.
To analyzing the LNG demand in this thesis is furthermore conducted by counting fuel consumption. To simplify the calculation, several assumption is applied to estimate natural gas needed by power plants, there are:
1. Power plants consume 0.143 MMSCFD (Metric Million Standard Cubic Feet per Day) natural gas for every 1 MW power rate. 2. 1 MMSCFD is equal to 46 m3 LNG.
3. 1 MMSCFD is equal to 1000 MMBTU (Metric Million British Thermal Unit).
All of the power plants that analyzed will determined for the receiving terminal location. Power plants which located in the same region will served by one receiving terminal and known in this case that there is no receiving terminal which only served one power plant. Subsequently calculation of LNG consumption is the accumulation of LNG consumption at each power plants that served by the receiving terminal.