METHOD DEVELOPMENT FOR THE ANALYSIS OF PHARMACEUTICALS WITH
ACETHYLCHOLINESTERASE ACTIVITY IN WATER USING HPLC-DAD AND SOLID PHASE
EXTRACTION
Samuel Budi Wardhana
1,*, Marit Kolb
2, Müfit Bahadir
2,
Bambang Purwono
3, and Tutik Dwi Wahyuningsih
3 1Department of Chemistry, Semarang State University, Kampus Sekaran, Gunungpati, Semarang 50229, Central Java, Indonesia 2
Institute of Environmental and Sustainable Chemistry, Technische Universität Braunschweig, Hagenring 30, D-38106 Braunschweig
3
Department of Chemistry, Faculty of Mathematics and Natural Sciences, Universitas Gadjah Mada, Jl. Sekip Utara, Yogyakarta 55281, Indonesia
Received November 11, 2013; Accepted December 12, 2014
ABSTRACT
An SPE followed by HPLC-DAD method with ion pair chromatography technique to analyze pharmaceuticals with acethylcholinesterase activity including pyridostigmine (PYR), galathamine (GAL), neostigmine (NEO), eserine (ESE), and donepezil (DON) in water samples was developed. Acetylcholinesterase (AChE) inhibitors have been used to treat less severe dementias such as Alzheimer’s disease. Chromatographic separation was achieved using reversed-phase SymmetryShield column using gradient system with mobile phase consisting of H2O/ACN (99:1, v/v) as mobile phase A with 10 mM sodium 1-hexanesulfonate and 0.1% acetic acid (HAc). The HPLC/DAD method was linear between concentrations of 5 to 100 ng/μL. The IDL and IQL ranged from 0.50 to 1.25 ng/μL and 1.5 to 3.0 ng/μL, respectively. SPE was used to extract and clean up the target substances in spiked pure water, tap water, and wastewater samples. The application of extraction method of 5 target substances in wastewater sample was divided into 2 parts: Oasis WCX (6 mL, 500 mg) for PYR and Oasis HLB (6 mL, 200 mg) for GAL, NEO, ESE and DON. The developed SPE and HPLC/DAD method is applicable for quantification of the 5 target substances in water samples in a concentration range > 50 µg/L and assumable lower for DON (> 25 µg/L).
Keywords:acetylcholinesterase; solid phase extraction; ion pair chromatography
ABSTRAK
Dalam penelitian ini telah dikembangkan metode SPE diikuti HPLC-DAD dengan tehnik kromatografi pasangan ion untuk menganalisis lima senyawa yang memiliki aktivitas acethylcholinesterase yaitu pyridostigmine (PYR), galathamine (GAL), neostigmine (NEO), eserine (ESE) dan donepezil (DON) pada sampel air. Inhibitor asetilkolinesterase (AChE) telah digunakan untuk mengobati penyakit dementia seperti Alzheimer. Pemisahan kromatografi diperoleh dengan menggunakan kolom fasa terbalik, SymmetryShield dan menggunakan sistem gradien dengan fasa gerak terdiri dari H2O/ACN (99:1, v/v) yang mengandung 10 mM natrium 1-hexanasulfonat dan 0,1% asam asetat (HAc). Metode HPLC/DAD menunjukkan linearitas antara konsentrasi 5 sampai dengan 100 ng/μL. Nilai IDL diperoleh diantara 0,50 dan 1,25 ng/μL, sedang nilai IQL diantara 1,5 dan 3,0 ng/μL. SPE digunakan untuk ekstraksi dan pencucian 5 senyawa target pada sampel air murni, air kran dan air limbah yang telah ditambahkan larutan standar dengan konsentrasi tertentu. Metode ekstraksi untuk kelima senyawa target pada sampel air limbah dibagi menjadi 2 bagian dimana Oasis WCX (6 mL, 500 mg) digunakan untuk mengektraksi PYR dan Oasis HLB (6 mL, 200 mg) untuk GAL, NEO, ESE dan DON. Pengembangan metode SPE diikuti HPLC-DAD dapat digunakan untuk melakukan kuantifikasi 5 senyawa target pada sampel air dengan konsentrasi > 50 µg/L dan lebih rendah untuk DON (> 25 µg/L).
Kata Kunci:asetilkolinesterase; solid phase extraction; kromatografi ion pair
INTRODUCTION
Pharmaceuticals in the aquatic environment have been recognized as one of the emerging issues in
receiving water and environment. Various pharmaceuticals and its metabolites are found nowadays in surface waters, underground waters and even drinking waters as well.
Acetylcholinesterase (AChE) inhibitors have been used in the treatment of human diseases, the control of insect pests, and even as chemical warfare agents. Some inhibitors are used as antidementias such as Alzheimer’s disease because they have beneficial effect on cognitive functions for patients with less severe forms of the disease. The organization, Alzheimer’s Disease International [2], reported that there are an estimated 35.6 million people which suffer from dementia worldwide by 2010. These numbers will nearly double every 20 years, thus 65.7 million are estimated for 2030 and 115.4 million for 2050. Since the Alzheimer’s disease patients tend to increase in number, there is indication of increasing usage of antidementia drugs especially in the ageing population and consequently may also cause wastewater pollutions.
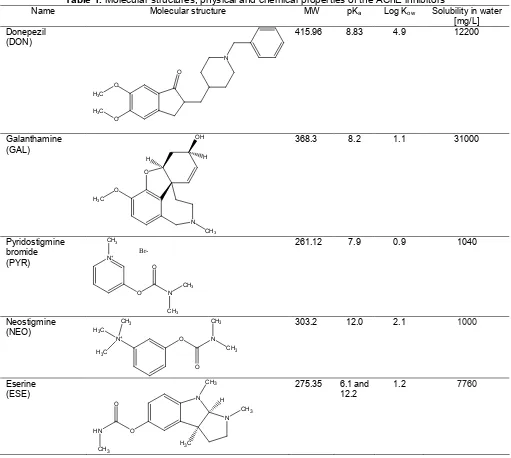
In order to anticipate the drawback effect of the presence of these AChE inhibitor pharmaceutical in environment, a controlling and monitoring must be done continuously in every water compartment in environment including the wastewater, surface, groundwater, and even drinking water. An analytical method with the high sensitivity and selectivity is needed to detect and to monitor the presence of ACh inhibitors simultaneously in water compartment in environment. In addition, extraction method for AChE inhibitor substances from the water matrix should be developed. The chemical structures, physical and chemical properties of the five AChE inhibitor drugs are presented in Table 1. All of the studied AChE inhibitors are moderate to strong basic compounds with pKa values that range between 6.1 and 12.2. The lipophilicities of the 5 compounds are characterized by log Kow values which range from 0.9 to 4.9. All of the substances are easily soluble in water with solubilities greater than 1000 mg/L.
Many methods for the determination and quantification of of AChE inhibitors in biological and drugs samples were reported in literature particularly with chromatographic techniques like HPLC with UV [4-6], fluorescence [7], DAD [8] or MS/MS detection [9]. For single substance measurement, HPLC method with UV detector provided good sensitivity and selectivity for the estimation of DON in tablets with the concentration
range 2–60 μg/mL [10]. HPLC method with DAD
detector gives not only good sensitivity and selectivity but also applicable for simultaneously measurement.
Sample preparation of human serum for HPLC analysis of AChE inhibitors was performed by applying ion pair LLE extraction method using picric acid as ion pair reagent for isolating PYR [11]. Comparison study between LLE and SPE of GAL from blood plasma and
tissues by Maláková et al. [12] revealed that extraction with Oasis MCX cartridges provided an acceptable extraction recovery of 81.0% and cleaner samples for the separation on chromatographic column compare to LLE. Schonberg et al. [13] compared hydrophobic, weak (WCX) and strong cation-exchange (SCX) material to extract basic compounds including NEO from urine sample and only the polymer based WCX sorbent met the requirements of the method concerning sample clean-up and elution with mobile phase. Octadecyl (C18)-bonded silica such as C18 SEP PAK was the most widely applied SPE adsorbent to extract PYR [14]. Cherstniakova et al. [15] reported extraction of PYR in human plasma by using Oasis HLB cartridges.
The aim of this study was the development and validation of a chromatographic reference method using SPE and HPLC/DAD for the simultaneous detection of AChE inhibiting pharmaceuticals in water samples. In this study, spiked pure, tap and wastewater was used as model with increasing of matrices complexity. The AChE inhibitors PYR, GAL, NEO, ESE and DON were selected as target compounds as these substances are active agents of approved pharmaceuticals in Germany and reference standards of the single substances were commercially available.
EXPERIMENTAL SECTION
Materials
Pyridostigmine bromide, galanthamine
hydrobromide (≥ 94%), neostigmine bromide (98%), donepezil hydrochloride monohydrate (≥ 98%) and
eserine were purchased from Sigma-Aldrich. Sodium 1-hexanesulfonic acid as ion pair reagent was purchased from Sigma-Aldrich, acetonitrile was purchased from HiPerSolv, methanol (HPLC grade) from Fischer Scientific, NaOH and acetic acid from Carl Roth, HCl and ammonia 25% from AnalaR NORMAPUR. Pure water was prepared using SERALPUR PRO 90/PRO
90 C Ultrapure water-System with 0.2 μm filters from
SERAL, tap water was taken from regular tap water in laboratory, influent wastewater samples were collected from the waste water treatment plant in Braunschweig, Germany. Glass fiber filter, 0.45 µm mesh MN GF – 6 Ø 150 mm was purchased from Macherey-Nagel. SPE cartridges C18 polar plus was purchased from J.T.Baker while Oasis HLB, Oasis MCX and Oasis WCX were purchased from Waters.
Instrumentation
Table 1.Molecular structures, physical and chemical properties of the AChE inhibitors
Name Molecular structure MW pKa Log Kow Solubility in water
[mg/L]
415.96 8.83 4.9 12200
Galanthamine
368.3 8.2 1.1 31000
Pyridostigmine
261.12 7.9 0.9 1040
Neostigmine
303.2 12.0 2.1 1000
Eserine
degasser, a binary pump and an autosampler from Agilent technologies. Reversed-phase C18 column
(SymmetryShield, 150 mm x 4.6 mm id, 3.5 μm particle
size) and SymmetryShield pre-column (4 mm × 4 mm,
5 μm particle size) were purchased from Waters. pH was
measured with a microprocessor pH Meter (pH 535 MultiCal, Weilheim, Germany) and pH-glass electrode SenTix61 (pH 0–14, 0–100 °C, 3 mol/L KCl) which was calibrated before measurement with standard buffer solutions at pH 4.00 ± 0.1, 7.00 ± 0.1 and 9.20 ± 0.1. Conductometer 340i was purchased from TetraCon. Ultrasonic bath Sonorex RK512S was purchased from Bandelin.
Procedure
Optimization of the HPLC conditions
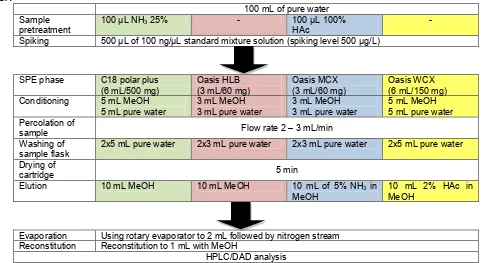
Table 2. SPE procedures for the fortification experiments with C18 polar plus, Oasis HLB, Oasis MCX and Oasis WCX
100 mL of pure water Sample
pretreatment
100 μL NH325% - 100 μL 100%
HAc
-Spiking 500 μL of 100 ng/μL standard mixture solution (spiking level 500 µg/L)
SPE phase C18 polar plus (6 mL/500 mg) Conditioning 5 mL MeOH
5 mL pure water
3 mL MeOH 3 mL pure water
3 mL MeOH 3 mL pure water
5 mL MeOH 5 mL pure water Percolation of
sample Flow rate 2 – 3 mL/min
Washing of sample flask
2x5 mL pure water 2x3 mL pure water 2x3 mL pure water 2x5 mL pure water
Drying of
Evaporation Using rotary evaporator to 2 mL followed by nitrogen stream Reconstitution Reconstitution to 1 mL with MeOH
HPLC/DAD analysis
reagent and gradient system was optimized. A gradient system with acetonitrile (ACN)/water in different composition of water content for mobile phase A and ACN for mobile phase B was tested. For the determination of the target substances in the presence of matrix, in particular from wastewater samples, displaying the chromatograms at longer wavelengths 245, 270, and 315 nm was included. The injection
volume was 10 μL, the column temperature 30 °C, and
the flow rate 1 mL/min. The optimized conditions of HPLC-DAD that achieved base line separation is called first method. In wastewater sample, the PYR peak overlapped with a peak from matrix interferences. In order to separate the PYR peak from the interferences the conditions were further optimized. This optimal HPLC-DAD condition is called modified method.
Comparison of the recovery rates of four different SPE cartridges
The extraction of AChE inhibitors with four different SPE cartridges were compared under the optimized conditions using pure water as it causes no matrix interferences. The selected SPE procedures for the different cartridges are listed in Table 2. All fortification experiments were conducted using 100 mL pure water spiked with the mixed standard solution at a spiking level
of 500 μg/L. The conditioning, loading and washing
steps were nearly identical in each procedure, just differed in the solvent volume depending on the respective amount of the SPE phases. The solvent used in the elution steps differed depending on the type of SPE phase. The eluates were evaporated and reconstituted in 1 mL MeOH, respectively. The recovery rates from the fortification experiments with pure water were calculated by comparing the peak area of each target compound with the peak area of a
50 ng/μL mixed standard solution after HPLC analysis.
Determination of the capacity of SPE cartridges
In order to check the capacity and performance of Oasis WCX (6 mL, 500 mg) cartridges using a larger sample volume, a series of fortification experiments were conducted with 100 mL (n=4), 500 mL (n=2) and
1000 mL (n=2) tap water spiked with 500 μL of 100 ng/μL mixed standard solution, respectively. The
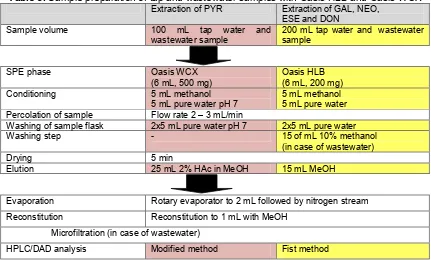
Table 3.Sample preparation of tap and wastewater samples with Oasis HLB and Oasis WCX
Extraction of PYR Extraction of GAL, NEO, ESE and DON
Sample volume 100 mL tap water and
wastewater sample
200 mL tap water and wastewater sample
SPE phase Oasis WCX
(6 mL, 500 mg)
Oasis HLB (6 mL, 200 mg)
Conditioning 5 mL methanol
5 mL pure water pH 7
5 mL methanol 5 mL pure water Percolation of sample Flow rate 2 – 3 mL/min
Washing of sample flask 2x5 mL pure water pH 7 2x5 mL pure water
Washing step - 15 of mL 10% methanol
(in case of wastewater)
Drying 5 min
Elution 25 mL 2% HAc in MeOH 15 mL MeOH
Evaporation Rotary evaporator to 2 mL followed by nitrogen stream
Reconstitution Reconstitution to 1 mL with MeOH
Microfiltration (in case of wastewater)
HPLC/DAD analysis Modified method Fist method
Fortification experiments with tap water and wastewater
The procedure for the extraction of PYR from tap water and wastewater with Oasis WCX (6 mL, 500 mg) is described in Table 3. Standard solution of PYR was added to 100 mL tap water samples with spiking level of
50 μg/L and to 100 mL wastewater samples with spiking levels of 50, 100 and 500 μg/L. Prior analysis with
HPLC, this solution was filtered through a micro filter and transferred to an amber autosampler vial. Modified method was used for HPLC analysis of this experiment. The procedure to extract GAL, NEO, ESE and DON from tap water and wastewater with Oasis HLB (6 mL, 200 mg) is also described in Table 3. 200 mL tap water samples were spiked with a mixed standard solution at
spiking level of 25 μg/L and 200 mL wastewater samples
were spiked with a mixed standard solution at spiking
level of 25, 50, 125 and 250 μg/L. In case of wastewater,
the reconstituted solution was filtered through a micro filter then transferred to an amber autosampler vial. HPLC analysis for this experiment was performed with first method.
Calibration curves
Calibration curves for the determination of recovery rates were obtained by measuring calibration standards in five different concentrations 5.00, 10.0, 25.0, 50.0 and
100 ng/μL. Calibration standard solutions were prepared by dilution of a standard mixture of 100 ng/μL in MeOH.
A linear regression was calculated using the peak area
of the target substances. The linearity of the calibration curves was validated by the correlation coefficient of the linear regression (R2).
Accuracy and precision
For the determination of the accuracy and the precision of the method, fortification experiments were conducted for wastewater and tap water in 4 replicates. The accuracy is defined as the mean value of the recovery rates (R = mean of measured
concentrations/spiked concentration)∙100% (Maláková
et al., 2007; Furukori et al., 2002). The precision is expressed as relative standard deviation (RSD =
(SD/mean)∙100%) of the recovery rate of each
substance. According to the criteria of DG Sanco [16], acceptable mean recovery rates are in the range of 70
– 120% with a RSD ≤ 20%.
Instrumental detection and quantification limits
In order to calculate the instrumental detection and quantification limits (IDL and IQL) a series of mixed standard solutions with equidistance concentrations
from 0.25 to 3.00 ng/μL were prepared by dilution of a 50 ng/μL mixed standard solution. The IDLs are
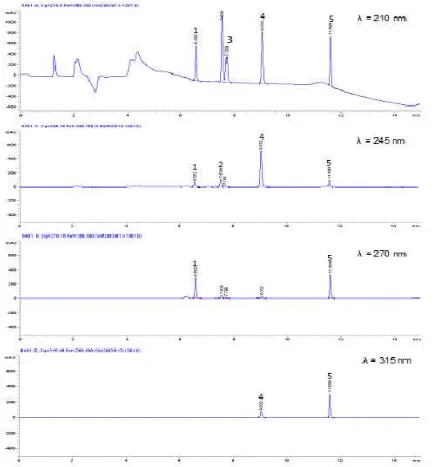
Fig 1. Chromatogram (λ=210, 245, 270 and 315 nm) of standard mixture 100 ng/μL using Symmetry Shield, 150 mm
x 4.6 mm, 3.5 μm, gradient E with mobile phase A: H2O/ACN (99:1, v/v) containing 0.1% HAc and 10 mM sodium 1-hexanesulfonate (pH = 3.1 ± 0.1) and mobile phase B: CAN. 1: PYR, 2: GAL, 3: NEO, 4: ESE, 5: DON
Method quantification limit
The method quantification limits (MQLs) were determined by fortification experiments with tap water and wastewater samples with different spiking level to the minimum level at which the analyte could be reliably quantified. 200 mL tap water samples were spiked with a
mixed standard solution at spiking level of 25 μg/L and
200 mL wastewater samples were spiked with a mixed standard solution at spiking level of 25, 50, 125 and 250
μg/L. The lowest spiking concentration, at which
acceptable recovery rates in the range of 70-120% with
RSD ≤ 20% [17] were reached, was defined as method
quantification limit.
RESULT AND DISCUSSION
Development of HPLC/DAD Method
The best separation with sharp symmetrical peaks was obtained using Symmetry Shield RP-18 (4.6
x 150 mm, particle size 3.5 μm) with mobile phase
Fig 2.Comparison of recovery rates with C18 polar plus (6 mL, 500 mg), Oasis HLB (3 mL, 60 mg), Oasis MCX
(3 mL, 60 mg) and Oasis WCX (6 mL, 150 mg) cartridges in 100 mL pure water spiked with 500 μL of 100 ng/μL
mixed standard solution (c=500 µg/L). RSD are given as error bars
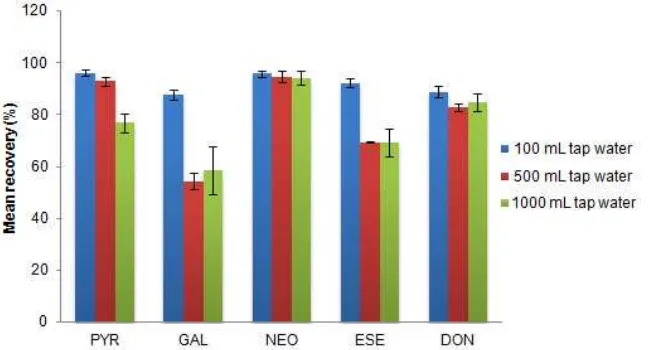
Fig 3.Mean recovery rates of target compounds from increasing volumes of 100 mL (c=500 µg/L) (n=4), 500 mL (c=100 µg/L) (n=2) and 1000 mL (c=50 µg/L) (n=2) spiked tap water samples with WCX cartridge (6 mL, 500 mg). RSD are given as error bars
sulfonate with 0.1% HAc and mobile phase B: ACN. Gradient system started 0% of B, increase to 100% B in 20 min and hold for 10 min decrease back to 0% B in 55 min. The pH of mobile phase A was acidified to 3.00 ± 0.1 by adding 0.1% HAc with the aim to protonate all the analytes. The target compounds, which have pKa of ranged from 6.1 to 12.2, should be in the cation form below pH 4 (2 pH rule). Ion pair reagents, sodium 1-hexanesulfonate were used to increase the retention of the analytes. All target substances were detected as single sharp peaks (width 0.057 to 0.071 min) (Fig. 1). Retention times of PYR, GAL, NEO, ESE and DON were 6.734, 7.633, 7.754, 8.498 and 10.374 min, respectively.
Comparison of Four Different SPE Cartridges
Four different SPE cartridges C18 polar plus, Oasis HLB (both reversed phase SPE), Oasis MCX and Oasis
WCX (both ion exchange SPE) were used for the fortification experiments in four replicates. The Oasis MCX, Oasis HLB and C18 polar plus sorbents show similar tendencies. High recovery rates above 80% were only obtained for GAL, ESE and DON. But these cartridges were not efficient to recover PYR and NEO. Only the Oasis WCX (6 mL, 150 mg) sorbent showed high recovery rates for all target compounds in the range of 93.4–96.1% with low relative standard deviations in the range of 0.8 to 2.1 (Fig. 2).
Table 4.Mean recovery and RSD (n=4) of GAL, NEO, ESE and DON in fortification experiment with 200 mL of tap water and wastewater using Oasis HLB cartridge (6 mL, 200 mg) spiked with mixed standard solution at spiking levels of 5, 10, 25 and 50 mg/L
Table 5.Mean recovery and RSD (n=4) of PYR in fortification experiment with 100 mL of tap water and wastewater using Oasis WCX cartridge (6 mL, 500 mg) spiked with standard PYR at spiking level of 5, 10 and 50 mg/L
Tap water Wastewater
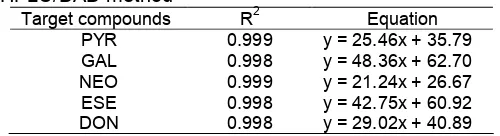
Table 6. Calibration equation and linearity for the HPLC/DAD method
Target compounds R2 Equation
PYR 0.999 y = 25.46x + 35.79
GAL 0.998 y = 48.36x + 62.70
NEO 0.999 y = 21.24x + 26.67
ESE 0.998 y = 42.75x + 60.92
DON 0.998 y = 29.02x + 40.89
compound with the SPE sorbent based on combination between ionic interaction and van der waals interaction.
Determination of the Capacity of WCX Cartridges
The effect of varying the volumes of tap water (100, 500 and 1000 mL) in the loading step were investigated in order to predict the extraction capacity of the Oasis WCX cartridge (6 mL, 500 mg). The recovery rates of NEO and DON were nearly unaffected by the volume of the tap water samples (Fig. 3). However, the recovery rates of PYR were slightly reduced with 500 mL tap water to 93% and further in 1000 mL tap water to 77%. Moreover, the recovery rates of GAL and ESE were drastically reduced with increasing volumes of tap water samples from 88% to 54% and from 92% to 69%.
The reductions of recovery rate of GAL and ESE were not observed when volumes of 500 mL sample were extracted by Oasis HLB (6 mL, 200 mg). Using this larger cartridge size, high recovery rates that ranged from 88.8 to 92.1% except for PYR were obtained. With regard to results with Oasis WCX and Oasis HLB cartridges, the extraction procedure was divided into 2 parts: For PYR the extraction with Oasis WCX (6 mL, 500 mg) was carried out and for GAL, NEO, ESE and DON, Oasis HLB (6 mL, 200 mg) was used.
Fortification Experiments with Tap Water and Wastewater Samples (Accuracy, Precision and Method Quantification Limit)
The optimized SPE procedures and the HPLC/DAD method were applied on spiked tap water and wastewater samples in order to determine the accuracy, the precision, and the quantification limit of the whole method. The fortification experiments for GAL, NEO, ESE and DON were conducted with Oasis HLB (6 mL, 200 mg) cartridges at spiking levels
25 μg/L for tap water and at four spiking levels of 25, 50, 125 and 250 μg/L for wastewater (Table 4). The
recovery rates of the target substances from tap water were in the range of 88.8 to 101.5% while the RSD was in the range of 1.0 to 9.2. According to the criteria of DG Sanco [16], the results were in the acceptable
range of 70-120% with RSD ≤ 20%. The recovery rates
of the target substances in wastewater samples for
spiking levels of 50, 125 and 250 μg/L were also in the
acceptable range of DG Sanco [16]. They ranged between 93.3 and 105.8%, and the RSD values ranged between 1.0 and 12.1%. The RSD values increased in parallel to the decrease of the spiking level. At lowest
spiking level of 25 μg/L, the recovery rates of GAL and
NEO increased to 141 and 134% due to matrix interferences and thus were out of the acceptable range. While the recovery rates of ESE and DON decreased to 82.2% and 83.3%, which was still in the acceptable range. But the RSD of ESE was with 21.8% out of the acceptable range whereas the RSD of DON was with 5.3% still in the acceptable range.
The fortification experiments for analysis of PYR with Oasis WCX cartridges were conducted at spiking
levels of 50 μg/L for tap water and 50, 100, 500 μg/L for
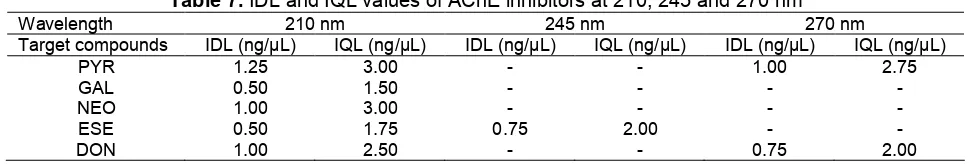
Table 7.IDL and IQL values of AChE inhibitors at 210, 245 and 270 nm
Wavelength 210 nm 245 nm 270 nm
Target compounds IDL (ng/μL) IQL (ng/μL) IDL (ng/μL) IQL (ng/μL) IDL (ng/μL) IQL (ng/μL)
measured at 210 and 270 nm because at low spiking level the interference from the matrix disturbs the PYR peak and may cause false positive detection of the target compounds. In tap water samples measured at wavelength of 210 and 270 nm, the recovery rates were in the range of 103.3 and 105.7%, respectively and the RSD was in the range of 1.0 and 2.0% (Table 5). The recovery rates of PYR from wastewater samples were
conducted at the spiking levels of 100 and 500 μg/L.
They ranged from 95.5 to 105.2% and RSD ranged from 2.0 to 7.2% indicating a good precision. However, at the
spiking level of 50 μg/L, the recovery rate of PYR was
decreased obviously to 87.8% (270 nm) and with an RSD above 20%.
In the frame of this work, the method quantification limits of the target substances were given as the lowest concentration, for which acceptable recovery rates and RSD values were obtained according to the criteria of DG Sanco [16]. In case of tap water, the lowest
concentrations of 25 μg/L were still in the acceptable
range for all target substances. Therefore, the MQL is at
least 25 μg/L. Lower MQL might be reached for GAL,
NEO, ESE and DON if higher volumes of tap water up to 1000 mL would be used for SPE. In case of wastewater for GAL, NEO, ESE and PYR (at 210 nm) the MQL was
reached at a concentration of 50 μg/L whereas DON
could be still quantified with acceptable results at
concentration of 25 μg/L.
Calibration Curves
For the calibration of the target substances, five
concentrations of 5, 10, 25, 50 and 100 ng/μL were
measured with HPLC/DAD. Calibration data for the five substances are shown in Table 6. The correlation coefficients of the linear regression (R2) were higher than 0.998 for all substances indicating a good linearity of the calibration functions in the measured concentration range. The slopes of the equations indicate the absorption intensity of the different target substances. The highest slopes of 48.36 and 42.75 were calculated
for GAL and ESE. The linear regressions of the other substances had about 50% lower slopes.
Instrumental Detection and Quantification Limits
The instrumental detection and quantification limits (IDL and IQL) of all substances were in the range
of 0.50 to 1.25 ng/μL and 1.5 to 3.0 ng/μL, respectively
(Table 7). The sensitivity HPLC/DAD was different for the AChE inhibitors. HPLC/DAD has the highest
sensitivity for GAL and ESE with IDL of 0.5 ng/μL and less sensitive for PYR with IDL 1.25 ng/μL.
CONCLUSION
HPLC/DAD method was developed for the analysis of the 5 AChE inhibitors, PYR, GAL, NEO, ESE and DON in water samples. Ion pair chromatography using sodium 1-hexanesulfonate was used for detection and separation of the target compounds. Fortification experiments with the Oasis WCX cartridge (6 mL, 500 mg) and Oasis HLB (6 mL, 200 mg) was selected for extraction and clean up the water samples. The results of SPE and HPLC/DAD method consistently demonstrated that the accuracy and precision meet the acceptance criteria of recovery
rate of 70-120% and RSD ≤ 20%. The HPLC/DAD
method was linear between concentrations of 5 to
100 ng/μL. The IDL and IQL ranged from 0.50 to 1.25 ng/μL and 1.5 to 3.0 ng/μL, respectively. The MQL
ACKNOWLEDGEMENT
The authors acknowledge the support from Indonesian Directorate General of Higher Education (DGHE) Ministry of Education and Culture Republic of Indonesia.
REFERENCES
1. Doughton, C.G., and Thomas, A.T., 1999, Environ. Health Perspect., 107 (Suppl 6), 907–938.
2. Anonymous, 2009, ADI, Alzheimer’s Disease International, http://www.alz.co.uk/research/ statistics, accessed 15.04.2013.
3. Anonymous, 2007, BfArM, Bundesinstitut für Arzneimittel und Medizinprodukte: zugelassene Arzneimittel,
http://www.bfarm.de/DE/Arzneimittel/3_nachDerZula ssung/zugel_AM/zugel_ AM-node.html, accessed 29.05.2013.
4. Suneetha, D., and Rao, A.L., 2011, Int. J. Pharm. Sci. Technol., 6, 35–43.
5. Santhosam, S.D., Kannan, S., and Devi, S.L., 2010, J. Chem. Pharm. Res., 2 (6), 62–67.
6. Kafkala, S., Matthaiou, S., Alexaki, P., Abatzis, M., Bartzeliotis, A., and Katsiabani, M., 2008, J. Chromatogr. A,1189, 392–397.
7. Mannens, G.S.J., Snel, C.A.W., Hendrickx, J., Verhaeghe, T., Jeune, L.L., Bode, W., Van Beijsterveldt, L., Lavrijsen, K., Leempoels, J., Van Osselaer, N., Van Peer, A., and Meuldermans, W., 2002,Drug Metab. Dispos., 30 (5), 553–563. 8. Barot, T., and Patel, P.K., 2009,E-J. Chem., 6 (2),
594–600.
9. Patel, B.N., Sharma, N., Sanyal, M., and Shrivastav, P.S., 2008,Anal. Chim. Acta, 629 (1-2), 145–157.
10. Chhalotiya, U.K., Bhatt, K.K., Shah, D.A., and Nagda, C.D., 2011,Int. J. Chem. Tech. Res., 3 (1), 112–118.
11. Terry, S., and Teitelbaum, Z., 1991. J. Liq. Chromatogr., 14 (20), 3745–3754.
12. Maláková, J., Nobilis, M., Svoboda, Z., and Lísa, M., 2007,J. Chromatogr. B, 853 (1-2), 265–274. 13. Schönberg, L., Grobosch, T., Lampe, D., and Kloft,
C., 2006,J. Chromatogr. A, 1134 (1-2), 177–185. 14. Abu-Qare, A.W., and Abou-Donia, M.B., 2000, J.
Chromatogr. B, 749 (2), 171–178.
15. Cherstniakova, S.A., Garcia, G.E., Strong, J., Bi, D., Weitz, J., Roy, M.J., and Cantilena, L.R., 2006, J. Anal. Toxicol., 30, 21–26.
16. Sanco, D.G., 2011, Document No.