Kadin Indonesia-Jetro, 2005 www.kadin-indonesia.or.id
IS ASEAN STILL RELEVANT IN THE ERA OF THE ASEAN-CHINA
FTA?
1Tulus Tambunan Kadin Indonesia-Jetro, 2005 I. Introduction
World Bank data show that since the beginning of the 1990s, China accelerated its economic
growth with an annual average rate of as high as 10 percent throughout the 1990s. The 1997–98
Asian financial crisis, which disrupted countries in East Asia, including Indonesia, did not affect
China as severely. On the contrary, the Chinese economy continued to grow at around 7 percent
annually in subsequent years. While the Indonesian economy, thought started to grow positively
since 2000, the progress is still slow.
Recently, the rise of China as a global industrial power and as a regional economic power in
Asia has become popular academic debate. Initially, it was regarded as a threat to other countries in
the region. Not only because of its exported products with much low prices but also its absorption
of a huge amount of foreign direct investment (FDI). But, since the beginning of the 21st century
China’s economic expansion seems to have instead generated confidence among other countries in
the region. The cornerstone of this shift is a framework agreement on comprehensive economic
cooperation between ASEAN and China, including the establishment of an ASEAN–China FTA by
2010 for the original ASEAN members, and 2015 for the new members. As such, China’s
expanding economy is now regarded more as an opportunity than as a threat (Okamoto, 2005).
However, the establishment of ASEAN-China FTA presents a policy question (Wang 2005).
In this paper, the most crucial question is, are individual member countries of ASEAN going to
trade more with China than among themselves as the main aim of the formation of ASEAN. If the
rise of inter-trade between ASEAN and China occurs at the cost of intra-trade within ASEAN, then
the relevancy of ASEAN is indeed a questionable.
With this background, this paper aims to assess the implication of “ASEAN-China FTA” for
ASEAN intra-trade, and likely challenges and opportunities that ASEAN will face. In this effort,
the paper will also discuss selected recent studies investigating whether ASEAN and China are
more competitive or complementary to each other. If they are more or less complementary to each
other, there may be room for them to gain through trade, either through inter-industry trade or
intra-industry trade or both. If they are competitive with each other, on the other hand, there may not be
much room for gain through specialization and trade. The less complementary or the more
competitive are between ASEAN and China, the less negative effect of the formation of
ASEAN-China FTA will be on intra-trade within ASEAN.
1
II. ASEAN Trade
II.1 Intra-and Extra-Trade
Total trade on goods from ASEAN has more than doubled in the last two decades. After has
been declined during the 1997/98 crisis, total trade from ASEAN-6 (Thailand, Singapore,
Indonesia, Malaysia, the Philippines and Brunei Darussalam)had regained again its upward trend
reaching its peak in 2000 when total exports and imports were valued US$ 408 billion and almost
US$ 350 billion, respectively. After declining to US$ 366.8 billion in 2001, as results of the
economic slowdown in the United States (US) and European Union (EU) and the recession in
Japan, ASEAN-6 exports recovered in 2002 when it was valued at US$ 380.2 billion and continued
to increase in 2003. Total imports of ASEAN 6 also show an upward trend since the crisis.
Total trade (exports + imports) of a regional integration is the sum of intra-trade among
member countries of the integration and inter- or extra-trade between the integration and the rest of
the world. To answer the question whether the formation of ASEAN-China FTA will increase trade
between the two regions at the cost of intra-ASEAN trade, the long-term development of the
structure of ASEAN total trade must be examined first. This can be done in the following stages.
First, trends of development of extra- and intra- trade of ASEAN-8 (ASEAN 6 plus Myanmar and
Cambodia) is illustrated in Graphic 1. As can be seen, the gap is obvious. In 2003, total value of
extra-trade of ASEAN-8 reached more than 600 billion US dollars, while their intra-trade is less
than 200 billion US dollars.
Graphic 1: Trends of Extra-and Intra-Trade of ASEAN 8, 1993-2003 (000 US$))
0.00 100,000,000.00 200,000,000.00 300,000,000.00 400,000,000.00 500,000,000.00 600,000,000.00 700,000,000.00
1993 1994 1995 1996 1997 1998 1999 2000 2001 2002 2003
Total Intra-Trade Total Extra-Trade
Source: ASEAN Trade Statistics Database, ASEAN Secretariat Office
Second, Graphic 2 shows the long-term development of extra-and intra-trade of ASEAN-8 in
more detail by export and import. As can be seen, for both export and import, the average growth
in extra-trade is much higher than that in intra-trade. More interestingly, it shows that since the
1997/98 crisis, ASEAN has gained surplus in its extra-trade and it is much larger than the annual
surplus in its intra-trade. This may suggest that the depreciation of some of ASEAN currencies (i.e.
rupiah and bath) has given more benefit to ASEAN in its extra-trade than intra-trade. Overall,
Graphics 1 and 2 suggest that regions outside ASEAN are still the most important markets for
individual ASEAN member countries, for both export and import needed.
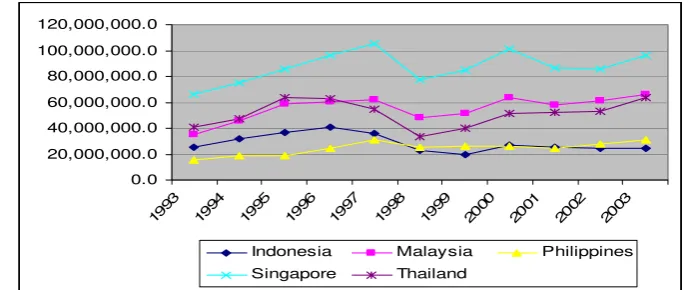
In value, after Singapore, Malaysia is the member country with the largest extra-ASEAN
export, followed by Indonesia (Graphic 3). But, as a percentage of country’s total trade, the
Philippines has the largest share in extra-export at 84%, followed by Indonesia and Thailand both
with 81% (Table 1). With respect to extra-import, Thailand and Malaysia are the two member
countries after Singapore, which imported a lot from non-ASEAN markets (Graphic 4). But, in
relative terms, Thailand, the Philippines and Indonesia have the largest shares at 85% (see Table 1).
Graphic 2: Values of Extra-and Intra-Trade of ASEAN 8 by Export and Import, 1993-2003 (000 US$)
1993 1994 1995 1996 1997 1998 1999 2000 2001 2002 2003
Extra-ASEAN 8 Exports Extra-ASEAN 8 Imports Intra-ASEAN 8 Exports Intra-ASEAN 8 Imports
Source: ASEAN Trade Statistics Database, ASEAN Secretariat Office
Graphic 3: Trend of Extra-ASEAN Exports by Selected Member Country, 1993-2003 (000 US$)
Source: ASEAN Trade Statistics Database, ASEAN Secretariat Office
Graphic 4: Trend of Extra-ASEAN Imports by selected member country, 1993-2003
Source: ASEAN Trade Statistics Database, ASEAN Secretariat Office
Table 1: Extra-and Intra-Trade by Export and Import of Selected ASEAN Countries (%), 2003 Source: ASEAN Trade Statistics Database, ASEAN Secretariat Office
Second, and probably this is the most important integration indicator, Graphic 5 shows trend of
development of extra-export and -import as a percentage of respectively total ASEAN exports and
imports. This indicator measures the relative importance of internal market within the ASEAN
market. As can be seen, although both trends decline during the period reviewed, the ratios are
above 50%, and the import share is higher than the export share. This indicates that, from the
export side, the rest of the world (certainly including China) is still the most important sources for
export growth from ASEAN, and, from the import side, the majority of products needed by
ASEAN consumers and producers are supplied by the rest of the world.
Graphic 5: Trend of Extra-Exports and -Imports of ASEAN by Selected Member Country, 1993-2003 (% of total ASEAN Exports and Imports, respectively)
70.00
1993 1994 1995 1996 1997 1998 1999 2000 2001 2002 2003
Extra Export-Total Export Extra Import-Total Import
Kadin Indonesia-Jetro, 2005 www.kadin-indonesia.or.id Thus, based on the figures shown so far, now the question is why ASEAN member countries
trade more with the rest of the world rather than among themselves despite the lowering of tariff
rates and the removal of non-tariff barriers (NTB)
enjoyed by the member countries? Probably the answer is as what Langhammer and Hiemenz
(1990) stated that regional integration among developing countries often fails to lead to
materialized expected benefits, partly because there is little scope either for inter-industry or
intra-industry specialization among member countries, as they tend to possess comparative advantage in
the same products.
II.2 Trading Partners
The above chapter has shown that the ASEAN has traded more with the rest of the world than
within the integration.
The question now is how important China including Hong Kong has been relatively to the rest
of the world as the ASEAN trading partner. This can be seen from the geographical distribution of
ASEAN’s exports and imports to its major trading partners during the period 1995-2003, as shown
respectively in Graphics 6 and 7. Three important points warrant noting. First, China is not the
main important market for ASEAN exports, although during that period the share of China in
ASEAN’s total export has risen rapidly. Up to 1990s, imports into China from ASEAN were
mainly raw materials-based/primary products including iron-ore sand, chromium ore, wood & wood articles, mineral fuels, leather products and textile materials. But, in the last few years, exports from ASEAN to China have moved up the value-added ladder. Electrical and electronic
products, machinery, and nuclear boiler and parts from some ASEAN member countries have
penetrated Chinese market. There is, therefore, increasing evidence of intra-industry trade in these products between ASEAN (at least with some member countries) and China (Shafaeddin, 2002).
From the Chinese side, ASEAN is also not important as its trading partner based on the
ASEAN share in the country’s total trade. Even in Asia, more than half of China’s imports are from
newly industrialized countries (NICs) and Japan. Low production costs have attracted the
relocation of less dynamic industries from NICs as well as Japan to China. The largest trade deficit
of China has been with Taiwan Province of China, i.e. more than US$15 billion in 2000. If
products sold by Taiwan Province of China enterprises in the mainland were to be included, the
figure would be much larger. Japan is China’s largest trading partner in Asia. Trade with the
Republic of Korea grew fast from very low level in the early 1990s to over US$30 billion in 2000
(ADB, 2002).
Second, ASEAN imports more from than export to China. Based on this trade structure
between the two regions, it is much likely that when ASEAN-China FTA is implemented China
China varies among member countries, so the implication of the ASEAN-China FTA would also
vary among the member countries.
This is also the reason that in the era of ASEAN-China FTA, members of ASEAN are
expected to face particularly intense competitive pressure from China in view of the overlap in
relative factor endowments. Some studies warn that the “China threat” to ASEAN may be
immediate and severe in labour-intensive products in which China has a strong comparative
advantage, but could move on to impact the broader technological spectrum.2.However, such
negatives from stiffened competition could be outweighed by the potential for mutually beneficial
and complementary relationships that may accrue to its trading partners from China’s economic
growth and trade expansion. It is thus important to understand the relative performances of China
and ASEAN countries over time, as well as the intensity and changing dynamics of their
intra-regional economic interactions.
Graphic 6: Share of ASEAN's exports to major trading partners: 1995 and 2000 (A)
(B) 2002
2
Kadin Indonesia-Jetro, 2005 www.kadin-indonesia.or.id
2003
Source: ASEAN Trade Statistics Database, ASEAN Secretariat Office
Graphic 7: Share of ASEAN's imports from major trading partners: 1995 and 2000 (A)
(B) 2002
2003
Source: ASEAN Trade Statistics Database, ASEAN Secretariat Office
.
III. Possible Trade Diversion from ASEAN towards China
As said before, the ASEAN-China FTA presents a question: are individual member countries
of ASEAN going to trade more with China than among themselves, whereas, the main aim of the
establishment of ASEAN is to increase trade among member countries. If the rise of inter-trade
between ASEAN and China occurs at the cost of intra-trade within ASEAN, then the relevancy of
ASEAN is indeed a questionable. In other words, the existence of ASEAN is not relevant any more
if the formation of the ASEAN-China FTA creates trade diversion from ASEAN towards China.
The main reason of raising this question is because no common conclusion has been reached
yet about which party will benefit more from the ASEAN-China FTA, whether ASEAN or China,
and so far empirical studies estimating the possible TD effects on intra-trade ASEAN of the
formation of the FTA are very few. There are studies arguing that trade integration between
ASEAN and China will be more in favour of China. Tongzon (2005), for instance, finds that China’s top export industries, which account for 84% of its total exports, are also ASEAN’s major export industries. He argues that trade integration between ASEAN and China in the form of a FTA can be expected to increase the competitive pressures on ASEAN producers. So, this will say that if all ASEAN member countries are defeated in competition with China for certain goods, than the formation of the ASEAN-China FTA will certainly create TD among the member countries or reduce intra-ASEAN trade for that particular products. The main reason for that according to Tongzon (2005) is simple: it is because China has competitive advantages in both wages and labor productivity relative to ASEAN in many industries. The empirical analysis of Voon and Yue (2003) also indicates that China has a competitive advantage over ASEAN in manufacturing exports. Wong and Chan (2002) point out that China poses a more competitive threat to the ASEAN
Kadin Indonesia-Jetro, 2005 www.kadin-indonesia.or.id economies as it moves up the manufacturing value chain away from labor-intensive products toward capital- and technology-intensive products.
However, there are also studies which expect that the formation of the ASEAN-China will benefit both parties, or will have not so great impact. Laurenceson (2003), for instance, finds that there is already a high degree of integration between ASEAN and China in trade of goods and services, which implies that the impact of the formation of the ASEAN-China FTA may be quite limited. Chirathivat (2002) finds that both ASEAN and China should experience net trade gains from the ASEAN-China FTA, with TC more than offsetting TD. He argues that under the ASEAN-China FTA, ASEAN may play a bigger role in satisfying China’s growing appetite for imported raw materials and intermediate inputs, while China may play an important role with respect to other goods and services.
III.1 Analytical Approaches
In the literature on economic integration, an economic integration generates trade creation (TC) but also trade diversion (TD) for individual member countries. In the case of TD, higher cost imports from a bloc member replace lower cost foreign supplies and the economic integration (or FTA) is said to be “trade diverting” from the most efficient supplier. As a further effect, world trade is reduced and at least one country is made worse off if the external tariff is greater than the cost difference between the FTA and non-member sources. In this paper, however, the meaning of TD is rather different: it is higher cost imports from a member country (or higher cost intra-trade) within ASEAN are replaced by lower cost supplies from China (a non-member country). In other words, the ASEAN integration with China is said to be “trade diverting” from intra-trade towards extra-trade. Since China’s products are cheaper than those produced within ASEAN, then it is of course good for the ASEAN economy; specifically, it generate higher consumer surplus in ASEAN. However, from the point of view of ASEAN aiming to generate trade among member countries, the TD is a negative effect. TC, on the other hand, is a positive effect, meaning that extra-trade of individual member countries or ASEAN as a group increases when China freely enters the ASEAN market without reducing intra-ASEAN trade.
Kadin Indonesia-Jetro, 2005 www.kadin-indonesia.or.id
China, good X from Indonesia is artificially cheaper than that from China. Now, with the ASEAN integration with China, good X from Indonesia in Malaysian domestic market is replaced by the same good from China. The ASEAN-China FTA creates trade between Malaysia and China at the cost of intra-ASEAN trade between Indonesia and Malaysia. In this case, Indonesia suffers TD.
The possibility of TD of the formation of the ASEAN-China FTA can be estimated by different approaches. The first one, commonly used in the literature, is by using rank correlation: In this approach, as the first stage, all export items of China and those of its competitors are ranked in order of their revealed comparative advantage (RCA) indexes. The RCA index is calculated as follows:
RCAij = (Xij / ÓXij) / (Xiw / ÓXiw),
where Xij is the export value of product group i of country j , ÓXij is the total export value of country j , Xiw is the world export value of product group i , and ÓXiw is the total world export value. RCA ij exceeding 1 indicates that country j has a comparative advantage in the production of product i in the global economy. RCA ij less than 1 indicates the opposite. The indexes for each product show the ability of each country to gain market share in that product in the international market.
After that, say, the 20 or 50 fifty items are chosen for each country and the index of spearman rank correlation between the related export items of China and each of the selected countries is then calculated. The coefficient correlations equal to unity implies a maximum degree of competition between China and the country concerned. The lower the coefficient, the lower the degree of rivalry between China and the country concerned in international market for the related products.
The second one, which is also often adopted in many studies, is to compare the export similarity index (ESI) between member and non-member countries to the union’s market.3Assume there are two countries in ASEAN: Indonesia (I) and Malaysia (M) and one non-member country: China ©. Indonesia and China export to Malaysia, so let ESIIC→M
denote the ESI between Indonesia and China to the market in Malaysia, then the index is defined as below:
ESIIC→M ≡ {∑I min[Xi; I→M , Xi; C→M]}
where Xi; I→M is Indonesian export share of commodity i to Malaysia, and Xi; C→M is China’s
export share of the same commodity to Malaysia. Clearly, the index is between zero (0)
3
Kadin Indonesia-Jetro, 2005 www.kadin-indonesia.or.id and one (1). If the commodity distribution of exports to Malaysia from Indonesia and China are identical, the ESI = 1, and if they are totally different then the index is zero (0). The larger ESIIC→M is, the more similar or overlapping of Indonesian and China’s export
structure to Malaysia, and indicates that Malaysia or Indonesia (and hence ASEAN) will more likely suffer TD from lifting bilateral tariffs between ASEAN (or Malaysia) and China.
Thus, how serious Indonesia (or other individual member countries) will suffer TD from granting a tariff reduction/lifting to China depends on how similar the exports of China and that of Malaysia are to Indonesia. Although the index has its virtues in less data dependency, by requiring only export data, which are available on a standardized basis for all countries, this approach has several shortcomings, which is summarized by Huang (1996) as follows: (i) he index tends to shift over time due to a trade structural change, and detracts from their usefulness in predicting TD; aggregation bias may affect the analysis and hence yields a result which may not reflect what is really happened; an overall similarity index may not be very meaningful to measure TD, because the degree of tariff reduction may vary by good (so this tool may not be useful to examine TD in this case of ASEAN plus China); the index may fail to reflect dynamic changes in the market; and the index may be incapable of identifying TD in the case of intra-industry trade.
Another easily observable shortcoming can be explained as follows: suppose there are three ASEAN countries: Indonesia (I), Thailand (T) and Malaysia (M), and one non-member, China ©; and Indonesia, Thailand and China export to Malaysia. Suppose, ESIIC→M = ESICT→M = ESICT→M = 1, because the export shares to Malaysia are identical
among the three. This identical ESI may conclude that there is no difference in the TD effect between Indonesia and Thailand. However, this conclusion may be wrong, because at the same time it can be that both Indonesia (or Thailand) and Malaysia have the same pattern of trade with China; whereas, on the contrary, the pattern of trade between China and Thailand (or Indonesia) is just the opposite. This means that Indonesia (or Thailand) and Malaysia they are similar for their comparative advantage. In this case, intuitively, the trade similarity of Indonesia (Thailand) and Malaysia for their trade pattern with China implies that Indonesia (or Thailand) will suffer more a TD effect from the implementation of ASEAN plus China than Thailand (or Indonesia) does.
Alternatively, Huang (1996) developed an index, called the trade similarity index (TSI). First, the trade specification index SI(k), i→j is defined as follows:
Kadin Indonesia-Jetro, 2005 www.kadin-indonesia.or.id where X(k), i→j is the export value of good k from country i to j and M(k), i→j is the
corresponding import value. The index is between -1 and 1: SI(k), i→j ≥ 0 implies country i is
a net exporter of good k to country j; SI(k), i→j = 1 indicates a one-way export of good k
from country i to country j (country i exports good k to country j but country j (i) does not export (import) good k to (from) country i (j); SI(k), i→j ≤ 0 means that country i is a net
importer of good k from country j; and SI(k), i→j = -1 implies a one-way export of good k
from country j to country i.
In the case of ASEAN plus China, then the TSI can be defined between Indonesia (I) and China © for domestic market in Malaysia (M), denoted by TSIIC→M, as follows:
TSIIC→M ≡ correlation (SII→M, SIC→M)
i.e., the correlation coefficient of SII→M and SIC→M.
Suppose there are three member countries of ASEAN, i.e. Indonesia (I), Malaysia (M) and Thailand (T). Thus, If TSIIC→M > TSIIT→M , it means that Indonesia’s trade pattern with
Malaysia is more similar with China’s than with Thailand’s. Thus, if ASEAN (or in this case, Malaysia) forms a FTA with China, then Indonesia will suffer more from TD than Thailand does.
III.2 Some Findings
Selected Studies with the Rank Correlation Approach
Kadin Indonesia-Jetro, 2005 www.kadin-indonesia.or.id
because, capital and intermediate goods are important in their export structure. With these findings, the study concludes that the implementation of the ASEAN-China FTA will most likely to lead to TD to these ASEAN countries for many products of which they have similarities with China in their pattern of RCA and export structure.
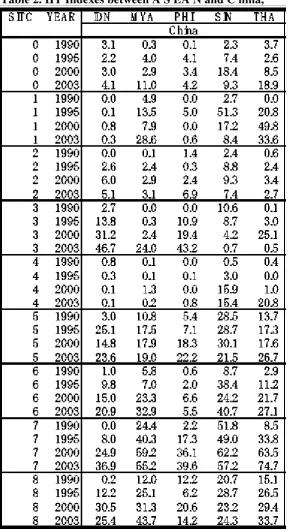
Another most recent study is from Yumiko (2005). She also calculated the RCA indexes for each ASEAN member (Indonesia, Malaysia, Philippines, Singapore and Thailand) and China (including Hong Kong) at the two-digit level of SITC R.1.4Then, the indexes are ranked for each country respectively and Spearman’s rank correlation coefficients between the rankings of RCA indexes is calculated between ASEAN and China. If the coefficient is positive and statistically significant, their trade structure is very similar and competitive. This implies that there may not be much room for ASEAN and China to gain from the ASEAN-China FTA. If the coefficient is negative and statistically significant, on the other hand, their trade structure is very different and complementary to each other. In this case, the formation of the ASEAN-China FTA could bring about substantial gains through inter-industry specialization. The study consists of two form of trade: inter-industry trade and intra-industry trade (IIT).5With respect to the first form of trade, the findings show that both Thailand and the Philippines possess high Spearman’s rank correlation coefficients with China, and in most of the years the coefficients are statistically significant. This means that both Thailand and the Philippines have a trade structure, which is quite similar to that of China. These statistical results imply that the inter-industry specialization may not develop much between the Philippines and Thailand) and China, even if the closer economic cooperation is promoted between the two. Spearman’s rank correlation coefficients are, on the other hand, low or even negative between other three ASEAN countries (Indonesia, Malaysia and Singapore), and China. Moreover, none of the coefficients are statistically significant. This implies that it is indeterminate whether both groups are more competitive or complementary to each other. In other words, in some respects their trade structures may be very similar and competitive, and in other respects they may be very dissimilar and complementary to each other between two countries.
4
India is also included in the study, which is not relevant to be discussed in this paper. 5
The IIT index is calculated as follows:
Table 2. IIT Indexes between A S EA N and C hina,
Notes: (a) SIT CR10: Food and live animals; SIT CR11: Beverages and tobacco; SIT CR12: Crude materials, inedible SIT CR13: Mineral fuels; SIT CR14: Animal and vegetable oils and fats; SIT CR15: Chemicals; SIT CR16: Basic manufacturers; SIT CR17: Machinery; S IT CR18: Miscellaneous manufactured goods; (b) IIT indexes were originally calculated, using UN COMTRADE, at the four-digit level of SIT CR1. The author aggregated them into the one-digit level IIT index using the trade share
Source: Yumiko (2005).
China FTA may be quite different among ASEAN members. Thus, unlike the case of Europe, her study’s findings suggest that the flexibility is necessary in the implementation of the closer economic cooperation between ASEAN and China, or vise versa.
Graphic 8: Matrix of RCA Index and IIT Index
Source: from Figure 1 in Yumiko (2005).
An analysis with the Trade Similarity Index
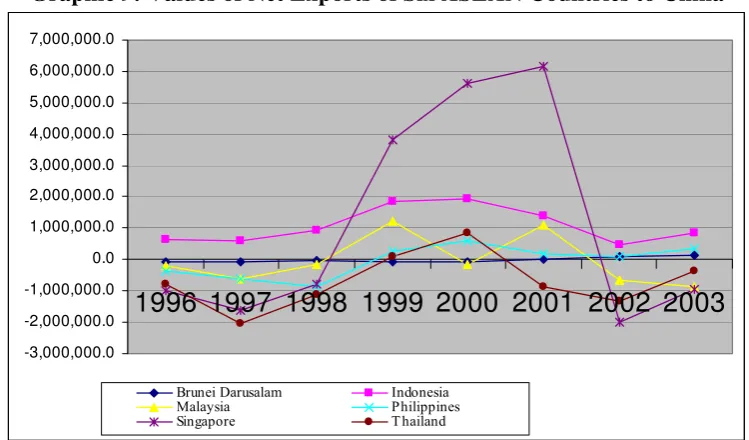
As explained in Section III.1, Trade Similarity Index is basically a comparison of trade patterns, measured by Trade Specification Index of countries. By using data on total trade on goods and services, Graphic 9 shows the values of net export (exports-imports) to China from six (6) ASEAN member countries. During that whole period reviewed, only Indonesia that has positive value of net exports to China, mainly because the main important component of Indonesian export to that country is oil and gas and some agricultural commodities including crude palm oil (CPO). However, in some years within that period, the value of net exports of Singapore to China appears as the largest within the six countries.
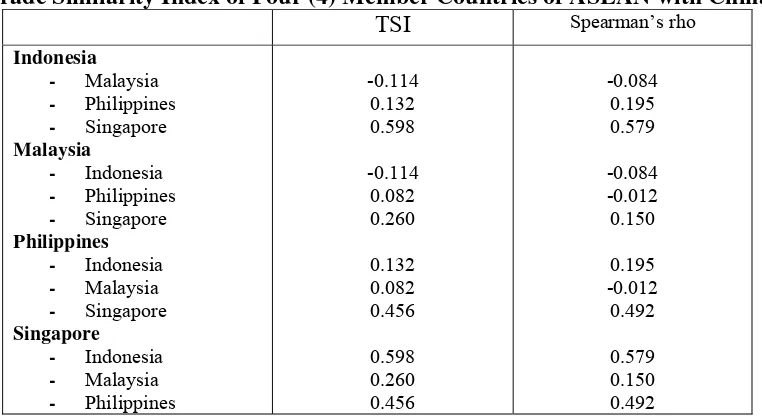
Next, Tables 3 and 4 present the calculated trade specification index and trade similarity index, respectively, of four (4) ASEAN countries with China. This analysis is based on data on total trade with China; not by commodity. As can be seen, none of these four countries was a net exporter with China for the whole period. However, Indonesia appears to be much better than the other three countries, since only in 1994 that the country was a net importer. Table 4 shows that, with respect to Indonesia, TSIIS→C > TSIIF→C >
TSIIM→C; as also indicated by the Spearman index of almost 0.58. This reflects that
suffer more from TD than Philippines and Malaysia will. From the Malaysian perspective, the ASEAN-China FTA will make Malaysia or Singapore suffer more from TD than Philippines and Indonesia, and so on.
Overall, with the formation of the ASEAN-China FTA, Indonesia or Malaysia will suffer more from TD than other ASEAN member countries. Of course, by commodity there will be variation in TD tendency, as already suggested by other studies discussed above. For some commodities in which Indonesia has trade pattern with China which is similar to (some) other ASEAN member countries, Indonesia will face more possibility of TD, while for other commodities in which Indonesian-China trade pattern is not similar to other member countries’ trade pattern with China, Indonesia is expected to gain more extra-ASEAN trade with China without loosing its intra-ASEAN trade with other member countries.
Graphic 9: Values of Net Exports of Six ASEAN Countries to China
-3,000,000.0
1996 1997 1998 1999 2000 2001 2002 2003
Brunei Darusalam Indonesia
Malaysia Philippines
Singapore T hailand
Source: ASEAN Secretariat (database).
Table 3
Trade Specification Index of Four (4) Member Countries of ASEAN with China Indonesia Malaysia Philippine Singapore
Kadin Indonesia-Jetro, 2005 www.kadin-indonesia.or.id Table 4
Trade Similarity Index of Four (4) Member Countries of ASEAN with China TSI Spearman’s rho
No doubt, ASEAN as a group or individual members will face challenges as well as opportunities from the formation of the ASEAN-China FTA. From the ASEAN export side, China with more than one billion people and increasing income per capita is certainly a huge market opportunity for ASEAN. As shown in this paper, although ASEAN has not yet been in the first rank of the most important trading partners of China, trade between China and this region continued to increase. From the ASEAN import side, the serious challenge facing individual member countries is the competition between domestic products with imported products from China. One thing for sure, individual members of ASEAN will face particularly intense competitive pressure from China in view of the overlap in relative factor endowments. The “China threat” to ASEAN may be immediate and severe in labour-intensive products in which China has a strong comparative advantage.
Kadin Indonesia-Jetro, 2005 www.kadin-indonesia.or.id goods from countries outside ASEAN, including China. Thus, this is the most challenge for ASEAN.
References
Adhikari, A. and Y. Yang (2002), “China’s Increasing Openness: Threat or Opportunity?”, Asian Development Bank, mimeo (February).
ASEAN-China Expert Group on Economic Cooperation (2001), “Forging Closer ASEAN China Economic Relations in the 21st Century”, mimeo , October, Jakarta.
Asher, M., R. Sen and S. Srivastava (2003), “ASEAN-India: Emerging Economic Opportunities”, in F. Grare and A. Mattoo (eds.), Beyond the Rhetoric: The Economics of India’s Look-East Policy, New Delhi: CSH-Manohar.
Asian Development Bank (ADB) (2002), Key Indicators of Developing Asian Pacific Countries, XXXIII, Manila: ADB.
Banerjee, S. (2002), “Recovery and Growth in Indonesian Industry – Elements of a Future Policy Framework”, UNSFIR Working Paper No. 02/08, Jakarta, (www.unsfir.or.id).
Bhaskaran, M. (2003), “China as Potential Superpower: Regional Responses”, Deutsche Bank Research Report, January 15.
Fernald, J.H. Edison and P. Lougani (1999), “Was China the First Domino? Assessing Links Between China and the Rest of Emerging Asia”, Journal of International Money and Finance, 18: 515-536.
Chirathivat, Suthiphand (2002), “ASEAN-China Free Trade Area: Background, Implications and Future Development,” Journal of Asian Economics13(5).
Chirathvat, Suthiphand and Sothitorn Mallikamas [2005] “The Potential Outcomes of China-ASEAN FTA: Politico-Economic Implications for Participating Countries,” in Ho Khai Leong and Samuel C. Y. Ku (eds.). China and Southeast Asia: Global Changes and Regional Challenges. Singapore: Institute of Southeast Asian Studies:
Finger, J.M. and M.E. Kreinin (1979), “A Measure of ‘Export Similarity’ and its Possible Uses”, The Economic Journal, 89: 905-912.
Garnaut, R. and K. Anderson (1980), “ASEAN Export Specialization and the evolution of Comparative Advantage in the Western Pacific Region” in Ross Garnaut (ed.), ASEAN in a Changing Pacific and World Economy, Canberra: ANU Press.
Huang, Deng-Shing (1996), “On the prediction of TD under intra-industry trade with an application to NAFTA and Taiwan”, Discussion Paper No.9605, February, The Institute of Economics Academia Sinica, Taipei.
Kadin Indonesia-Jetro, 2005 www.kadin-indonesia.or.id Kwan, C.H. (2002), ‘The Rise of China and Asia’s Flying-Geese Pattern of Economic
Development: An Empirical Analysis Based on US Import Statistics’, NRI Papers No.52, Nomura Research Institute, Tokyo.
Lall, S. and N. Albaladejo (2001), “The Competitive Impact of China on Manufactured Exports by Emerging Economies in Asia”, a paper prepared for UNIDO, Queen Elizabeth House, University of Oxford.
Lall, S. (2003), “Assessing Industrial Competitiveness: How Does Singapore Fare?”, in R. Rajan (ed.), Sustaining Competitiveness in the New Global Economy: A Case Study of Singapore, Cheltenham: Edward Elgar for IPS.
Langhammer, R. J. and Ulrich Hiemenz (1990), “Regional Integration among Developing Countries: Opportunities, Obstacles and Options.” Kieler Studien; 232.
Laurenceson, J. (2003), “Economic Integration Between China and the ASEAN-5,” ASEAN Economic Bulletin20(2).
Lien, J. (2002), “Bush Targets FTAs with More ASEAN Nations”, Business Times, Singapore, October 28.
Li, Yuefen (2002), “China’s Accession to WTO: Exaggerated Fears?”, Discussion Papers No.165, November, UNCTAD.
Martin, W. and E. Ianchovichina (2001), “Implications of China’s Accession to the World Trade Organisation for China and the WTO’, The World Economy, 24:1205-1219.
Mattoo, A. (2002), “China’s Accession to the WTO: The Services Dimension”, Policy Research Working Paper No.2932, The World Bank, Washington D.C.
Okamoto, Yumiko (2005), “China and India: Challenges and Opportunities for ASEAN from Japanese Perspectives”, paper presented at the 30th Annual Conference of the Federation of ASEAN Economic Associations (FAEA), November 24-25.
Pomfret, R. (1981), “The impact of EEC enlargement on non-member Mediteranean countries’ exports to the EEC”, Economic Journal, 92: 726-30.
Sakakibara, Eisuke and Sharon Yamakawa (2002), “ Regional Integration in East Asia: Challenges and Opportunities”, World Bank East Asia Project, World Bank.
Shafaeddin, S.M. (2002), “The Impact of China’s Accession to WTO on the Exports of Developing Countries”, Working Paper No.160, June, UNCTAD.
Srivastava, Sadhana and Ramkishen S. Rajan (2003), ”Implications of the Economic Rise of the PRC for ASEAN and India: Trade and Foreign Direct Investment”, IPS Working Papers No.14, November, South Asian Studies Programme, National University of Singapore, Singapore
Tongzon, J. (2005), “ASEAN-China Free Trade Area: A Bane or Boon for ASEAN Countries?” World Economy28(2).
Kadin Indonesia-Jetro, 2005 www.kadin-indonesia.or.id Wang, Vincent Wei-cheng (2005) “The Logic of China-ASEAN FTA: Economic Stagecraft of “Peaceful Ascendancy.” in: Ho Khai Leong and Samuel C. Y. Ku (eds). China and Southeast Asia:
Global Changes and Regional Challenges. Singapore: Institute of Southeast Asian Studies.
Wong, J. and Chan, S. (2002), “China's Emergence as a Global Manufacturing Centre: Implications for ASEAN,” Asia Pacific Business Review9(1).
World Bank (2003b), East Asia Integrates: A Trade Policy Agenda for Shared Growth, World Bank Report, Advance Edition, Washington.