1
I. MONETARY POLICY STATEMENT
The global economic recovery is moving forward although overshadowed with uncertainty. Differences have emerged in the pace of global recovery, with growth slackening in advanced economies in contrast to moderate growth in emerging markets. The slowdown in developed nations is also accompanied by considerable uncertainty with manufacturing activity losing steam and consumption held down by high levels of unemployment. Added to this, the yen and euro appreciation against the US dollar has impacted exports from Japan and Europe. The slackening growth in advanced economies is also impacting growth in emerging markets, and particularly export-dependent countries. To resolve this, monetary policy in advanced nations has retained an accommodative bias while emerging market nations are moving forward with policy normalisation. On global financial markets, signs of renewed growth in stock indices were driven in part by signals of the second round monetary stimulus to be launched by developed economies. This is one of the push factors behind the rush of capital flows into emerging economies, including Indonesia. Added to this are the pull factors of strong economic fundamentals, high returns and improving perceptions of risk in emerging economies.
At home, the economy is growing at an accelerated rate on the back of consumption and rising investment. Evaluation of the economy's performance and outlook points to overall improvement. Buoyant domestic consumption is supported by a range of factors, including more robust purchasing power, increased support from financing and stronger business and consumer confidence. Alongside this, investment levels are improving in keeping with the launching of policies to support investment activities, improved market perceptions of the economy, increased availability of financing and lower prices for imported capital goods. In other developments, exports have maintained buoyant growth strong despite some slowing in comparison to the previous period, bolstered by high levels of growth in trading partners and the sizeable contribution of resource-based commodities.. An added factor in the upbeat export growth is the mounting trend in commodity prices.
Indonesia’s balance of payments has recorded yet another estimated surplus. Key to this was the performance of the capital and financial account, marked by heavy inflows of capital into financial instruments such as Indonesian government securities and Bank Indonesia Certificates (SBIs). In the current account, exports continue to forge ahead albeit at a slower pace compared to the preceding month and accompanied by brisk import growth. The steep rise in imports comes in response to buoyant domestic economic activity and the continued high level of exports. Taken together, international reserves at the end of October 2010 reached 91.8 billion US dollars, equivalent to 6.9 months of imports and servicing of official external debt.
During October 2010, the rupiah maintained an appreciating trend buoyed by positive global sentiment towards the Indonesian economy and secure domestic fundamentals. During the period under review, the rupiah averaged Rp 8,929 to the US dollar, representing a gain of 0.6% (mtm). At end-October 2010, the rupiah closed at Rp 8,938 per US dollar, or down 0.15% (ptp) from end-September 2010. The rupiah gains were accompanied by reduced volatility. During October 2010, rupiah volatility averaged 0.1%, down from 0.2% one month earlier.
2 Indonesia, potential still exists for future increases in inflationary pressure fuelled by the sustained upward trend in international commodity prices, the unabated anomalies in weather patterns that pose a threat to production and distribution of food staples and surging demand as the end of the year draws near.
Domestic financial market performance has steadily improved as reflected in the record high in the Indonesian stock index (JCI) and diminishing yield on Indonesian government securities in all tenors. The upswing in financial market performance resulted mainly from the heavy influx of foreign capital inflows. In the area of monetary policy transmission, bank interest rates continue to ease. Rates for bank deposits and credit showed further decline, although at a more modest rate and with a narrowing spread. In the credit channel, credit expansion mounted higher on the strength of consumption credit, despite increased contributions from investment credit and working capital credit. Economic liquidity has also expanded alongside the mounting pace of economic activity. The banking system still carries ample liquidity, with banks facing no difficulties in complying with the 8% statutory reserves requirement.
Financial system stability remained firm with support from the robust condition of the banking sector with regard to various risks and improvement in the banking intermediation function. This is indicated, among others, by the high CAR, now at 16.4%, and the prudent NPLs gross ratio at below 5.0%. Improvement in banking intermediation was reflected in the rate of credit expansion, which climbed to 21.9% (yoy) by end-October 2010. At this level, bank credit expansion is on track with the projected range in Business Plans prepared by banks at 22%-24%. Similarly, credit expansion for the calendar year (ytd) is now positive in all sectors.
Bank Indonesia is confident of the outlook for improving economic conditions, marked by rising GDP growth, inflation at a comfortably safe level in line with the established targeting range and prudently managed financial stability.
3
II. THE ECONOMY AND MONETARY POLICY
Indications point to a levelling off in global economic recovery caused by slowing recovery in advanced nations. This has also led to weakening global demand that in turn has impacted export performance in emerging market economies. Global inflationary pressure also remains subdued in line with the flagging pace of global economic activity. In Indonesia, the domestic economy charted further improvement with growth driven primarily by consumption and stronger investment. In analysis by sector, the non-tradable sectors forged ahead with vibrant growth ahead of the stable growth in tradable sectors.
Developments in the World Economy
Global economic recovery is showing signs of losing momentum due to weakening industrial performance and high unemployment in advanced economies. This is confirmed by slowing performance in industrial production and the purchasing managers index (PMI) indicator of manufacturing activity in developed economies. The consumption sector is also constrained by high unemployment. This has led to slackening global demand and portends to bear down on export performance in emerging market economies and particularly export-dependent countries. Meanwhile, pressure from global inflation in developed nations remains generally low, with economic activity still some distance from full recovery. These are the background considerations in decisions to retain accommodative policies in advanced economies. On the other hand, inflationary pressure in emerging market nations has moderated in response to the monetary policy tendency to hold back from interest rates hikes and the onset of slowing economic expansion. In Asia and Latin America, emerging market countries are still moving forward with policy normalisation measures. In addition, some countries have adopted a combination of policy instruments to halt the appreciation of their currencies.
US economic growth continues to decline. Although conditions on the labour market are improving, high unemployment figures have deterred households from indulging in consumption. Uncertainty over economic conditions has also depressed expectations for the future of the economy, as evident in the downward trend in consumer confidence (Graph 2.1). On the production side, manufacturing activity has begun showing decline. Weak household demand has brought about a slowdown in industry performance, as evident the declining levels of the manufacturer PMI, production index and capacity utilisation (Graph 2.2).
Japan's economy has slowed due to weakening exports. The yen appreciation against the US dollar has borne down on Japan's export and manufacturing performance. Production indicators underwent renewed contraction in monthly figures alongside decline in capacity utilisation. In a similar vein, retail sales, household expenditures and other indicators of consumption remain under pressure from high unemployment, despite the level easing to 5.1%.
4
Jan-08 May-08 Sep-08 Jan-09 May-09 Sep-09 Jan-10 May-10 Sep-10
Consumer Confdt (Conf. Board)
Present Sentiment (Univ.Michigan) ‐(RHS)
Index
Industrial Production Capacity Utilitization (RHS)
Sumber: Bloomberg
%mom %
...sd Sep 2010
Graph 2.2
US Production Index and Capacity Utilization
The decision by central banks in developed nations to maintain low interest rates alongside the second round of monetary stimulus packages prompted a rally on global stock markets. In advanced economies, action by central banks such as the Fed, BoJ and BoE to boost economic recovery with a second stage monetary stimulus have prompted bullish activity on stock markets. Added to this, the downward trend in the US dollar, stronger economic data from China and the solid condition of listed company financial statements has bolstered positive sentiment on global financial markets. Risk indicators in advanced economies and emerging markets improved in line with global stock markets, as visible in the decline in credit default swaps (CDS), yield spread, the USD Index and the Chicago Board Options Exchange Market Volatility Index (VIX index). In advanced economies, central bank policy actions involving the resumption of quantitative easing and holding interest rates at accommodative levels have eased the liquidity crunch on interbank money markets. Indicators of counterparty risk have also improved, as reflected in the stable spread for highest-lowest LIBOR quotations, the narrowing spread in the month overnight index swap (OIS) against the 3-month LIBOR rate and the stable T-Bills and Eurodollars (TED) spread in the 3-3-month tenor. In Asia, the weakening trend in the US dollar has also triggered a rally on Asian financial markets fuelled by the upbeat economic outlook in Asia. While this is supported by the downward US dollar trend, recently released economic indicators for Asia also point to resilience bolstered by the economies of China and India. Improvement in risk indicators for emerging market nations was evident in the decline in the Emerging Markets Bond Index Global (EMBIG) spread, CDS in Asia and the net foreign purchase on Asian stock markets.
Slowing economic activity has also led to weakening inflationary pressure. Global inflation (composite) in September eased to 2.7% (yoy). The main contribution to lower inflation came from developing nations, while inflation rates in advanced economies were comparatively stable at 1.4% (yoy). Regarding the overall inflation forecast for 2010, the Consensus Forecast for October estimated global inflation in October at 3.14% (yoy), with advanced nations charting inflation at 1.43% (yoy) compared to 5.33% (yoy) for emerging markets.
5 Some emerging market central banks have kept interest rates on hold and are resorting to a combination of policies to curb exchange rate appreciation. Asian central banks that left interest rates unchanged during October 2010 include the Philippines (4.0%), South Korea (2.25%) and Thailand (1.75%). However, the People's Bank of China raised its policy rate by 25 bps to 5.56% due to rising inflationary pressure. The second round of quantitative easing by developed nation central banks alongside the widening interest rate spread has triggered a wave of global capital flooding into the financial markets of emerging market nations and appreciation in Asian currencies that has prompted financial authorities in Asia to apply a combination of instruments to stem the massive tide of capital flows. In Brazil, authorities have raised the financial transaction tax on local bond purchases by foreign buyers and have imposed higher taxes on foreign investors taking out margin deposits for the futures market. The PBoC has adopted macroprudential measures through limited, gradual increases in the reserve requirement, so far announced 4 times in 2010, to strike a balance between curbing excess liquidity and the imperative of sustaining growth.
Economic Growth in Indonesia
The Indonesian economy is forecasted to chart more rapid growth in Q4/2010. On the demand side, growth will be driven mainly by strengthening domestic demand and investment performance. This condition reflects the continued strength of Indonesia's economic recovery amid external conditions shrouded in uncertainty. Rising domestic demand is supported by positive macroeconomic variables, buoyant public purchasing power and positive levels of consumer and business confidence. Accelerated investment is also supported by improvement in macroeconomic conditions and rising business confidence in the outlook for the condition of the economy. At the same time, support from exports remains strong amid the appreciation in the rupiah due to the generally positive economic growth in trading partner nations, the upward trend in commodity prices and the sizeable contribution of resource-based commodities. On the supply-side, sectoral performance offers headroom for strong growth in Q4/2010, as suggested by various economic indicators.
6
Makanan & Tembakau Pakaian & Perlengkapannya Perlengkapan rumah tangga INDEKS TOTAL (rhs)
% yoy % yoy
Sumber : DSM
Graph 2.3
Growth of Car and Motorcycle Sales
Graph 2.4 Retail Sales Index
‐100%
Imports of Consumption Goods
Graph 2.6
Consumer Income - BI Consumer Survey
Investment performance is predicted to mount in Q4/2010. Supporting the outlook for more robust investment growth are leading indicators suggesting that investment remains in an expansionary phase. Investment growth is also supported by developments in leading indicators that augur for steady improvement in quality. The strong growth evident in Q3/2010 data for cement consumption and construction material imports points to an upward trend in construction investment during Q3/2010 (Graph 2.7). At the same time, imports of machinery used in telecommunications, transport and production activities were also up in figures for September 2010 compared to the same period in 2009 (Graph 2.8). Realised investment in startups and companies holding operating licences (FDI and domestic investment scheme) also continued to climb (Graph 2.9). Added support for growing investment activity also came from the downward trend in real interest rates for investment credit, which boosted real growth in investment credit and leasing in figures ending August 2010 (Graph 2.10). In related developments, the upward trend in manufacturing capacity utilisation will also be followed by growing investment. Taken together, investment performance is forecasted to gather momentum in Q4/2010.
Cars
Motorcycles
Source: CEIC
Clothing & Apparels Households Goods Total Index (rhs)
Food Consumption Goods Non-food Consumption Goods
7
2001 2002 2003 2004 2005 2006 2007 2008 2009 2010
yoy Bangunan (rhs) Manuf. of glass and glass products Manuf. of non‐metallic mineral products Konsumsi Semen s/dSept(rhs) Kons. Listrik Bisnis s/d Juli (rhs)
71 ‐POWER GENERATING MACH. & EQP 72 ‐MACH.SPECIAL FOR PARTIC.INDS 73 ‐METALWORKING MACHINERY
74 ‐GENERAL INDUSTRIAL MACH.&EQP 75 ‐OFFICE MACH.& AUT.DATA PROC. 76 ‐TELECOMMUNICATION & REP. APP
77 ‐ELECTRICAL MACH., APPARATUS 78 ‐ROAD VEHICLES 79 ‐OTHER TRANSPORT EQUIPMENT (rhs)
% yoy % yoy
Foreign & Domestic Investment Realization (BKPM)
Graph 2.10
Real Interest Rate of Investment Credit, Real Investment Credit and Real Leasing
Export growth is predicted to slow further in Q4/2010. Real export growth maintained brisk momentum in Q3/2010 at about 21% (yoy), albeit down from growth reached in Q2/2010 (31.1% yoy). Slowing performance was evident in both oil and natural gas exports and non-oil and gas exports. Factors sustaining the brisk pace of exports include still buoyant economic conditions in trading partner nations, consumer and business confidence at the global level, rising export commodity prices and added production capacity, led by the mining sector. Analysed by volume, non-oil and gas exports in Q3/2010 slowed in comparison to Q2/2010 as a result of flagging performance in resource-based exports. The diminishing performance of resource-based exports during Q3/2010 is explained by flagging exports of mining products and notably copper and nickel, alongside falling exports of agricultural products including wood and shrimps. Exports of non-resource based products were up in comparison to Q2/2010, led by machinery and mechanical tools, footwear and metal products.
With domestic economic growth accelerating further in Q4/2010, imports are also predicted to climb. Factors driving the brisk pace of imports include strong domestic demand and the appreciation in the rupiah that has held down prices for imports. The real measure of import growth came to about 38% (yoy) in Q3/2010 (July-August), having eased slightly from the Q2/2010 growth of 43% (yoy). The persistent high level of imports is consistent with movement in leading import indicators, which suggest that import growth is in the expansionary phase. This projection is supported by renewed decline in import VAT revenues during August 2010. In the oil and gas sector, imports have eased alongside declining oil consumption and falling prices for imported oil and gas. In view of the various developments until Q3/2010, imports are predicted to climb further in Q4/2010.
In analysis by sector, the supply-side structure changed little from the preceding quarter. Among tradable sectors, manufacturing growth is projected to hold steady, as indicated by the stable movement of composite indicators as of August 2010. As at mid-Q3/2010, the production and
Real Investment Credit Real Leasing Real Credit Interest Rate (rhs)
8 capacity utilisation indices in the BI Production Survey were showing an upward trend. Furthermore, movements in the retail index for manufactured products, imports of industrial machinery, sales of heavy equipment and electricity consumption were all positive in the period ending August 2010. Improving conditions in the domestic economy and global markets are key factors driving growth in manufacturing sales. The mining sector is also expected to maintain steady growth, as indicated by the stable crude oil lifting indicator and production of non-oil and gas commodities. However, the agriculture sector is expected to sustain mild correction due to slowing productivity growth, loss of arable land, floods and intensity of pest attacks. Among the non-tradable sectors, the trade, hotels and restaurants sector is projected to maintain robust growth. Estimates also point to sustained high growth in the transport and communications sector, evident from indicators led by imports of transportation equipment and continued high growth in the communications subsector. More vibrant growth is also predicted for the construction sector, reflected in the strong index for construction materials production, imports of construction materials and construction sector loans. In the financial sector, increased lending by banks and non-bank financial institutions offers potential for stronger growth in this sector. Performance in the electricity, gas and water utilities sector is also predicted to improve with high rates of electricity consumption and the commissioning of the Suralaya coal-fired powerplant, while two more powerplants at Indramayu and Pelabuhan Ratu will commence operation in Q4/2010.
I n f l a t i o n
CPI inflation in October 2010 was marked by further decline in inflation from both fundamentals and non-fundamentals. On the fundamentals side, core inflation was down from the preceding period. Core inflationary pressure in October 2010 was driven mainly by external factors related to the upward trend in international commodity prices followed by increases in domestic commodity prices. Nevertheless, this impact from externals was partially mitigated by appreciation in the rupiah. On the non-fundamentals side, inflation also eased as a result of falling prices for some food commodities in wake of the main harvest season. Administered prices generated only mild inflationary pressure due to the minimal level of government-announced price increases. CPI inflation reached 0.06% (mtm) or 5.67% (yoy) during the month under review, down from 0.44% (mtm) or 5.80% (yoy) one month previously (Graphs 2.11 and 2.12).
Jan‐00 Makanan Jadi, Minuman, Rokok, dan Tembakau Perumahan, Listrik, Air, Gas, dan Bahan Bakar Sandang Kesehatan Pendidikan, Rekreasi, dan Olah Raga Transportasi, Komunikasi, dan Jasa Keuangan
%
Inflation by Categories (%, mtm)
The low inflation in administered prices is explained by the minimum level of government-announced price increases. Key contributions to inflation in this category came from cigarettes and household fuels, although in a very limited magnitude. In response, the administered prices category charted monthly inflation at 0.08% (mtm) or 5.79% (yoy), up from the previous month’s level of 5.60% (yoy).
% mtm
% yoy
Transportation, Communication and Financial Services
Education, Recreations and Sports
Health
Clothing
Housing, Electricity, Gas, Water Supply & Fuel
Processed Food, Beverages, Cigarettes & Tobacco
Food
Contribution (mtm)
9 Pressure from volatile foods inflation eased as demand fell back to normal after the religious festivities. The high meat and egg prices formed during the Ramadan fasting month and the following religious festivities underwent significant correction during October 2010 as demand returned to normal. Beef, chicken and eggs all recorded deflation during the month. An added contribution to low volatile foods inflation came from the seasonings category as a result of further price corrections in red chilli peppers and small hot chilli peppers. Despite this, some major food commodities underwent inflation from the effect of supply shocks. The major contributor to inflation in volatile foods was rice. In addition, shallots were hit by harvest failure in the wake of heavy rains and pest attacks. Due to tight supply, shallots became the most important contributor to inflation in the seasonings category. Following these developments, the volatile foods category charted monthly deflation at -0.97% (mtm) with annual inflation at 10.97% (yoy), down from 0.28% (mtm) or 12.41% (yoy) one month previously.
In regard to fundamentals, core inflation was again subdued from the effect of the appreciating exchange rate. During October 2010, the monthly measure of core inflation reached 0.36% (mtm) with annual core inflation at 4.19% (yoy), having eased from 0.59% (mtm) or 4.02% (yoy) in the preceding month. Inflation was driven mainly by external influences acting through the commodity prices channel. The recent surge in international gold and sugar prices has prompted commensurate increases in domestic prices for these products (Graph 2.13). During October 2010, the two commodities contributed 0.13% (mtm) and 0.02% (mtm) to the inflation figure. However, the impact of global inflation and inflation in trading partner nations was mitigated by appreciation in the rupiah. Core inflation also eased in response to correction in a range of transport fares following the end of the religious festive season. In added developments, the sustained downward trend in CPI inflation has fostered improving public expectations of inflation in the short run.
200000 250000 300000 350000 400000 450000 500000
600 800 1000 1200 1400 1600 1800
I IV III II I IV III II I IV III II I IV III II I IV III II I IV III II I IV III II I IV III II I IV III II I IV III II I IV III II I IV
1 2 3 4 5 6 7 8 9 10 11 12 1 2 3 4 5 6 7 8 9 10 11 12 1 2 3 4 5 6 7 8 9 10
2008 2009 2010
Emas Int'l Emas domestik(rhs)
Graph 2.13.
International & Domestic Gold Price
Rupiah Exchange Rate
Exchange rate developments in October 2010 were dominated by external factors. Abundant global liquidity, accelerated global recovery and the differences in policy stance adopted by developed economies and emerging markets all augur for continued capital inflows into Asia. A further reason for currency appreciation is the present condition of the US dollar, which has come under downward pressure from sentiment over the planned launching of the second round of quantitative easing. The strength of these external factors, Indonesia's solid economic fundamentals and subdued investment risk in rupiah instruments offer attraction for capital inflows. The average rupiah exchange rate during October 2010 came to Rp 8,929 to the US dollar, a gain of 0.6% (mtm) over the preceding month (Graph 2.14). At end-October 2010, the rupiah closed at Rp 8,938 per US dollar, having lost 0.15% (ptp) from the previous months' close. Rupiah movement in October 2010 maintained a more
10 stable trend reflected in reduced volatility. During the month, volatility in the rupiah narrowed to 0.1% from 0.2% one month earlier (Graph 2.15).
9,110 Rata‐rata Bulanan Rata‐rata Triwulanan Rp/USD
Regarding externals, the rush of foreign capital pouring into emerging markets, including Indonesia, has led to steady currency appreciation in the region. Indicators for the US economy and other advanced nations have reinforced market confidence that the Fed and other central banks will launch further monetary relaxation. In contrast, emerging markets in Asia and Latin America have resumed actions to normalise policy. The flagging recovery in the US economy and expectations of further monetary easing has put added pressure on the US dollar. During October 2010, the US dollar weakened against major world currencies (EUR, GBP, JPY, etc.) and currencies in Asia (Graph 2.16).
Regional Asia Exchange Rate Apreciation/Depreciation - October vs September 2010
11
Indonesia Risk Perception Indicator
Graph 2.18.
Swap Premium – Various Tenors
The steady improvement in risk perceptions has given added attraction to rupiah-denominated investments. Uncovered interest parity (UIP), an indicator of returns on the rupiah, remained ahead of all other countries in Asia (Graph 2.19). After factoring improvement in risk premia, the rupiah gained even more attractiveness for investment as reflected by Covered Interest Parity (CIP), which has maintained an upward trend during 2010. At the end of March, CIP had improved ahead of other countries in the region. The high volume of capital inflows and improved perceptions of risk in Indonesia have strengthened Indonesia's international reserves position. At the end of October 2010, international reserves reached 91.8 billion US dollars, equivalent to 6.9 months of imports and servicing of official external debt.
‐3.0
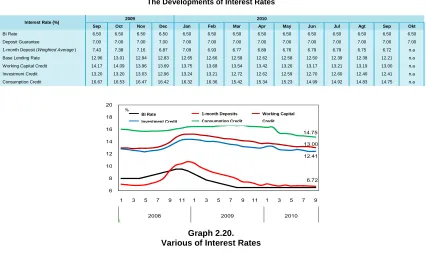
12 In the banking system, deposit and loan interest rates continue to decline. During September 2010, the average 1-month deposit rate, representing the leading source of bank funding, came down 3 bps to 6.72% (Table 2.1). By comparison, the average deposit rate across all tenors dropped by 14 bps. The steepest drop in deposit rates was recorded in the 24-month tenor at a significant 67 bps. In related developments, the average lending rate in September 2010 (measured across working capital credit, investment credit and consumption credit) eased 9 bps. Downward movement was most evident in rates for working capital credit and consumption credit, which came down 19 bps and 8 bps to 13.0% and 14.75%. Rates for investment credit, however, remained largely stable in comparison to the previous month at 12.41% (Graph 2.20).
Analysed by category of bank, the steepest decline in 1-month deposit rates took place at private banks, with the rate cuts averaging 10 bps. Foreign and joint venture banks, regional development banks and state-owned banks lowered deposit rates in more modest increments of 5 bps, 5 bps and 4 bps. Loan interest rates underwent the steepest cuts at foreign and joint venture banks at 11 bps, with rates for working capital credit tumbling 26 bps. Next were state-owned banks and private banks with lending rates down 10 bps and 8 bps.
These developments reflect the ongoing downward response in bank interest rates with positive impact on lending, which is predicted to maintain expansion to the end of 2010.
Table 2.1
The Developments of Interest Rates
Sep Oct Nov Dec Jan Feb Mar Apr May Jun Jul Agt Sep Okt
BI Rate 6.50 6.50 6.50 6.50 6.50 6.50 6.50 6.50 6.50 6.50 6.50 6.50 6.50 6.50 Deposit Guarantee 7.00 7.00 7.00 7.00 7.00 7.00 7.00 7.00 7.00 7.00 7.00 7.00 7.00 7.00 1-month Deposit (Weighted Average ) 7.43 7.38 7.16 6.87 7.09 6.93 6.77 6.89 6.76 6.79 6.79 6.75 6.72 n.a Base Lending Rate 12.96 13.01 12.94 12.83 12.65 12.66 12.58 12.62 12.58 12.50 12.39 12.38 12.21 n.a Working Capital Credit 14.17 14.09 13.96 13.69 13.75 13.68 13.54 13.42 13.26 13.17 13.21 13.19 13.00 n.a Investment Credit 13.20 13.20 13.03 12.96 13.24 13.21 12.72 12.62 12.59 12.70 12.60 12.40 12.41 n.a Consumption Credit 16.67 16.53 16.47 16.42 16.32 16.36 15.42 15.34 15.23 14.99 14.92 14.83 14.75 n.a
Interest Rate (%) 2009 2010
BI Rate Deposito 1 bulan Kredit Modal Kerja Kredit Investasi Kredit Konsumsi
% %
Graph 2.20. Various of Interest Rates
Funds, Credit and the Money Supply
Depositor funds recorded continued expansion. During September 2010, growth in depositor funds reached 15.4% (yoy), up from the previous month’s level of 13.3% (yoy) (Graph 2.25). Funding in September 2010 widened to Rp 2,144.1 trillion or Rp 51.3 billion over the preceding month. This brings the added funding accumulated from December 2009 to September 2010 to Rp 171.0 trillion, representing growth at 8.7% (ytd). In analysis by component, funding growth in September 2010 was driven mainly by time deposits and demand deposits. During September 2010, growth in time deposits and demand deposits mounted to 14.6% and 9.5% (yoy) from the previous month's
13 levels of 11.9% and 6.3% (yoy). Savings deposits, representing the other component of funding, maintained stable growth at 21.9% (yoy) compared to 22.0% (yoy) one month earlier.
Credit showed more vigorous expansion as loan interest rates continued to ease. During September 2010, lending growth (including channelling) reached 20.7% (yoy), up from 19.3% (yoy) one month before (Graph 2.21). Credit (including channelling) mounted by Rp 18.5 trillion in September 2010, bringing expansion for 2010 to Rp 218.3 trillion. Accordingly, credit growth for 2010 (Jan-Sept 2010) reached 13.6% (ytd). Looking ahead, credit expansion is predicted to gather pace as indicated by preliminary data for credit expansion in October 2010 in the latest Commercial Bank Daily Reports, which points to more robust growth. Credit expansion is forecasted to reach 22%-24%1 by the end of 2010, in keeping with the improving condition of the domestic economy.
In analysis by use, working capital credit provided the main contribution to credit growth during September 2010. Expansion in working capital credit strengthened to 21% (yoy) from the previous end-month level of 20.1% (yoy). Similarly, growth in investment credit and consumption credit reached 17.6% and 24.7% (yoy). With working capital credit comprising 49.3% of total lending, working capital credit also represents a growing contribution to the overall rate of credit expansion (Graph 2.22).
In disaggregation by sector, credit growth was again bolstered by the miscellaneous sector. During September 2010, growth in the miscellaneous sector2 reached 35.9% (yoy). With a 33.9% share of total lending, this sector is a key contributor to overall credit growth despite some slowing in keeping with the trend in consumption credit. In September 2010, positive developments were also observed in other productive sectors, led by social services, trade, manufacturing and agriculture. The faster rates of expansion in working capital credit and investment credit also augur for increased lending to other productive sectors.
Analysis of lending by currency points to accelerated growth in foreign currency credit in September 2010. Foreign currency lending expanded by a more robust 19.7% (yoy) from 9.3% (yoy) one month earlier. In contrast, expansion in rupiah-denominated credit was stable at 21.8% (yoy), largely unchanged from the previous month's growth at 22.1% (yoy).
20.7
Kredit DPK BI Rate
% %
% Kontribusi Pertumbuhan
Graph 2.21.
Growth of Credit & Third Party Fund, and BI Rate
Graph 2.22. Credit Growth by Usage
Base money underwent more robust expansion. In October 2010, base money growth widened to 15.1% (yoy) from 8.1% (yoy) in the preceding month (Graph 2.23). This is consistent with pattern of renewed surge in economic activity as the year draws to a close. In October 2010, growth in cash outside banks similarly mounted to 14.9% (yoy) from 9.2% (yoy) one month before.
1
Based on Bank Business Plans, June 2010 revision.
2
Encompasses home mortgages, vehicle loans and credit for household appliances. This growth in other credit reflected the
predominant role of consumption credit.
Credit Fund
Contribution to Growth
14 While M1 declined, increased M2 was driven by quasi-money. In September 2010, growth in M1 economic liquidity eased to 11.9% (yoy) from the previous month's 12.6% (yoy). At the same time, M2 growth in fact widened to 15.5% (yoy) in September 2010 from 14.6% (yoy) one month earlier, fuelled by expansion in quasi-money (Graph 2.24).
15.1
2005 2006 2007 2008 2009 2010
M1 M2 M2 Rp
Growth of M1 & M2 (Nominal)
The Stock Market
Positive developments in Indonesia's economic fundamentals contributed significantly to JCI gains in October 2010. Despite a downturn early in the month, the JCI maintained an upward trend until end-October 2010, closing at 3,635.2 or 3.8% over the preceding month. Other key macroeconomic indicators, such as the stable movement in the exchange rate and improvement in the economic growth outlook, have emboldened foreign investors to channel funds into the stock market. As a result, the JCI soared to a record high of 3,654.1 on 26 October 2010. This new record was achieved amid a bullish trend on global stock markets. These developments brought JSC index gains year-to-date to 43.4%, outperforming other stock indices in the region (Graph 2.25).
Analysed by sector, JCI gains were spurred most importantly by the mining, agriculture and property sectors. Share price gains in the mining and estates sector were driven by rising commodity prices, while the financial sector benefited more from the improving condition of issuer fundamentals with banks reporting increased earnings in Q3/2010.
At the micro-issuer level, listed companies continue to report healthy fundamentals. This was reflected in movement in the JCI and Earnings Before Interest and the Tax (Ebitda) index that has largely kept pace with sectoral gains in Return on Assets (ROA) and also improved results in financial statements released during the second half of 2010. Analysed by Return on Equity, Indonesia is in a superior position compared to other countries in the region, a development that has positioned the Indonesian stock market with a unique competitive advantage.
While the Indonesian economy is in buoyant condition, foreign investors took a wait and see approach in October 2010 although displaying considerable interest in Indonesia's stock market. The net foreign purchase declined from September 2010 to Rp 80 billion, largely in response to limited profit taking and in anticipation to the second phase of quantitative easing expected from the Fed. Even so, foreign investors continued to show interest in the Indonesian stock market, as reflected in foreign capitalisation at 66.7%.3 In response to these developments, daily share turnover in October 2010 reached Rp 5.6 trillion, down slightly from the daily Rp 5.9 trillion turnover one month earlier (Graph 2.26).
3
15
Graph 2.25. JCI and Regional Index
Graph 2.26.
Value and Volume of JCI Trading
The Government Securities Market
Indonesian government securities reported improved performance on the strength of macroeconomic fundamentals and improving risk perceptions. On the macrofundamentals side, the resurgent performance in Indonesian government securities was driven by the upbeat outlook for economic growth, subdued inflation and expectations of more rapid achievement of investment grade. In addition, performance of government securities was also bolstered by the limited scope of fiscal risks and prudently managed fiscal sustainability. In response, short, medium-term and long-term yield eased by 78 bps, 41 bps and 13 bps. In the overall outcome, yield eased by a thin 79 bps to close at 6.9%.
Conducive macroeconomic performance and high returns have sustained keen foreign investor interest in Indonesian government securities. Despite the prevailing downward trend, yield on 10-year government securities remained at a high 7.5% (Graph 2.27), well ahead of the region with comparable yields in Thailand, Malaysia and the Philippines at only 3.1%, 3.8% and 5.9%. As a result, foreigners expanded their holdings of Indonesian government securities over the preceding month. Brisk foreign investor activity on the government securities market was followed by gains in trading activity (Graph 2.28) and significant narrowing of short-term yield, consistent with stable levels of market confidence.
Graph 2.27.
Government Bond Yield and BI Rate
Graph 2.28.
16
Mutual Funds Market
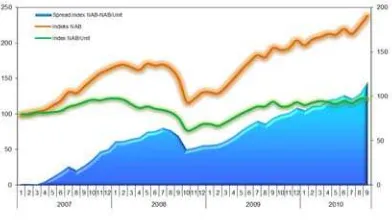
Mutual funds NAV steadily expanded in line with the positive performance of underlying assets. Leading in performance were funds with a high composition of equities, such as index funds, stock exchange traded funds and shares. However, fixed income funds, which still represent the largest share of NAV on the mutual funds market, again contributed the most to overall mutual funds performance. In September 2010, mutual funds NAV reached Rp 131.2 trillion4 with growth at14.9% (ytd) (Graph 2.29). Equity funds led in growth, followed by fixed income, money market and mixed funds. In September 2010, growth in equity, fixed income, money market and mixed funds reached 9.4%, 6.4%, 0.8% and 7.8%.
Graph 2.29 NAV and NAV/Unit
Condition of the Banking System
Banking performance was comfortably positive. In September 2010, banks maintained a robust capital adequacy ratio (CAR) at 16.4%, up slightly from earlier months. Healthy performance was also visible in other key indicators, such as non-performing loans (NPLs), net interest margin (NIM) and return on assets (ROA). During September 2010, NPLs eased from 3.4% one month earlier to 3.3%, while ROA and NIM were stable at 2.8% and 0.5% (Table 2.2). Complementing the solid condition of key indicators was steady improvement in banking intermediation. During September 2010, credit widened by Rp 18.5 trillion or 20.7% (yoy) (Table 2.2), with corresponding growth based on credit in Commercial Bank Daily Reports for October 2010 reaching 21.9% (yoy).
Table 2.2 Banking Indicators
Main
Indicators Sept Okt Nov Des Jan Feb Mar Apr Mei Jun Jul Agt Sep
Total Asset (T Rp) 2,388.6 2,392.7 2,439.7 2,534.1 2,501.8 2,517.0 2,563.7 2,576.3 2,604.4 2,678.3 2,683.5 2,700.2 2,758.1
Third Party Funds (T Rp) 1,857.3 1,863.5 1,897.0 1,973.0 1,948.6 1,931.6 1,982.2 1,980.5 2,013.2 2,096.0 2,082.6 2,092.8 2,144.1
Credit (T Rp) 1,399.9 1,410.4 1,430.9 1,470.8 1,435.7 1,459.7 1,485.9 1,516.0 1,561.2 1,615.8 1,627.4 1,670.6 1,689.1
LDR (%) 75.4 75.7 75.4 74.5 73.7 75.6 75.0 76.5 77.5 77.1 78.1 79.8 78.8
NPLs Gross* (%) 4.3 4.3 4.4 3.8 3.9 4.0 3.8 3.5 3.6 3.3 3.4 3.4 3.3 NPLs Net * (%) 1.3 1.2 1.4 0.9 1.1 1.0 1.0 0.9 1.0 0.8 0.9 0.7 0.7
CAR (%) 17.7 17.6 17.0 17.4 19.2 19.3 19.1 19.2 17.8 17.4 16.5 16.2 16.4
NIM (%) 0.4 0.5 0.5 0.5 0.5 0.5 0.5 0.5 0.5 0.5 0.5 0.5 0.5
ROA (%) 2.6 2.7 2.6 2.6 3.1 2.9 3.0 2.9 2.9 2.9 2.9 2.8 2.8
* include channeling
2009 2010
4
17