Application of Weighted Fuzzy Time Series Model to
Forecast Trans Jogja’s Passengers
Kurrotul A’yun
1*, AgusMaman Abadi
2, FitrianaYuli Saptaningtyas
31 Student of Department of Mathematics, Faculty of Mathematics and Natural Science, State University of Yogyakarta, Indonesia.
2,3Department of Mathematics Education, Faculty of Mathematics and Natural Science, State University of Yogyakarta, Indonesia.
* Tel.: +6289685456983; email: [email protected]
Abstract: Trans Jogja is a public transportation in Yogyakarta which is operated by Dishubkominfo DIY. It is one of the ways to overcome transportation problems especially traffic jams. The total number of the buses until now reaches to 54. In fact, it does not significantly overcome the traffic jam problem yet. Dishubkominfo DIY always makes some efforts to improve the Trans Jogja management. One of them is by giving good services to the passengers. So, it is important to predict the amount of the passengers of Trans Jogja. This forecast uses the data from July 1st 2014 – September 29th 2014. This forecast is based on Weighted Fuzzy Time Series (WFTS).To forecast using WFTS, there are some important steps.Thereare defining the universe of discourse U, defining the fuzzy sets, establishing fuzzy logical relationship, grouping, forecasting, defuzzification, assigning weights and the last is calculating the final forecast values. The data of passengers is not stationer. It must be stationered first by differencing the data. From the forecasting result, MAPE and MSE of testing data are larger than MAPE and MSE of training data. So, WFTS can be used to predictTrans Jogja passenger in the following time.
Key words: forecasting, Trans Jogja’s passengers, weighted fuzzy time series.
1.
Introduction
Yogyakarta is one of the populous cities in Indonesia [1]. Traffic jam happens especially at the rush hours. Operating Trans Jogja bus is one of strategies that have been made [2] to solve traffic jams. Trans Jogja bus is operated since 2008 and it has been alternative solution to provide public transport-based on "buy the service". The number of the buses is 54 buses with 112 shelters. A good management of buses of Trans Jogjamakes them interesting. To improve the management, it is needed to know the number of passengers. Thus, a research to predict the number of Trans Jogja passengers is significant to be conducted.
Some researchers have conducted researches which predict the buses passengers. One of them is Hidayat [3] with hisresearch about the method of Adaptive Neuro Fuzzy Inference System and When-xia [4] using regression analysis method.
value decomposition method for predicting inflation rate.
Chen [11], in the year 1996 developed Song method which isfurther developed by Yu [12] in 2005.Again, Song methodis developed by Lee [13] talking about the seasonal data and by Suhartono [14] - [15] about forecasting seasonal and trend data.Finally, the study by Suhartono is applied to forecast tourist arrivals.
In fact, Lee’s research [16] weighted fuzzy time series method has better accuracy than Chen’s [11], Yu’s [12], and Cheng’s [17] method. Thus, in this paper, the writer used the Lee’s method to predict the passengers of Trans Jogja bus. Since Lee [16] has many orders, the writer merely use the first one which is about weighted fuzzy time series model with data time variant. The data obtained are in the form of daily data of TransJogja’s passengers. Differencing data to get stationary data is important since the data are not stationer. After acquiring the results of forecasting, the writer calculated the value of MAPE (Mean Absolute Percentage Error) and MSE (Mean Square Error) of fuzzy time series method and weighted fuzzy time series method [16].
2.
Forecasting with Fuzzy Time Series
Fuzzy time series (FTS) is the development of a fuzzy system using time series data. Linguistic variables that used in this research are the data in the previous period which is mapped in to the data in the next period.
Definition 2.1. [11] Let U be universe of discourse, U=
{
u1,u2,...,un1}
. A fuzzy set A of U is defined by+ + +
=
n n A A
A
u u f u
u f u
u f
A ( ) ( ) ... ( )
2 2
1
1 (1)
wherefA is the membership function of A, fA:U→[0,1], and fA(u1) indicates the grade of membership of
u
1in A,where fA(u1)∈[0,1]and 1≤i≤n.
Definition 2.2. [5] Let Y(t)(t=...,0,1,2,...), a subset of
R
, be the universe of discourse on which fuzzy set) ... , 2 , 1 ( ) (t i=
fi are defined and F(t)be a collection of fi(t)(i=1,2,...). Then, F(t)is called a fuzzy time series on
...) , 2 , 1 , 0 , ... ( ) (t t=
Y .
Definition 2.3. [11] If there exists a fuzzy relationship R(t−1,t), such that F(t)=F(t−1) R(t−1,t), where
is an arithmetic operator, then F(t)is said to be caused by F(t−1). The relationship between F(t)and F(t−1)
can be denoted by F(t−1)→F(t).
Definition 2.4. [11] Let F(t) be a fuzzy time series. If for any time, F(t)=F(t−1)and F(t) only has finite elements, then F(t) is called a time-invariant fuzzy time series. Otherwise, it is called a time-variant fuzzy
time series.
Based on Definition 2.4., in this forecasting, the data must be stationary data.
Definition 2.5. [11] Suppose F(t−1)=Aiand F(t)=Aj, a fuzzy logical relationship can be defined as
j i A
A → (2)
whereAi and Ajare called the left-hand side (LHS) and right-hand side (RHS) the fuzzy logical relationship,
respectively.
The steps to forecast with fuzzy time series [11] are given as follows: Step 1. Define the universe of discourse U.
Step 2. Divide the universal of discourse U with the same interval. Step 3. Define fuzzy set on a universal discourse called U.
Step 6. Forecast. Let F(t−1)=Ai,
Case 1: If the fuzzy logical relationship of Ai is empty; Ai→∅, then F(t), forecast value, is equal to Ai. Case 2: There is only one fuzzy logical relationship in the fuzzy logical relationship sequence. If Ai→Aj,
then F(t), forecast value, is equal to Aj.
1 , the defuzzified result is equal to the arithmetic
average of the midpoints of
k
3.
Forecasting with Weighted Fuzzy Time Series
Different with forecasting using fuzzy time series, forecasting using weighted fuzzy time series adds weight after defuzzification step. The steps of forecasting using Weighted Fuzzy Time Series (WFTS) method [16] are given as follows:
Step 1. Define the universe of discourse U.
Step 2. Divide the universal of discourse U with the same interval. Step 3. Define fuzzy set on a universal discourse called U.
Step 4. Determine the fuzzy logical relationship. Step 5. Establish group the fuzzy logical relationship. Step 6. Forecast, with fuzzy time series method. Step 7. Defuzzification.
Step 8. Assign weights. Suppose the forecast of F(t)is Aj1,Aj2,...,Ajk. The corresponding weight for
where
w
kis the corresponding weight forA
ij. Step 9. Calculate the final forecast values. The final forecast isequal to the product of the defuzzified matrix and the transpose of the weight matrix:
=
where
×
is the matrix product operator.4.
Application on Forecasting TheTrans Jogja’s Passengers
4.1.
Determining Stationary Data
(a) (b)
(c)
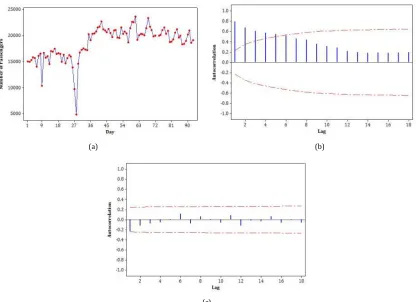
Fig. 1. (a) The data plot of Trans Jogja’s passengers; (b) The ACF of original data; (c) The ACF plot of resulting data after differentiation.
Fig. 1 (b) displays that there are some lags that come out of the significance line.It means that the data are not stationary. Thus, to obtain stationary data, diferencing the data is a must. In this paper, differencing the data is conducted using Minitab16 or manually by [19]:
t t
t Y Y
P+1 = +1− (7)
We need to plot the ACF to see the data of Trans Jogja’s passengers after the differencing process. Fig.1(c) shows that there is no lag came out of the significance line. It means that the data has been stationary with one differentiation. Furthermore, by using resulting data after differentiation that has already stationared (hereinafter called stationary data), the passengers of Trans Jogja can be forecasted by using the Weighted Fuzzy Time Series (WFTS).
4.2.
Forecasting Trans Jogja’s Passengers Using Weighted Fuzzy Time Series
The forecasting process of Trans Jogja’s passengers with stationary data that has been obtained is conducted by the following steps:
Step 1. Define the universal discourse U.
Based on obtained stationary data,the smallest datum is -6106 and the largest datum 9772. So, the universal of discourse for this data is U =[−7250 10250].
Step 2.Divide the universal of discourse U with the same interval.
To simplify universal set of partitions into particular parts, the data is changed to the form of chart. The chart is represented in Fig 2(a).Based on the chart, the universal of discourse U is partitioned into 7 sections with long intervals (2500) of each section. The sections are:u1=[−7250 −4750], u2=[−4750 −2250],
] 250 2250 [
3= −
Step 3. Define fuzzy set on a universal of discourse called U.
The next step is to define the intervals into a fuzzy set. In this study, the writer used 5 linguistic variables:A1
= very very little, A2= very little, A3= a littleA4= moderate,A5= much, A6= very much, and A7= very very
From the fuzzy sets,it is known that this study uses a triangular membership functions. Step 4. Determine the fuzzy logical relationship.
Fuzzy logical relationship (FLR) is used in forecasting established by partitioning the universal of discourse and defining of fuzzy sets. Establishment of the FLR conducted based on fuzzy logic: ifPt=Aithen Pˆi =Aˆi+1. Step 5. Group or establish the fuzzy logical relationship.
In this step, the FLR on step 4 is grouped for each fuzzy set. The result of grouping fuzzy logic relationship is shown on Table 1.
Table 1. Group of Fuzzy Logical Relationship (FLR)
Group LHS RHS Number of RHS
Step 6-7. Forecast and Defuzzification.In this step, the first thing to do is determining the midpoint of each interval fuzzy sets. There are m1=−6000, m2=−3500, m3=−1000, m4=1500, m5=4000, m6=6500, dan m7=9000.
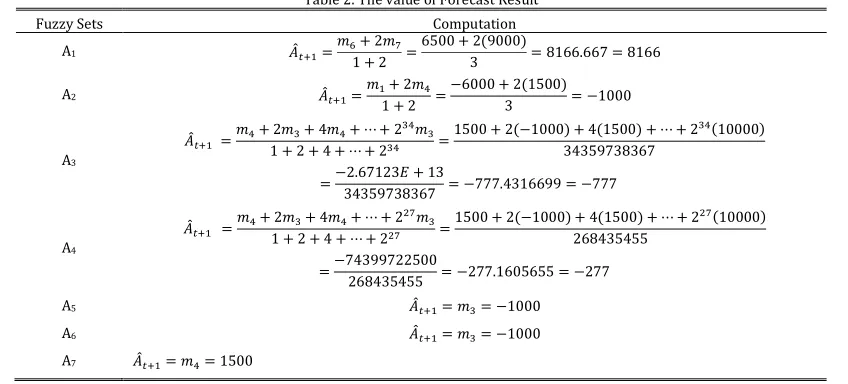
Step 8-9. Assigning weights and calculating the value of forecasting result.After acquiring the midpoint of the interval fuzzy sets, the next step is defuzzifying. The Table 2 shown the defuzzification results of each linguistic variable with c = 2.
Table 2. The value of Forecast Result
Fuzzy Sets Computation
A1 =
34359738367 = −777.4316699 = −777
A4
268435455 = −277.1605655 = −277
A5 = = −1000
A6 = = −1000
A7 = = 1500
4.3.
Return of The Differencing Data
t t
t P Y
Yˆ+1 = ˆ+1+ (8)
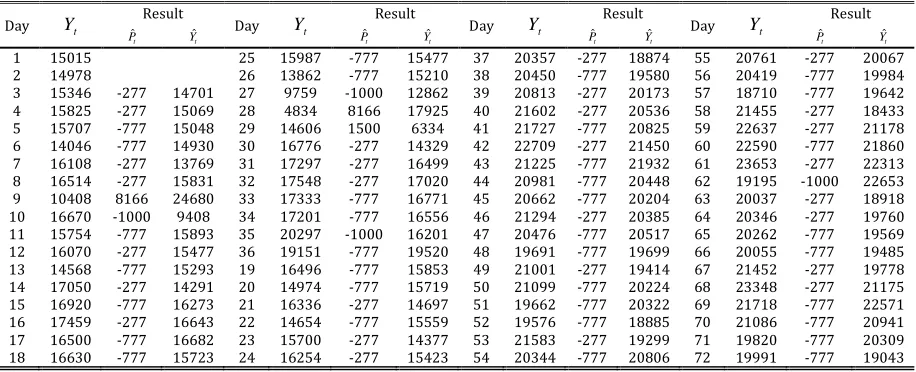
The forecasting result that are needed as training data are shown on Table 3andTable 4show the testing data. The data forecasting result with weighted fuzzy time series method is still in the form of differencing data. Table 3 showsthat data from the forecasting resultinforms the number passengers on day-t.
Table 3. The Forecasting Result of Training Data
Day Yt
Result
Day Yt
Result
Day Yt
Result
Day Yt
Result
t Pˆ
t Yˆ
t Pˆ
t Yˆ
t Pˆ
t Yˆ
t Pˆ
t Yˆ
1 15015 25 15987 -777 15477 37 20357 -277 18874 55 20761 -277 20067 2 14978 26 13862 -777 15210 38 20450 -777 19580 56 20419 -777 19984 3 15346 -277 14701 27 9759 -1000 12862 39 20813 -277 20173 57 18710 -777 19642 4 15825 -277 15069 28 4834 8166 17925 40 21602 -277 20536 58 21455 -277 18433 5 15707 -777 15048 29 14606 1500 6334 41 21727 -777 20825 59 22637 -277 21178 6 14046 -777 14930 30 16776 -277 14329 42 22709 -277 21450 60 22590 -777 21860 7 16108 -277 13769 31 17297 -277 16499 43 21225 -777 21932 61 23653 -277 22313 8 16514 -277 15831 32 17548 -277 17020 44 20981 -777 20448 62 19195 -1000 22653 9 10408 8166 24680 33 17333 -777 16771 45 20662 -777 20204 63 20037 -277 18918 10 16670 -1000 9408 34 17201 -777 16556 46 21294 -277 20385 64 20346 -277 19760 11 15754 -777 15893 35 20297 -1000 16201 47 20476 -777 20517 65 20262 -777 19569 12 16070 -277 15477 36 19151 -777 19520 48 19691 -777 19699 66 20055 -777 19485 13 14568 -777 15293 19 16496 -777 15853 49 21001 -277 19414 67 21452 -277 19778 14 17050 -277 14291 20 14974 -777 15719 50 21099 -777 20224 68 23348 -277 21175 15 16920 -777 16273 21 16336 -277 14697 51 19662 -777 20322 69 21718 -777 22571 16 17459 -277 16643 22 14654 -777 15559 52 19576 -777 18885 70 21086 -777 20941 17 16500 -777 16682 23 15700 -277 14377 53 21583 -277 19299 71 19820 -777 20309 18 16630 -777 15723 24 16254 -277 15423 54 20344 -777 20806 72 19991 -777 19043
Similar to Table 3, Table 4 shows that the data from the forecasting resultsarechanged to be the data of forecasting passenger, but in the form of testingdata. Testing data in Table 4are not used to build the model (the rules of fuzzy relationship).
Table 4. The Forecasting Result of Testing Data Day Yt
Result
Day Yt
Result
Day Yt
Result
Day Yt
Result
t
Pˆ
t
Yˆ Pˆt Yˆt Pˆt Yˆt Pˆt Yˆt
1 20163 -777 19214 6 18742 -777 20164 11 19606 -777 20443 16 20241 -277 18724 2 21097 -277 19886 7 18844 -777 17965 12 19987 -277 19329 17 20987 -277 19964 3 21593 -277 20820 8 19309 -277 18567 13 18376 -777 19210 18 18618 -1000 19987 4 20380 -777 20816 9 20561 -277 19032 14 18422 -777 17599 19 19099 -277 18341 5 20941 -277 20103 10 21220 -277 20284 15 19001 -277 18145
Based on Table 3. and 4. the results of forecasting with the original data is shown in the following figure.
(a) (b)
Fig. 2.(a) The chart of stationary data; (b) The Plot of Original Data and Forecasting Result
Here is a comparison of the value of MAPE and MSEfor the training data that is used to seethe results of forecastingusing the Fuzzy Time Series and Weighted Fuzzy Time Series Method.
Table 5. The Value of MAPE and MSE
Fuzzy Time Series [11] Weighted Fuzzy Time Series [16] Training MAPE : 13.98% MSE : 9078581.286 Training MAPE : 12.28 % MSE : 8789055.686
Testing MAPE : 5.90% MSE: 1798624.316 Testing MAPE : 4.89 % MSE : 1023784.947
and MSE values with weighted fuzzy time series model is smaller than the value of MAPE and MSE with fuzzy time series. It means that forecasting Trans Jogja passengers with weighted fuzzy time series model is better than fuzzy time series model.
5.
Conclusion
The result of the forecasting process with WFTS model is betterthan forecast with fuzzy time series model. Since, the values of MAPE and MSE with fuzzy time series model is bigger than the values of MAPE and MSE with weighted fuzzy time series model.However, this study did not consider the seasonal effect. In Indonesia, the effect of eidmubarokday makes the number of Trans Jogja passengers increase significantly. Therefore, it is expected that some future researchers concentrate on forecastingTrans Jogja’s passengersin the seasonal moments.
Acknowledgment
The writer would like to thank Dishubkominfo DIY on their guidance for the work field,also for their cooperation and support data for the preparation of this paper.
References
[1] BadanPusatStatistik.(2010). Resident Cencus 2010. Accessed on 06 Desember 2014, from website: http://sp2010.bps.go.id/index.php/site?id=3400000000&wilayah=DI-Yogyakarta
[2] The Government Daerah Istimewa Yogyakarta. (2013). ProfilDinasPerhubungan,
KomunikasidanInformatika Daerah Istimewa Yogyakarta.Yogyakarta:Dishubkominfo DIY.
[3] Hidayat, S., Kencana, I., &Jayanegara, K. (2013). Prediksipengguna bus transsarbagitadenganmetode adaptive neuro fuzzy inference system. E-JurnalMatematika: Vol.2. No.3, 46-52.
[4] When-xia, S., Ti, S., & Hai, Z. (2009). Study on bus passenger capacity forecast based on regression analysis including time series. Proceeding of the ICTMTMA: Vol.2. Measuring Technology and
Mechatronics Automation(pp. 381-384). Hunan: IEEE.
[5] Song, Q., &Chissom, B. S. (1993). Fuzzy time series and its models. Fuzzy sets and System 54, 269-277. [6] Song, Q., &Chissom, B. S. (1993). Forecasting enrollments with fuzzy time series-part I. Fuzzy sets and
System 54, 1-9.
[7] Song, Q., &Chissom, B. S. (1994). Forecasting enrollments with fuzzy time series-part II. Fuzzy sets and
System 62, 1-8.
[8] Nurhayadi, Subanar, Abdurakhman, &Abadi, A. M. (2014). Fuzzy model optimation for time series data using a translation in the extent of mean error. Journal of Mathematics 10 (2): 267-274.
[9] Shah, M. (2007). Fuzzy time series: a realistic method to forecast gross domestic capital of India. ASC 41, pp. 255-264.
[10]Abadi, A. M., Subanar, Widodo, & Saleh, S. (2009). Contructing fuzzy time series using combination of table lookup and singular value decomposition methods and its application to forecasting inflation rate. Journal IlmuDasar: vol.10. No.2, 190-198.
[11]Chen, S.M. (1996). Forecasting enrollments based on fuzzy time series. Fuzzy Sets and Systems 81(3): 311–319.
[12]Yu, Hui-Kuang. (2005). Weighted fuzzy time series models for taiex forecasting. Phisica A: Statistical
Mechanics and its Applications 349: 609-624.
[13]Lee, M. H. &Suhartono. (2012). A weighted fuzzy time series for forecasting seasional data. Journal of
Quality Measurement and Analysis 8(1): 85-95.
series for forecasting trend and seasional data. Journal of Mathematics and Statistics 7(3): 177-183. [15]Suhatono, Lee, M. H., &Javedani, H. (2011). A weighted fuzzy integrated time series for forecasting
tourist arrivals. Journal of Informatics Engineering and Information Science 252: 206-217.
[16]Lee, M.H. &Suhartono. (2010). A novel weighted fuzzy time series model for forecasting seasonal data. Presented at The 2nd International Conference on Mathematical Sciences, Kuala Lumpur, Malaysia.
[17]Cheng, C.H., Chen, T.L., Teoh, H.J. & Chiang, C.H. (2008). Fuzzy time series based on adaptive expectation model for TAIEX forecasting. Expert Systems with Applications 34(2): 1126–1132.
[18]DinasPerhubungankomunikasidaninrofmatika DIY. (2014). Report 2012-2014. Yogyakarta: Trans Jogja sector.
[19]Nason, G.P. (2006). Stationary and non-stationary time series. Chapter 11 of Statistics in Volcanology,
(Mader, H. and Coles, S.C., eds), Geological Society of London, to appear.
Biographic
KurrotulA’yun, was born in Ponorogo, East Java, Indonesia, on 29October 1992. She completed his education at the junior level Mts Al Mukarrom (2008) and senior secondary education MAN 2 Ponorogo (1992). Now, she is studying Strata 1 level in Yogyakarta State University, and is listed as one of the students in Wahid Hasyim Islamic boarding school in Yogyakarta. She is concentrating on mathematics in the department of mathematics, department of mathematics education, faculty of mathematics and natural science, Yogyakarta State University.
The writer is active in some areas of the organization. At the end of 2014, she completed her responsibility as chairman of An Najah dormitory, one of dormitory in Wahid Hasyim Islamic boarding school. In the first and the second year as a student, she is active in the Department Student Association (HIMATIKA) and was assigned as head of Education and Reasoning in the second year. Now, she is registing as a mathematics teacher in senior high school of Wahid Hasyim. In addition, she also writes several papers. Papers that had been written is Optimize of Forest of Casuarina’s Tree Management Result (2014), Case Study PT. TASPEN KCU Yogyakarta: The use of Constant Dollars method in Normal Retirement Calculation of Pension Fund Group (2014), and Forecast the number of Trans Jogja’s Passengers Using Fuzzy Inference System (2014).
AgusMamanAbadiwas born in Gunungkidul, Yogyakarta, Indonesia on August 28, 1970. He is graduated Bachelor from GadjahMadaUniversity in 1994, graduated Master from GadjahMada University in 1998, and graduated Ph.D fromGadjahMadaUniversity in 2010. He is a lecturer and a chief atMathematics Department, Mathematicsand Natural Science Faculty, Yogyakarta StateUniversity, Indonesia.His email address is [email protected].
He interests to do research in applied algebra especially in Fuzzy Model. There are more than 40 titles of his researches about Fuzzy Model and its application.Several papers that had been written there areFuzzy Model Translation for Time Series Data in the Extent of Median Error and its Application (Applied Mathematical Sciences), Fuzzy Model Optimization for Time Series Data Using A Translation in The Extent of Mean Error (Journal of Mathematics and Statistics), A New Method for Generating Fuzzy Rules from Training Data and Its Applications to Forecasting Inflation Rate and Interest Rate of Bank Indonesia Certificate (Journal of Quantitative Methods), etc. He precentate several papers at international conference in Cina (2014), Turkey (2012), Singapore (2008) and several universities in Indonesia. He got award from head of Yogyakarta University as a performance lecture in 2012. Now, he concentrate to his reasearch about optimation of fuzzy model and its application to diagnose cancer.
Fitriana Yuli Saptaningtyaswas born in Gunungkidul, Yogyakarta, Indonesia on July 7, 1984. She is graduated Bachelor from mathematics education department ofYogyakarta StateUniversity in 2005and graduated Master from mathematics departmentof ITS Surabaya in 2007. Now, she is a lecturerat Mathematics Department, Mathematicsand Natural Science Faculty, Yogyakarta StateUniversity, Indonesia.Her email address is [email protected].