Article
Beyond Words: Using Nonverbal Communication Data in Research to Enhance Thick
Description and Interpretation
Magdalena A. Denham, EdD Assistant Professor
Department of Security Studies College of Criminal Justice Sam Houston State University Huntsville, Texas, United States
Anthony John Onwuegbuzie, Ph.D., P.G.C.E., F.S.S. Professor
Department of Educational Leadership and Counseling Sam Houston State University
Huntsville, Texas, United States
© 2013 Denham and Onwuegbuzie.
Abstract
Interviews represent the most common method of collecting qualitative data in both qualitative research and mixed research because, potentially, they provide researchers with opportunities for collecting rich data. Unfortunately, when collecting and analyzing
interview data, it appears that researchers tend to pay little attention to describing nonverbal communication data and the role that these data played in the meaning-making process. Thus, in this mixed methods research-based systematic review, we examined the prevalence and use of nonverbal communication data throughout the phases of all qualitative research studies published in a reputable qualitative journal—namely TheQualitative Report—since its inception in 1990 (n = 299) to the mid-year point (i.e., June 30) of 2012—representing approximately 22 years. Overall, nonverbal communication was evidenced in only 24% (N = 299, n = 72) of qualitative research studies involving design and instruments suitable for collection of nonverbal communication. Moreover, the degree of discussion varied greatly from a mere mention to substantive integration and interpretation. Nonverbal discussion was least frequent in the data analysis phase of research and most underutilized in case studies. The essential functions of nonverbal discussion across the stages of research were identified as clarification, juxtaposition, discovery, confirmation, emphasis, illustration, elaboration, complementarity, corroboration and verification, and effect. Implications are discussed.
Keywords: nonverbal communication, thick description, interpretation, systematic review,
mixed methods research, mixed analysis
Author Note: An earlier version of this article was presented as a micro-keynote address at
Indubitably, nonverbal communication has been accepted as a formidable source of information as well as the complement to the study of verbal behaviors of humans (e.g., Bull, 2002; Duncan, 1969; Frels & Onwuegbuzie, 2013; Mehrabian, 1981, 2009; Morris, 1977). Nonverbal behaviors such as preferential looking have assisted some researchers (Bowerman & Choi, 2001; Choi, 2000; McDonough, Choi, & Mandler, 2003) in measuring linguistic competence of preverbal infants. Other researchers (e.g., Abramovitch, 1977) have documented that children read beyond words in danger-sensing. The evaluation of nonverbal communication and linguistic expression combined has opened avenues for neurolinguistic research on aphasia (e.g., Loveland et al., 1997; McNeill, 1985), and a wealth of information can be gleaned from nonverbal communication of autistic children. Researchers have credited assessment of nonverbal communication as being
integral to deception detection (Ekman & Friesen, 1974; Ekman, O’Sullivan, Friesen, & Scherer,
1999; Fiedler & Walka, 1993; Warren, Schertler, & Bull, 2009). Meanwhile, in business, nonverbal communication has served as an auxiliary determinant for hiring decisions (e.g., Manusov & Patterson, 2006).
Mehrabian (1981) underscored that paralingual and facial expressions alone communicated 93%
of people’s feelings and attitudes (i.e., 55% for facial and 38% for paralingual, respectively).
Furthermore, brain researchers (e.g., Kelly, Barr, Church, & Lynch, 1999) have concluded that verbal and nonverbal phenomena, albeit processed in distinct parts of our brain, display interdependence and connectivity. The tradition of considering the analysis of nonverbal communication processes as ecologically fused into and virtually inseparable from linguistic expression in human interactions has been well established (e.g., Bull, 2002; Jones & LeBaron, 2002; Kendon, 2000, 2004; Knapp & Hall, 2010; Manusov & Patterson, 2006). Nonetheless, there is a dearth of empirical knowledge as to whether and to what extent qualitative researchers use nonverbal communication data to guide the development of their studies (Onwuegbuzie, Leech, & Collins, 2010). Undeniably, exemplar models (e.g., Ekman, 1972), substantive typologies (e.g., Frels & Onwuegbuzie, 2013; Gorden, 1980; Krauss, Chen, & Chawla, 1996; McNeill, 1992), and comprehensive matrices (e.g., Onwuegbuzie et al., 2010) have been
proposed by researchers as means of mapping and assessing nonverbal communicative behaviors; yet, it is uncertain whether available classifications, mapping, and assessments have been
assimilated into qualitative research practice. Jones and LeBaron (2002), who advocated for an integrated approach to examining verbal and nonverbal communication in research, remarked on traditional obstacles to integration:
Progress toward studying verbal and nonverbal behavior together may have been impeded by certain factors. One problem is the linear format of journals and books, which is somewhat at odds with reporting the complexities of multidimensional
interactions. It is much easier to present verbal transcripts or statistical tables than it is to describe and analyze integrations among varied message modalities. Another impediment is that there is not widespread agreement about how holistic analyses should be
conducted. (p. 500)
In qualitative research specifically, some scholars (e.g., Begley, 1996) have voiced concerns that an undocumented, non-rich inclusion, or an omission of non-verbal communication as data, could contribute to limitations such as rationalization as well as the lack of awareness by the researchers and, hence, threaten the verisimilitude of the naturalistic inquiry. Indeed, researchers have
Typology of Nonverbal Communication
Qualitative researchers have at their disposal an array of nonverbal behavior that can be collected that would yield thicker descriptions and interpretations compared to the sole use of verbal data.
For example, Gorden’s (1980) typology of nonverbal communication data comprised the
following indicators: kinesics (i.e., behaviors reflected by body displacements and postures), proxemics (i.e., behaviors denoting special relationships of the interviewees/interviewers), chronemics (i.e., temporal speech markers such as gaps, silences, and hesitations), and
paralinguistics (i.e., behaviors linked to tenor, strength, or emotive color of the vocal expression). For instance, with respect to silence, qualitative researchers can glean important information from silence exhibited by participants—indeed, sometimes more can be learned from what a person does not utter than from what he/she utters. Several authors have discussed the potential meaning and purpose of examining silence in the discourse of people. As an example, Mazzei (2008)
examined the nature and intent of what she termed as “racially inhabited silences” (p. 1125)that she identified in two teacher education courses that predominantly contained White preservice
teachers, leading her to surmise that “In the course of the research these silences were shown to
be both purposeful and meaningful in reaffirming the espoused perspective of the participants” (p. 1126).
The Role of Nonverbal Communication Data in the Data Collection Process
As conceptualized by Leech and Onwuegbuzie (2008), the following four major sources of qualitative data prevail: talk, observations, images, and documents. Specifically, talk represents data that are extracted directly from the voices of the participants using data collection techniques such as individual interviews and focus groups. Observations involve the collection of data by systematically watching or perceiving one or more events or interactions in order to address or to inform one or more research questions. Images represent still (e.g., drawings, photographs) or moving (e.g., videos) visual data that are observed or perceived. Finally, documents represent the collection of text that exists either in printed or digital form. The analysis of all four data sources can be enhanced greatly by incorporating the analysis of nonverbal communication data. For instance, with regard to the use of focus groups (i.e., talk data), Morgan (1997) stated the following:
The concept of group-to-group validation calls attention to the fact that nearly all
analyses of focus groups concentrate on the manifest content of the group discussions. In contrast, there has been little attention to the microdynamics of the interaction process in
focus groups … To be sure, moderators do pay attention to the nonverbal aspects of
group interaction, but this is nothing like the careful attention to turn-taking, eye contact, pauses in interaction, patterns of speech, and so on that could go in to an analysis of these conversations. (p. 63)
The Role of Nonverbal Communication Data in the Data Analysis and Data Interpretation Process
Conversation Analysis
Conversation analysis, which was developed in the 1960s by Harvey Sacks, Emmanuel Schegloff, and Gail Jefferson (Sacks, Schegloff, & Jefferson, 1974; Schegloff, 1968, 1972),
represents an analytical technique for describing people’s methods for producing orderly social
interaction when engaged in formal discourse (e.g., educational settings, hospitals, courtrooms). According to Heritage (1984), the goal of conversation analysis is to focus on what participants do in conversation, such that the behavior of speakers serves as the primary source of data. Conversation analysis is concerned with several aspects of talk, including the following: (a) turn-taking and repair, (b) adjacency pairs, (c) preliminaries, (d) formulations, and (e) accounts. Turn-taking and repair refer to how a speaker makes a turn relate to a previous turn (e.g., “OK”), what the turn accomplishes in terms of the interaction (e.g., a question, an endorsement), and how the turn relates to a subsequent turn (e.g., via a question, request, directive). The moment in a conversation when a transition from one speaker to another can occur is called a transition relevance place (Sacks et al., 1974), which prevents chaos and makes turn-taking context free. When turn-taking violations occur (e.g., more than one person is speaking at the same time), repair mechanisms come to the fore (e.g., one speaker stops speaking before a typically possible completion point of a turn). Thus, turn-taking provides speakers with an incentive to listen, to understand the utterances, and to display understanding. Adjacency pairs represent sequentially paired actions that characterize the generation of a reciprocal response. These two actions
normatively occur adjacent to each other and stem from different speakers. Preliminaries are used to evaluate the situation before performing some action, providing an avenue for the speaker to ask a question indirectly in order to decide whether the question should be asked directly. Formulations provide a summary of what another speaker has stated. Finally, accounts represent the means by which people explain actions such as apologies, requests, excuses, and disclaimers (Silverman, 2001). The collection, analysis, and interpretation of nonverbal communication data clearly can enhance the analysis and interpretation of turn-taking and repair, adjacency pairs, preliminaries, formulations, and accounts, as well as other behaviors of speakers. For example, a researcher can examine turn-taking and repair more deeply (i.e., generation and use of thicker data) by paying attention to kinesics, proxemics, chronemics, and paralinguistics. In particular, body movements (i.e., kinesics), silences and hesitations (i.e., chronemics), and tone of voice (i.e., paralinguistics) can be used to assess further how the speakers involved in a conversation repair turn-taking violations.
Latent Content Analysis
Latent content analysis, credited to Bales (1951), represents a class of qualitative data analysis techniques used to identify underlying meaning of behaviors or actions. This form of analysis involves uncovering deep structural meaning conveyed by messages represented in talk, documents, images, and observations, thereby representing an extremely interpretive analysis (Berg, 1995). According to Potter and Levine-Donnerstein (1999), there are two types of latent content: latent pattern variables and latent projective variables. Specifically, latent pattern variables involve combining information that provides evidence of the presence of a variable of interest. For example, in deciding whether or not a person is happy, a latent content analyst might
use all available information about the potentially happy person’s characteristics (e.g., tone of
voice, body language) to indicate the possible existence of the target variable (i.e., happiness). However, happiness only can be declared with confidence when an identifiable pattern of characteristics emerges. Therefore, for latent pattern variables, the meaning of the target variable resides on the surface of the content, thereby yielding complex coding schemes. In contrast, for
the previous example, the latent content analyst might use latent projective variables to analyze cognitive processes (e.g., mood) underlying the potentially happy person. Latent content analysts typically use a codebook, which Fonteyn, Vettese, Lancaster, and Bauer-Wu (2008) define as a formalized set of codes, definitions, and examples. These codebooks are used either a priori (i.e., using an existing codebook) or a posteriori (i.e., developing a codebook during the analysis process) to guide researchers during the coding process in identifying symbols inherent in the flow of content and meaning making from the perceived connections among the individual symbols. The collection, analysis, and interpretation of nonverbal communication data clearly can enhance latent content analysis. For instance, a latent content analyst can uncover deeper
structural meaning by paying attention to kinesics, proxemics, chronemics, and/or paralinguistics, depending on whether the message is represented in talk, document(s), image(s), or
observation(s).
Purpose of Study
Although, as has been discussed, compared to its non-use, the collection of nonverbal communication can yield thicker descriptions and interpretations—and, thus, help qualitative researchers achieve verstehen (i.e., increased understanding) to a greater extent, it is not clear the extent to which qualitative researchers have been utilizing nonverbal communication data in their research studies. Thus, through a mixed methods research-based systematic review, we attempted to diminish the identified lacuna by addressing the following research questions: (a) How
prevalent is the use of nonverbal communication in qualitative research studies; (b) To what extent do qualitative researchers explore nonverbal communication during the collection, analysis, and interpretation of data; and (c) What are the perceived functions and the benefits of integrating nonverbal communication into the qualitative research process?
Conceptual Framework
Our conceptual frame was anchored in propositions devised by Greene, Caracelli, and Graham (1989) who discerned five substantive purposes for mixing research approaches: (a) triangulation, (b) complementarity, (c) development, (d) initiation, and (e) expansion. Specifically, triangulation involves comparing results that are extracted from the qualitative data with the results obtained from the quantitative data. Complementarity involves seeking elaboration, enhancement, depiction, and clarification of the results emanating from one analytical strand (e.g., qualitative) with the findings stemming from the other analytical strand (e.g., quantitative). Development involves using the findings emerging from one analytical strand (e.g., quantitative) to help inform the results pertaining to the other analytical strand (e.g., qualitative). Initiation involves
identifying paradoxes and contradictions that emerge when results from the quantitative and qualitative analytical strands are compared and contrasted that might lead to a re-framing of the research question. Finally, expansion involves expanding breadth and range of a study by using multiple analytical strands for different study phases.
Echoing Greene et al.’s (1989) model, we viewed communicative processes ecologically and integratively. Thus, we conceptualized that nonverbal communication could allow qualitative researchers to (a) corroborate speech narrative (i.e., triangulation); (b) capture underlying messages (i.e., complementarity); (c) discover nonverbal behaviorsthat contradict the verbal communication(i.e., initiation); (d) broaden the scope of the understanding (i.e., expansion); and (e) create new directions based on additional insights (i.e., development). This conceptual
(i.e., determining how the nonverbal and verbal data relate to each other as the data analysis unfolds), or iteratively (i.e., combining a priori and a posteriori analyses). Saldaňa (2012)
identified 32 coding strategies (e.g., values coding, wherein codes are applied that consist of three
elements, namely, value, attitude, and belief, in order to examine a participant’s perspectives or worldview). Although Saldaňa’s (2012) excellent typology is extensive, it does not include any
coding for nonverbal communication data. Thus, based on our conceptual framework, at least five
additional codes can be added to Saldaňa’s (2012) typology, with names such as the following: corroboratecoding, capturecoding, discover coding, broaden coding, and new directions coding (here, the names of these codes is not as important as what the codes involve—namely, the intersection of verbal and nonverbal communication data). The major point regarding our conceptual framework is that collecting, analyzing, and interpreting nonverbal communication data can yield thicker descriptions (cf. Geertz, 1973) and interpretations via the process the researcher will take to make sense of both forms of data simultaneously that would not have been the case if the use of nonverbal communication data had not been incorporated into the study.
Method
Because multiple approaches to answering research questions expand the choices of the
researcher (Johnson & Christensen, 2010; Johnson & Onwuegbuzie, 2004; Teddlie & Tashakkori, 2009), the combination of quantitative and qualitative research elements was adopted for this case study—specifically, what is referred to as a collective case study (Stake, 2005) or a multiple case study (Yin, 2009). The research philosophical stance for our study was what Johnson (2011) recently labeled as dialectical pluralism, referring to an epistemology that requires the researcher to incorporate multiple epistemological perspectives within the same inquiry. We believed that our dialectical research philosophical stance was particularly compatible with our goal of identifying and classifying the nonverbal data reported in qualitative articles because these data could take multiple forms. In this mixed research design, the qualitative component was dominant, with the less-dominant quantitative phase preceding the qualitative phase, yielding a qualitative-dominant mixed research design (Johnson & Onwuegbuzie, 2004; Johnson,
Onwuegbuzie, & Turner, 2007)—specifically, a fully mixed sequential dominant status design (Leech & Onwuegbuzie, 2009). Clearly, our purpose necessitated an assessment of a process (i.e., nonverbal communication) traditionally yielded when using methods classified by Wolcott (1992) as asking (e.g., interview, focus group, dialogue) or watching (i.e., observation), which are inherently qualitative (Miles & Huberman, 1994).
Procedures
We obtained the ex post facto data (i.e., data previously collected, analyzed, and interpreted) from all articles published in The Qualitative Report(TQR) journal since its inception in 1990. TQR’s archives nested 17 volumes and 685 articles at the time of the conclusion of data extraction and subsequent analyses (i.e., mid-year point on June 30, 2012). We selected TQR for the following five reasons. First, TQR, a peer-reviewed, qualitative research journal, has a very long tradition, spanning more than two decades, which allowed us to analyze a large sample of empirical articles that have been published in this journal over the years. Further, its 1990 launch date means that it covers five of the nine moments identified by Denzin and Lincoln (2011a) that have occurred in the history of qualitative research since 1990, namely the post-modern period of experimental ethnographic writing (1990-1995); post-experimental inquiry (1995-2000); methodologically contested present (2000-2004); un-named (2005-present); and fractured future (2005-present). Second, TQR is extremely interdisciplinary, multidisciplinary, and transdisciplinary. Indeed,
TQR is “the oldest multidisciplinary qualitative research journal in the world” (The Qualitative Report, 2013a, para. 1). Third, TQR publishes works from a diverse set of authors, thereby
“serv[ing] as a forum and sounding board for researchers, scholars, practitioners, and other
reflective-minded individuals who are passionate about ideas, methods, and analyses permeating
qualitative, action, collaborative, and critical study” (The Qualitative Report, 2013a, para. 1). In
fact, since January 2002, the editors of TQR have received original manuscripts from authors living in the United States, Puerto Rico, and 56 other nations from around the world (The Qualitative Report, 2013b). Fourth, TQR is a very reputable journal. In particular, to date (i.e., December 15, 2013), articles published in TQR have been cited in at least 14,710 works (at a rate of 222.88 citations per year and 14.71 citations per article), yielding an h-index (which provides a measure of sustained impact; cf. Hirsch, 2006) of 47 (this h-index was obtained using Harzing’s [2009] Publish or Perish software and Google Scholar), which is higher than the h-index of 41 associated with the International Journal of Qualitative Methods—another reputable qualitative research journal. According to Google, TQR is a top 10 ranked web page when the search string
“qualitative research” is used (The Qualitative Report, 2013b). Fifth, representing an open access journal, TQR is very accessible.
The procedures in the present study involved the following steps. First, all TQR articles were imported and incorporated into the data set we created using the qualitative data analysis software QDA Miner 3.2.4 (Provalis Research, 2009). The data set consisted of 685 cases (i.e., articles). The sequential mixed methods analysis (Teddlie & Tashakkori, 2009) served as a basis for the statistical and thematic assessment of the cases selected for systematic review. Moreover, during both phases of the analyses of the data, the investigators extrapolated, refined, reduced, or expanded their findings, going back and forth and using both statistical and thematic techniques illustrative of a sequential mixed methods analysis (Teddlie & Tashakkori, 2009). For each case, the following variables were created: (a) date of issue, (b) article type, (c) instruments of data collection, and (d) research design. Subsequently, each article was classified based on the aforementioned variables. Counts were performed based on article type via classical content analysis (Krippendorff, 2012; Weber, 1990). Because of our purpose, only empirical articles were retained for further analyses. Moreover, counts were conducted based on type of instrument used for data collection. Only those empirical articles whose authors used interviews, focus groups, observations, dialogue, or any combination thereof were retained.
rules, and syntax for encoding or decoding (Mehrabian, 2009). Concurrently, Gorden’s (1980)
typology of nonverbal communication (i.e., kinesics, proxemics, chronemics, and paralinguistics) provided us with an a priori compass to assess the prevalence and indication of nonverbal
communication data.
Specifically, the extended texts of interest were any parts of each document relating to the evidence of the assessment of nonverbal communication in the abstract, data collection, data analysis, or results/discussion sections of the articles. We represented those excerpts ranging in length from one sentence to a large paragraph by a code called Nonverbals. Furthermore, we categorized segments of the text coded as Nonverbals based on their placement in the article (i.e., abstract, data collection, data analysis, and results/discussion, respectively), and we typed them
according to Gorden’s (1980) classification into (a) kinesic, (b) chronemic, (c) proxemic, and (d)
paralinguistic. Cognizant of Patton’s (1990) suggestion that method triangulation can guard against the criticism that results are merely an artifact of a single method, we performed a key-words-in-context (KWIC) search of the word nonverbal* using the QDA Miner to strengthen the results (Fielding & Lee, 1998). Indeed, an additional 17 cases were identified containing relevant evidence (i.e., literature review segments of the cases were not assessed) of nonverbal
communication; those were coded accordingly. Then, we performed counts of Nonverbals with respect to placement, type, instrument, year of article issue, and design.
In the subsequent qualitative phase, we adopted classical content analysis (Krippendorff, 2012; Weber, 1990) to elucidate what typical functions were associated with the use of nonverbal communication. Furthermore, in order to conceptualize the scope and depth of nonverbal communication indication by researchers, we performed a taxonomic analysis (Spradley, 1979), which allowed us to select included terms based on semantic relationships and was consistent with our research questions. The audit trail in the form of consecutive, revised, and exported codebooks as well as tentative taxonomies allowed us to augment the trustworthiness of the study (Yin, 2009).
Results
Based on the instrument used for data collection, the types and frequencies of articles published in TQR from its inception until June 30, 2012 are represented in Table 1. These articles were classified as (a) empirical, (b) methodological, (c) reviews of books or journals, (d) essays, and (e) editorials. In addition, frequencies of instruments used for data collection under each article category are listed. Of the 685 total articles, 401 (59%) represented empirical studies, of which 299 involved the use of interview(s), observations, focus group(s), dialogue, or any combination thereof as data collection techniques. It was the use of one or more of these data collection techniques that provided us with our bounded system (Stake 2005). As such, these 299 articles had the potential to include information about the collection, analysis, and/or interpretation of nonverbal communication data, thereby representing our collective cases (Stake, 2005). These 299 articles indicated that three fourths (i.e., 299/401 = 74.5%) of the sets of authors who have had empirical articles published in TQR had the potential to utilize nonverbal communication data. Therefore, at this point, our revised research questions were as follows: (a) How prevalent is the use of nonverbal communication in these 299 qualitative research studies; (b) To what extent do these 299 sets of qualitative researchers explore nonverbal communication during the
Table 1
Frequencies of Articles Published in The Qualitative Report Based on Type and Data Collection Instrument (1992–2012)
Instrument Article Type Total
________________________________________________________________
Empirical Methodological Review Essay Editorial
Interview 139 5 0 0 0 144
Interview,
other 51 2 0 0 0 53
Interview,
observation 36 1 0 0 0 37
Focus group 29 1 0 0 0 30
Interview,
focus group 17 0 0 0 0 17
Observation 11 0 0 0 0 11
Interview, focus group,
observation 7 0 0 0 0 7
Dialogue 5 0 0 0 0 5
Observation,
other 3 0 0 0 0 3
Focus group,
other 1 0 0 0 0 1
Document 70 11 0 0 0 81
Document,
other 1 0 0 0 0 1
Researcher 15 183 46 14 15 273
Internet 9 1 0 0 0 10
Software,
video, art 7 5 0 0 0 11
Total 401 209 46 14 15 685
Quantitative Findings
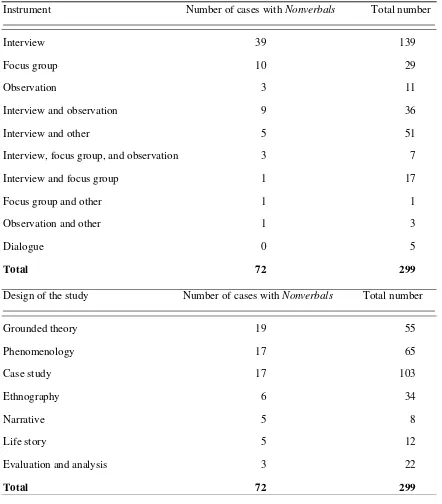
As portrayed in Table 2, evidence of nonverbal communication was recorded in less than one quarter of the 299 eligible articles (n = 72). Specifically, of the two most commonly used single data collection tools—namely, (individual) interviews and focus group interviews—studies involving the use of focus group interviews (34.5%) were more likely to contain discussion of nonverbal communication data than were studies involving the use of interviews (28.1%),
although this difference was not statistically significant (Χ2
[1] = 0.71, p> .05; Cramer’s V = 0.05). Of studies using one or more instruments of data collection for which there were at least 10 cases, those involving the use of only focus groups contained the highest use of nonverbal
communication—albeit only representing one third of these studies (i.e., 10/29 = 34.5%). More than two thirds (i.e., 1 - 54/184 = 70.7%) of studies utilizing only one instrument of data
collection (i.e., interview or focus group or observation, respectively) did not make any reference
to nonverbal communication. In particular, a statistically significantly (Χ2
[1] = 4.50, p < .05;
Cramer’s V = 0.26) higher proportion of studies (1 - 20/115 = 82.6%) utilizing two or more
instruments did not make any reference to nonverbal communication. The Cramer’s V value indicated a large effect size (Cohen, 1988). None of the five studies using dialogue contained an assessment of nonverbal communication. Further, in more than 90% of studies wherein
interviews were coupled with forms of data collection labeled other (e.g., artifacts, photos), nonverbal communication was not discussed.
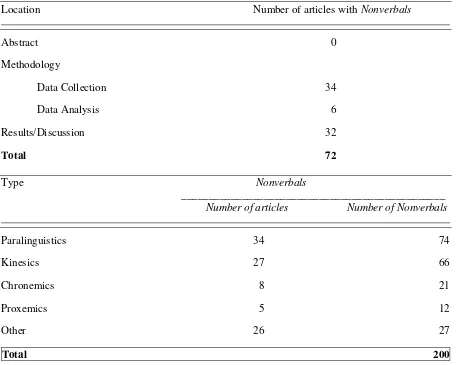
With regard to research designs, 65.5% of grounded theory studies, 73.8% of phenomenological research studies, 83.5% of case studies, and 82.4% of ethnographic studies lacked any discussion of nonverbal communication (cf. Table 2). Further, with regard to the phase of the qualitative research study, notably, nonverbal communication was the least frequent across the data analysis sections of the manuscripts, as illustrated in Table 3. In fact, researchers discussed nonverbal communication in the analysis section in less than 10% (i.e., 6/72 = 8.3%) of articles in which verbal data were collected. Nonverbal communication data were discussed approximately equally in the data collection (i.e., 34/72 = 47.2%) and results/discussion (i.e., 32/72 = 44.4%) sections of the articles. Interestingly, the relationship between nonverbal communication being discussed in the data collection and results/discussion sections of the article was .22, which although
statistically significant (p < .05), represented a small-to-moderate effect size (Cohen, 1988).
Table 2
Occurrences of Nonverbals in TQR Empirical Studies (1992–2012) Based on Data Collection Instrument and Study Design (N = 299)
Instrument Number of cases with Nonverbals Total number
Interview 39 139
Focus group 10 29
Observation 3 11
Interview and observation 9 36
Interview and other 5 51
Interview, focus group, and observation 3 7
Interview and focus group 1 17
Focus group and other 1 1
Observation and other 1 3
Dialogue 0 5
Total 72 299
Design of the study Number of cases with Nonverbals Total number
Grounded theory 19 55
Phenomenology 17 65
Case study 17 103
Ethnography 6 34
Narrative 5 8
Life story 5 12
Evaluation and analysis 3 22
Table 3
Occurrences and Frequencies of Nonverbals in TQR Empirical Studies (1992–2012) Based on Type and Location in the Manuscript (N = 299)
Location Number of articles with Nonverbals
Abstract 0
Methodology
Data Collection 34
Data Analysis 6
Results/Discussion 32
Total 72
Type Nonverbals
________________________________________________ Number of articles Number of Nonverbals
Paralinguistics 34 74
Kinesics 27 66
Chronemics 8 21
Proxemics 5 12
Other 26 27
Qualitative Findings
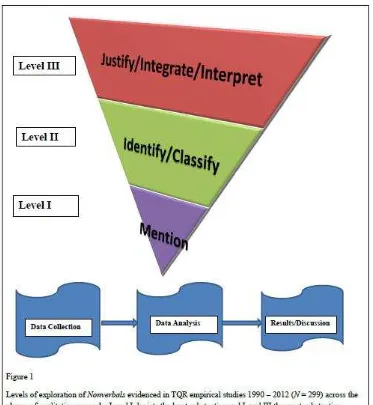
The qualitative analyses revealed varying degrees of discussion of nonverbal data across the articles in which they were recorded, yielding, via the taxonomic analysis, the following 3-level typology: (a) Level 1 denoted instances where nonverbal communication data were introduced generally; (b) Level 2 represented cases where nonverbal communication data were further classified, named, or exemplified in the text; and (c) Level 3 depicted substantial use wherein researchers provided justifications (e.g., purpose of collection of nonverbal data), methods of integration (e.g., ways to merge transcripts and observation data), and interpretative connections (e.g., complementary value of nonverbal communication). Figure 1 displays our emergent typology.
In only a few cases were nonverbal data discussed throughout all sections of the article.
Surprisingly, we did not identify a single case comprising Level 3 indication across all the stages of the research. Integrative Level 3 was underutilized in the data analysis section and it was the most discussed in the results/discussion section. Tables 4, 5, and 6 provide textual examples of varying degrees of discussion of nonverbal communication in the data collection, data analysis, and results/discussion sections, respectively. In Table 4, it can be seen that, for the Level 1 examples, the collection of nonverbal communication was only discussed in general terms, such
as by the author(s) stating that “The researcher did make notes of nonverbal communication where necessary during the interviews.” Here, the author(s) did not specify the types of nonverbal
communication data that were collected or how or when they were collected. In Level 2, the author(s) provided some specifics about the types of nonverbal communication data that were collected but did not explain how or when these data were collected, as exemplified by the
following narrative: “The non-participant observer took copious field notes. Examples of these dynamics were dependency, fight/flight pairing, me-ness and we-ness. Additional dynamics such as silences, turn-taking, and anti-task behavior were noted.” Clearly, the Level 2 examples represent richer information than do the Level 1 examples. However, the authors could have made their descriptions even thicker, as exemplified by the two Level 3 examples in Table 4.
Similarly, in Table 5, going from Level 1 to Level 3, the examples represent thicker descriptions of the role that nonverbal communication played in the data analysis process. Specifically,
making a statement like “[the nonverbal communication data] were manually analyzed for
content and discourse” (Level 1), is not as thick as making a statement such as “We also listened
to the recordings several times to detect vocal tone, delivery, and emphasis” (Level 2), which in turn, is not as thick as making a statement such as “Hence to make them readable, we did not indicate pronunciation, overlaps of intonation, but we pointed out pauses without which the
meaning of what is said might be significantly altered” (Level 3).
As is the case for Table 4 and Table 5, in Table 6, going from Level 1 to Level 3, the examples represent thicker descriptions—however, here, these descriptions occurred in the
results/discussion section of the empirical report. In the Level 1 example in Table 6, the author(s) report the nonverbal communication behavior (i.e., lack of hesitance) but do not provide evidence to support this behavior. In the Level 2 example, the author(s) also indicate the actual nonverbal
communication behavior (i.e., “[laughs]”). Finally, in the Level 3 example, the author(s) go well
beyond describing the nonverbal communication data by making interpretations of these
behaviors (e.g., “… this curt intonation meant one thing: she was done interacting, either because she was upset, annoyed, or offended. It was her linguistic behavior for evasion”).
Table 4
Examples of Nonverbal Communication Explored in TQR Studies 1992–2012 in Data Collection Phase by Level
Data collection Examples Level
Level 1 During and after each interview and focus group, detailed field notes were taken of any nonverbal communication that occurred.
Additionally, through annotations in her journal, Carlson captured informant nonverbal responses as well as her personal reactions and feelings about the interview process.
The researcher did make notes of nonverbal communication where necessary during the interviews.
Level 2 The researcher would record and document all the extraneous reactions by patients such as their voice tones, facial twists, and other non-recordable reactions like tearful eyes, rubbing hands in anguish, and putting on their gloves nervously.
The non-participant observer took copious field notes. Examples of these dynamics were dependency, fight/flight pairing, me-ness and we-ness. Additional dynamics such as silences, turn-taking, and anti-task behavior were noted.
Level 3 I identified cultural mannerisms and responded accordingly. I was aware of a whole body of cultural features and cues in this subtle fabric of non-verbal literacy, which were crucial in my interaction with this group of women. In this sense, cultural literacy was as powerful as literacy in language. My position in the group became even easier and more identifiable.
I also take notes about different aspects of the interview that may be of relevance when interpreting the interaction. If siblings have entered the room and what effect this may have had, how body language has been used in correspondence to different utterances, and how the children in general receive my questions and comments may be of interest when analyzing the interview process in addition to their answers (...) Knowledge produced during the interviews can therefore not be separated from the performances taking place in the interview setting.
Table 5
Examples of Nonverbal Communication Explored in TQR Studies 1992–2012 in Data Analysis Phase
by Level
Data analysis Examples
Level
Level 1 Empirical data from the focus group discussion, and field notes of
observation, including the overt and the covert, were manually analysed for content and discourse.
Level 2 We also listened to the recordings several times to detect vocal tone, delivery, and emphasis.
Researcher field notes of observations provided data regarding the artifacts
in the participants’ homes or offices and some of their responses such as
laughing and body language.
Level 3 (1) denotes a pause < 1 second, (2) means a pause < 2 seconds, (3) represents a pause < 3 seconds. Hence to make them readable, we did not indicate pronunciation, overlaps of intonation, but we pointed out pauses without which the meaning of what is said might be significantly altered.
Table 6
Examples of Nonverbal Communication Explored in TQR Studies 1992–2012 in Results/Discussion Phase by Level
Results/Discussion Examples Level
Level 1 Regardless, the women showed no hesitance in discussing physical changes or to provide specific examples of menopausal symptoms.
Level 2 Yeah see, I just think of all the things that I do that are not feminine (laughs).
Level 3 Chavez: How did you feel?
Carolina: (1 sec. pause) Um. (2 sec. pause). I remember being 12 years old. And I remember my mother bought me a white dress. It was a dress for
Easter. It had little printed flowers on it. I don’t know why I remember that.
I just do. And there were no other churches. Chavez: Did you like going to church? Carolina: Yeah. (curt tone).
Table 7
Functions of Nonverbals Used in TQR Articles 1992–2012
Function Example
Clarification The tone of her answers and the fact that she chose the time of this interview
to glue the photos on the album - I had booked all appointments with her three
weeks in advance - was significant. I read this action as a portrayal of subversion and hostility against the interview and what I represented for her.
Juxtaposition When you were in school, what was your sense of your own ethnicity? Aldo: To tell you the truth, I have never had any ideas (...) And there was something on
TV and I was like “Senad, isn’t that a Serbian name?” (Laughs) I mean ... (rolls
his eyes)Maja: (Smiles) My mom, it probably crossed her mind, well, my son, it
is not. When I think about it now, I can only imagine what had crossed her mind,
they are searching for my son in the war, and he can’t even differentiate the names.
Discovery When I revisited the tape of this part of our conversation, I heard definite lack of
enthusiasmin Tammi’s voice. Unfortunately, (or perhaps fortunately) I was
oblivious to this at the time, and we proceeded with the activity.
Confirmation The pacing of some subjects’ responses also suggested examination of what they were saying in the moment. Kei Huik in particular spoke in exceptionally
well considered phrases with long pauses in between his sentences.
Emphasis Paula: “No, I don’t want to” [Paula starts shaking her head side to side as a nonverbal sign for the word no. She continues shaking side to side and refuses to stop and look at Mrs. Cole.]
Illustration He got married soon; his wife wore that (circles around his head to describe the headscarf).
Elaboration You don’t even want to be in the room when Plastic Surgery and ENT go over who gets to do facelifts (Laughs) I mean blood flows in the halls.
Complementarity Interpreting the covert here-and-now behaviour, it became clear that diversity in the organization was filled with extreme levels of anxiety which were manifested in all kinds of defensive behaviours. When these data are added to the verbatim focus group information, the research results become extremely rich and add comprehensible colour to the empirical data.
Effect Joan, the receptionist, “I just love Sophia. She’s a good girl, isn’t she? Aren’t you Sophia?” in a sing-song, child-like voice.
Corroboration John: I used to play basketball when I was still a student. I was in the school /Verification basketball team. But it is all different now. John then dropped his head,
Discussion
Our study was unique in three ways. First, to date, it represents the only study that examines the frequency and characteristics of nonverbal communication presented in qualitative research articles. Second, this study involves a longitudinal 22-year examination of all qualitative research articles published in the same journal, thereby representing population data. Third, this study involved the application of mixed research techniques to document the use of nonverbal data, which improved the quality of our meta-inferences.
It is not unusual to hear qualitative researchers state that their goal is to capture the voice of the participants (e.g., Bleakley, 2005). Unfortunately, the vast majority of authors of qualitative research articles published in TQR (i.e., approximately 75%) have taken this phrase very literally, by only providing data stemming from verbal behavior and ignoring nonverbal behavior. This trend is extremely disturbing, bearing in mind the potential of nonverbal data to increase understanding—that is, verstehen.
A question to be asked is, are these authors who are not describing and interpreting nonverbal communication data in their empirical articles also not collecting any nonverbal communication data, or are they collecting these data but not using them to inform their analyses and
interpretations of their verbal data, and thus are omitting any discussion of nonverbal
communication data from their reports? Our conversations with numerous qualitative researchers over the last several months lead us to suspect that the latter is more the case—that is, the
majority of qualitative researchers are not collecting nonverbal communication data—at least, not in any planned or systematic manner. Regardless of which reason provides the most pertinent explanation, it should be noted that both reasons lead to further questions. Specifically, why are so many qualitative researchers who submit their articles to TQR either not collecting nonverbal communication data at all or not analyzing, interpreting, and reporting these data? For example, is it because they do not know how to incorporate nonverbal communication data into their analyses and interpretations of verbal data? Is it because including nonverbal communication data
overwhelms them by providing additional data for them to utilize? Is it because including nonverbal communication data adds one or more layers of complexity to their analyses and interpretations, which demotivates them from using it? Is it because they believe that collecting, analyzing, and/or interpreting nonverbal communication data does not provide added value? Among those who collect but do not analyze, interpret, and above all, report nonverbal
communication data, does this occur because of perceived or real space constraints provided by journal editors? Or are some of these researchers receiving negative feedback from reviewers when they submit their manuscripts that contain nonverbal communication data to journals, leading to them stopping this practice? Does a cycle of non-reporting of nonverbal
communication data prevail in which the lack of exemplars of nonverbal communication data reporting has established a hidden curriculum to the majority of qualitative researchers that the collection, analysis, interpretation, and eventual reporting of nonverbal communication data is not important? These and other questions might promote fruitful dialogue among qualitative
researchers.
one or two sentences in 1,210 textbook pages wherein the concept of nonverbal communication is discussed to any degree. However, of these seven instances, the only relevant comment was that provided by Shopes (2011), who stated, albeit briefly, the following:
However, new media’s impact on oral history extends to matters that are far more than
technical; it can be argued that digital technology is shifting the terrain on which oral history has been practiced for the past six decades. Fundamentally, by allowing direct access to the primary document—the recorded interview—new media offer opportunities to restore the oral and the kinesthetic to oral history, and hence the layers of meaning communicated by tone, volume, velocity, pauses, and other nonverbal elements of oral communication, as well as the performative elements of the speaking body. (p. 460)
Even when nonverbal communication is mentioned, as is the case in the quotation above, not only is this mention brief, but also it tends to be written in an abstract manner, thereby providing little or no practical information for qualitative and mixed researchers who are looking for guidance in how to collect, to analyze, and to interpret nonverbal communication data. Further, of the dozens of qualitative syllabi we have examined over the years, we have rarely seen any mention of nonverbal communication data. Thus, from the numerous qualitative research textbooks and syllabi that we have examined, we have come to the conclusion that, at least among qualitative researchers from Western nations, the spoken and written word is privileged over nonverbal communication. The questions to be asked here are: Why is this the case? and Is this justified?— especially bearing in mind that (a) 93% of communication yielded by people represents nonverbal communication (Mehrabian, 1981); (b) the first year of a child’s life (and beyond) is spent
communicating entirely through nonverbal means, and babies learn how to understand nonverbal communication before they learn how to understand verbal communication (Bullowa, 1979); and (c) pet animals communicate with humans primarily nonverbally (Corson & Corson, 1980)?
The taxonomic analysis led to the identification of three levels of reporting nonverbal communication data in the data collection, data analysis, and results/discussion sections of qualitative research articles. By showing exemplars of how these levels yield progressively thicker descriptions and/or interpretations, we hope that we have built a case for the reporting of nonverbal behaviors at a high as level as possible. Consequently, one recommendation that appears to have evolved from the present investigation is that writers of qualitative research textbooks include (much more) discussion about nonverbal communication data. In particular, these authors might consider outlining strategies for collecting, analyzing, and interpreting nonverbal communication data. Perhaps our typology of nonverbal communication (i.e., corroborate, capture, discover, broaden, create new directions) might serve as a useful starting point.
Also, we recommend that instructors of qualitative and mixed research emphasize the importance of nonverbal communication data and, whenever possible, provide exemplars for doing so. Frameworks for collecting, analyzing, and interpreting nonverbal communication data such as that provided by Frels and Onwuegbuzie (2013) and Onwuegbuzie and Byers (in press) might be considered. Although the use of nonverbal communication data in qualitative research studies and the qualitative phase(s) of mixed research studies rests squarely on the shoulders of
researchers/authors, journal editors—at least the editors of TQR—also could play an important role in encouraging such data to be utilized in qualitative and mixed research studies. In
Indubitably, the non-use of nonverbal communication data in qualitative research studies and the qualitative phase(s) of mixed research studies, for the most part, represents an important error of omission. As such, a collective effort is needed to end this cycle of non-use—as has been the case for the vast majority of manuscripts submitted to The Qualitative Report—and, instead, create a culture of nonverbal communication data reporting that involves qualitative research and mixed research instructors, mentors, advisors, thesis/dissertation committee members and
References
Abramovitch, R. (1977). Children’s recognition of situational aspects of facial expression. Child Development, 48, 459–463. doi:10.1111/j.1467-8624.1977.tb01183.x
Bales, R. F. (1951). Interaction process analysis. Cambridge, United Kingdom: Addison Wesley.
Beattie, G., & Shovelton, H. (1999). Do iconic hand gestures really contribute anything to the semantic information conveyed by speech? An experimental investigation. Semiotica, 123(1/2), 1–30. doi:10.1515/semi.1999.123.1-2.1
Beattie, G., & Shovelton, H. (2002). An experimental investigation of some properties of individual iconic gestures that mediate their communicative power. British Journal of Psychology, 93,179–192. doi:10.1348/000712602162526
Beattie, G., & Shovelton, H. (2003). Pragmatic aspects of representational gestures: Do speakers use them to clarify verbal ambiguity for the listener? Gesture, 3, 127–154.
doi:10.1075/gest.3.2.02hol
Beattie, G., & Shovelton, H. (2005). Why the spontaneous images created by the hands during talk can help make TV advertisements more effective. British Journal of Psychology, 96, 21–37. doi:10.1348/000712605X103500
Beattie, G., & Shovelton, H. (2011). An exploration of the other side of semantic communication. How the spontaneous movements of the human hand add crucial meaning to narrative. Semiotica, 184(1/4), 33–51.
Begley, C. M. (1996). Triangulation of communication skills in qualitative research instruments. Journal of Advanced Nursing, 24, 688–693. doi:10.1046/j.1365-2648.1996.02446.x
Berg, B. L. (1995). Qualitative research methods for the social sciences (2nd ed.). Needham Heights, MA: Allyn and Bacon.
Bleakley, A. (2005). Stories as data, data as stories: Making sense of narrative inquiry in clinical education. Medical Education, 39, 534–540. doi:10.1111/j.1365-2929.2005.02126.x
Bowerman, M., & Choi, S. (2001). Shaping meaning for language: Universal and language- specific in the acquisition of spatial semantic categories. In M. Bowerman & S. C. Levinson (Eds.), Language acquisition and conceptual development (pp. 475–511). Cambridge, MA: Cambridge University Press.
Bull, P. (2002). Communication under the microscope: The theory and practice of microanalysis. London, United Kingdom: Psychology Press.
Bullowa, M. (1979). Before speech: The beginning of interpersonal communication. Cambridge, United Kingdom: Cambridge University Press.
Choi, S. (2000). Caregiver input in English and Korean: Use of nouns and verbs in book-reading and toy-play contexts. Journal of Child Language, 27, 69–96.
doi:10.1017/S0305000999004018
Cohen, J. (1988). Statistical power analysis for the behavioral sciences (2nd ed.). Hillsdale, NJ: Lawrence Erlbaum.
Corson, S. A., & Corson, E. D. (1980). Pet animals as nonverbal communication mediators in psychotherapy institutional settings. In S. A. Corson & E. D. Corson (Eds.), Ethology and nonverbal communication in mental health: An interdisciplinary biopsychosocial
exploration (pp. 63–82). Oxford, United Kingdom: Pergamon.
Denzin, N. K., & Lincoln, Y. S. (2011a). Introduction: The discipline and practice of qualitative research. In N. K. Denzin & Y. S. Lincoln (Eds.), Sage handbook of qualitative research (4th ed., pp. 1–25). Thousand Oaks, CA: Sage.
Denzin, N. K., & Lincoln, Y. S. (2011b). Sage handbook of qualitative research (4th ed.). Thousand Oaks, CA: Sage.
Duncan, S., Jr. (1969). Nonverbal communication. Psychological Bulletin, 72, 118–137. doi:10.1037/h0027795
Ekman, P. (1972). Universal and cultural differences in facial expressions of emotion. In J. R. Cole (Ed.), Nebraska symposium on motivation, 1971 (pp. 207–283). Lincoln, NE: University of Nebraska Press.
Ekman, P., & Friesen, W. V. (1974). Detecting deception from the body or face. Journal of Personality and Social Psychology, 29, 288–298. doi:10.1037/h0036006
Ekman, P., O’Sullivan, M., Friesen, W. V., & Scherer, K. R. (1999). Face, voice and body in
detecting deceit. Journal of Nonverbal Behavior, 15,125–135.
Fiedler, K., & Walka, I. (1993). Training lie-detectors to use nonverbal cues instead of global heuristics. Human Communication Research, 20, 199–223.
doi:10.1111/j.1468-2958.1993.tb00321.x
Fielding, N. G., & Lee, R. M. (1998). Computer analysis and qualitative research. Thousand Oaks, CA: Sage.
Fonteyn, M. E., Vettese, M., Lancaster, D. R., & Bauer-Wu, S. (2008). Developing a codebook to guide content analysis of expressive writing transcripts. Applied Nursing Research,21, 165–168.
Frels, R. K., & Onwuegbuzie, A. J. (2013, February). Incorporating nonverbal communication data in interviews: A mixed research framework. Paper presented at the annual meeting of the Southwest Educational Research Association, San Antonio, TX, United States.
Glaser, B. G., & Strauss, A. L. (1967). The discovery of grounded theory: Strategies for qualitative research. Chicago, IL: Aldine.
Gorden, R. I. (1980). Interview strategy techniques and tactics. Homewood, IL: Dorsey.
Graham, J. A., & Argyle, M. (1975). A cross-cultural study of the communication of extra-verbal meaning by gestures. Journal of Human Movement Studies, 1, 33–39.
Greene, C., Caracelli, V. J., & Graham, W. F. (1989). Toward a conceptual framework of mixed-method evaluation designs. Education Evaluation and Policy Analysis, 11, 255–274. doi:10.3102/01623737011003255
Harzing, A. W. K. (2009, January). Publish or perish. Retrieved from www.harzing.com/pop.htm
Heritage, J. (1984). Garfinkel and ethnomethodology. Cambridge, United Kingdom: Polity.
Hirsch, J. E. (2005). An index to quantify an individual’s scientific research output. Proceedings of the National Academy of Sciences, 102(46), 16569–16572.
Holler, J., Shovelton, H., & Beattie, G. (2009). Do iconic hand gestures really contribute to the communication of semantic information in a face-to-face context? Journal of Nonverbal Behavior, 33, 73–88. doi:10.1007/s10919-008-0063-9
Johnson, R. B. (2011). Dialectical pluralism: A metaparadigm to help us hear and “combine” our valued differences. In S. J. Hesse-Biber (Chair), Addressing the credibility of evidence in mixed methods research: Questions, issues and research strategies. Plenary conducted at the meeting of the Seventh International Congress of Qualitative Inquiry, University of Illinois at Urbana-Champaign, United States.
Johnson, R. B., & Christensen, L. (2010). Educational research: Quantitative, qualitative, and mixed approaches (4th ed.). Thousand Oaks, CA: Sage.
Johnson, R. B., & Onwuegbuzie, A. J. (2004). Mixed methods research: A research paradigm whose time has come. Educational Researcher, 33(7), 14–26.
doi:10.3102/0013189X033007014
Johnson, R. B., Onwuegbuzie, A. J., & Turner, L. A. (2007). Toward a definition of mixed methods research. Journal of Mixed Methods Research,1, 112–133.
doi:10.1177/1558689806298224
Jones, S. E., & LeBaron, C. D. (2002). Research on the relationship between verbal and nonverbal communication: Emerging integrations. Journal of Communication, 3, 499– 521. doi:10.1111/j.1460-2466.2002.tb02559.x
Kelly, S. D., Barr, D. J., Church, R. B., & Lynch, K. (1999). Offering a hand to pragmatic understanding: The role of speech and gesture in comprehension and memory. Journal of Memory and Language, 40, 577–592. doi:10.1006/jmla.1999.2634
Kendon, A. (2004). Gesture: Visible action as utterance. Cambridge, MA: Cambridge University Press.
Knapp, M. L., & Hall, J. A. (2010). Nonverbal communication in human interaction (7th ed.). Boston, MA: Wadsworth/ Cengage Learning.
Krauss, R. M., Chen, Y., & Chawla, P. (1996). Nonverbal behavior and nonverbal
communication: What do conversational hand gestures tell us? In M. Zanna (Ed.), Advances in experimental and social psychology (pp. 389–450). San Diego, CA: Academic Press.
Krippendorff, K. (2012). Content analysis: An introduction to its methodology (3rd ed.). Newbury Park, CA: Sage.
Leech, N. L., & Onwuegbuzie, A. J. (2008). Qualitative data analysis: A compendium of techniques and a framework for selection for school psychology research and beyond. School Psychology Quarterly, 23, 587-604. doi:10.1037/1045-3830.23.4.587
Leech, N. L., & Onwuegbuzie, A. J. (2009). A typology of mixed methods research designs. Quality & Quantity: International Journal of Methodology, 43, 265-275.
doi:10.1007/s11135-007-9105-3
Loveland, K. A., Tunali-Kotoski, B., Chen, R. Y., Ortegon, J., Pearson, D. A., Brelsford, K. A., & Gibbs, C. M. (1997). Emotion recognition in autism: Verbal and nonverbal
information. Development and Psychopathology, 9, 579–593.
Manusov, V., & Patterson, M. L. (2006). The Sage handbook of nonverbal communication. Thousand Oaks, CA: Sage.
Mazzei, L. A. (2008). Silence speaks: Whiteness revealed in the absence of voice. Teaching and Teacher Education: An International Journal of Research and Studies, 24, 1125–1136. doi:10.1016/j.tate.2007.02.009
McDonough, L., Choi, S., & Mandler, J. M. (2003). Understanding spatial relations: Flexible infants, lexical adults. Cognitive Psychology, 46, 229–259. doi:10.1016/S0010-0285(02)00514-5
McNeill, D. (1985). So you think gestures are nonverbal? Psychological Review, 92, 350–371. doi:10.1037/0033-295X.92.3.350
McNeill, D. (1992). Hand and mind: What gestures reveal about thought. Chicago, IL: University of Chicago Press.
Mehrabian, A. (1981). Silent communication: Implicit communication of emotions and attitudes (2nd ed.). Belmont, CA: Wadsworth.
Mehrabian, A. (2009). Nonverbal communication (3rd ed.). Piscataway, NJ: Aldine Transaction.
Morgan, D. L. (1997). Focus groups as qualitative research (2nd ed.). Thousand Oaks, CA: Sage.
Morris, D. (1977). Manwatching: Field guide to human behavior. London, United Kingdom: Triad Panther.
Onwuegbuzie, A. J., Byers, V. T. (in press). An exemplar for combining the collection, analysis, and interpretations of verbal and nonverbal data in qualitative research. International Journal of Education.
Onwuegbuzie, A. J., & Collins, K. M. T. (2007). A typology of mixed methods sampling designs in social science research. The Qualitative Report, 12, 281–316. Retrieved from
http://www.nova.edu/ssss/QR/QR12-2/onwuegbuzie2.pdf
Onwuegbuzie, A. J., & Denham, M. (in press). Qualitative data analysis techniques. In R. Warden (Ed.), Oxford bibliographies. Oxford, United Kingdom: Oxford Bibliographies.
Onwuegbuzie, A. J., Leech, N. L., & Collins, K. M. T. (2010). Innovative data collection strategies in qualitative research. The Qualitative Report, 15, 696–726. Retrieved from http://www.nova.edu/ssss/QR/QR15-3/onwuegbuzie.pdf
Onwuegbuzie, A. J., Slate, J. R., Leech, N. L., & Collins, K. M. T. (2007). Conducting mixed analyses: A general typology. International Journal of Multiple Research Approaches, 1, 4–17. doi:10.5172/mra.455.1.1.4
Patton, M. Q. (1990). Qualitative evaluation and research methods (2nd ed.). Newbury Park, CA: Sage.
Potter, W. J., & Levine-Donnerstein, D. L. (1999). Rethinking validity and reliability in content analysis. Journal of Applied Communication Research, 27, 258–284.
doi:10.1080/00909889909365539
Provalis Research. (2009). QDA Miner 3.2.User’s guide. Retrieved from http://www.provalisresearch.com/Documents/QDAMiner32.pdf
Sacks, H., Schegloff, E. A., & Jefferson, G. (1974). A simple systematics for the organization of turn-taking for conversation. Language, 50, 696–735.
Saldaňa, J. (2012). The coding manual for qualitative researchers (2nd ed.). Thousand Oaks, CA: Sage.
Schegloff, E. A. (1968). Sequencings in conversational openings. American Anthropologist, 70, 1075–1095. doi:10.1525/aa.1968.70.6.02a00030
Schegloff, E. A. (1972). Notes on a conversational practice: Formulating place. In D. Sudnow (Ed.), Studies in social interaction (pp. 75–199). New York, NY: Free Press.
Spradley, J. P. (1979). The ethnographic interview. Belmont, CA: Woodsworth.
Stake, R. E. (2005). Qualitative case studies. In N. K. Denzin & Y. S. Lincoln (Eds.), The Sage handbook of qualitative research (3rd ed., pp. 443–466). Thousand Oaks, CA: Sage.
Teddlie, C., & Tashakkori, A. (2009). Foundations of mixed methods research: Integrating quantitative and qualitative approaches in the social and behavioral sciences. Thousand Oaks, CA: Sage.
The Qualitative Report. (2013a). The Qualitative Report: Editorial statement. Fort Lauderdale, FL: Nova Southeastern University. Retrieved from
http://www.nova.edu/ssss/QR/Editorial/editstm.html
The Qualitative Report. (2013b). The Qualitative Report: By the numbers. Fort Lauderdale, FL: Nova Southeastern University. Retrieved from
http://www.nova.edu/ssss/QR/numbers.html
Warren, G., Schertler, E., & Bull, P. (2009). Detecting deception from emotional and
unemotional cues. Journal of Nonverbal Behavior, 3, 59–69. doi:10.1007/s10919-008-0057-7
Weber, R. P. (1990). Basic content analysis. Newbury Park, CA: Sage.
Wolcott, H. F. (1992). Posturing in qualitative inquiry. In M. D. LeCompte, W. L. Millroy, & J. Preissle (Eds.), Handbook of qualitative research in education (pp. 3–52). San Diego, CA: Academic Press.