CHAPTER 1 INTRODUCTION
1.1 Background of Study
Coal is a fossil fuel. It is a combustible, sedimentary, organic rock, which is composed mainly of carbon, hydrogen and oxygen. It is formed from vegetation, which has been consolidated between other rock strata and altered by the combined effects of pressure and heat over millions of years to form coal seams (Williams, 1999). Over the years, coal has been used as a fuel to generate electricity.
Concurrently, many other fuels, mostly un-renewable fuels from crude oil are also used. The amount of these fuels is depleting rapidly.
On the other hand, biomass is the organic material produced from solar energy by photosynthesis. It may be divided into three categories: fuel wood, organic wastes and photosynthesis fuel. Fuel wood is the traditional fuel derived from trees. Organic wastes include farm wastes and urban garbage. The term photosynthesis fuel is retained for lower plants like water hyacinth, algae and grasses. All these materials have a high potential for meeting energy needs.
The oil palm industry in Malaysia started 80 years ago in a modest way. Today it is the largest in agricultural plantation sector, exceeding rubber plantation by more than double in area planted. In terms of hectare, the total area under oil palm cultivation is over 2.65 million hectares, producing over 8 million tonnes of oil annually. The oil consists of only 10% of the total biomass produced in the plantation. The remainder consists of huge amount of lingo-cellulosic materials such as oil palm fronds, trunks and empty fruit bunches.
The projection values of these residues per year are as follow:
• 7.0 million tonnes of oil palm trunks
• 10.0 million tonnes of oil palm fronds
• 23% of Empty Fruit Bunch (EFB) per tonne of Fresh Fruit Bunch (FFB) processed in oil palm mill
* These values depend on the life span of oil palm tree that is due for replanting after about 20-25 years old (Hassan, 2007).
Biomass, specifically Empty Fruit Bunch (EFB) from palm oil wastes is a well- suited resource for co-firing with coal as an acid rain and greenhouse gas emission control strategy. Malaysia owns large palm oil mills and they are underutilized although there have been some attempts to use it to generate bio-energy. Coherent to that, palm oil wastes are being burdened by their producers to be disposed. Moving towards a conscious of zero wastes, palm oil wastes are being increasingly seen as potential source for biomass.
Alternative methods such as co-firing may be carried out. Co-firing is the simultaneous combustion of different fuels in the same boiler. Many coal-fired boilers at power stations in Malaysia have been retrofitted to permit multi-fuel flexibility. Co-firing is a fuel-substitution option for existing capacity, and is not a capacity expansion option.
1.2 Problem Statements 1.2.1 Energy Requirements
The global scenario has shown that energy requirements of the world are getting more crucial as time goes by. Rising fossil fuel prices and rapid depletion of reserves has given a big impact, whereby researchers from all over the world are diversifying the existing energy resources. For Malaysia, the demand of energy consumed by electricity is growing rapidly as the country is becoming a developed nation by 2020.
The fossil fuel reserves are limited and are estimated to last for another 30-40 years (Hassan, 2007). Therefore, increasing the usage of renewable resources in energy generation is essential for the country’s development.
1.2.2 Energy Demand and Supply
Malaysia is a developing country. The peak demand for electricity in Malaysia grew at a rate of 8.0% per annum, from 2000-2010, and will continue to grow to meet the country’s needs due to development. This phenomenon can be seen in the statistics below.
Table 1.1: Installed Capacity, Peak Demand and Reserve Margin, 2000 – 2010, for Tenaga Nasional Berhad (9th Malaysian Plan)
Year Accumulated Installed Capacity (MW)
Peak Demand (MW)
Reserve Margin (%)
2000 12,645 9,712 30.2
2005 17,622 12,493 41.1
2010 22,802 18,187 25.4
Efforts were undertaken to reduce the high dependence on natural gas in the generation mix by increasing the use of coal. As a result, the share of coal to the total generation mix increased from 8.8 per cent in 2000 to 21.8 per cent in 2005 while that of natural gas decreased from 77.0 per cent to 70.2 per cent, as shown in Table 1.2.
Table 1.2: Fuel Mix in Electricity Generation (9th Malaysian Plan) Year Oil (%) Coal (%) Gas (%) Hydro
(%)
Others (%) Total (GWh)
2000 4.2 8.8 77 10 0 69,280
2005 2.2 21.8 70.2 5.5 0.3 94,299
2010 0.2 36.5 55.9 5.6 1.8 137,909
Two main coal power plants in Peninsula Malaysia include TNB Janamanjung, Perak and TNB Kapar, Selangor. The consumption of coal for power generation is expected to reach 19.0 million in 2010, due mainly to the commissioning of two new coal-based generation plants in Peninsula Malaysia, Tanjung Bin Power Station, Johor and Jimah, Neger Sembilan (9th Malaysian Plan). These two coal-based plants will increase the share of coal to 36.5 per cent in 2010 (as shown in Table 1.2).
Efforts will be continued to enhance the security of supply of coal by exploring the potential of developing local sources, particularly in Sarawak as well as securing long term supplies from abroad. The increasing percentage of coal usage in the country has to be taken seriously since the other main sources of energy supply have
reduced the contribution although the total generation is rapidly growing. This indicates that the utilization of coal is still reliable and measures have to be taken to change the method for future benefits.
1.2.3 Renewable Energy
Renewable energy resources that are widely used in Malaysia are hydropower, biomass and solar energy. It was reported that Malaysia produces an estimated amount of 20.8 million tonnes of biomass residues per year. The figure below shows that more than 90% of biomass resources came from palm oil mills and EFB has the largest amount of residues among other parts of the palm oil including fiber, shell and fronds (Lee, 2004).
Figure 1.1: Agricultural Residues
According to 9th Malaysian Plan, the development and utilization of Renewable Energy (RE) will be further intensified. RE projects utilizing municipal waste will also be promoted. By 2010, about 300MW is expected to be generated and connected to the TNB Grid in Peninsula Malaysia. Biomass based co-generation will be expanded in the Plan period. Two new coal-based IPP plants at Tanjung Bin, Johor and Jimah, Negeri Sembilan with a combined installed capacity of 3,500 MW was commissioned during the Plan period. As part of effort to promote the optimal utilization of municipal waste for electricity generation, a pilot project on waste-to- energy will be implemented in Peninsula Malaysia.
1.2.4 Environmental Issues
Energy production and consumption puts undeniable pressure on the environment.
Damage to natural ecosystems and climatic changes are now becoming an alarming issue. Usage of fossil fuels also causes bad environmental issues to the country, mostly uncontrolled release of greenhouse gases. The increased heat trapped in the atmosphere from 0.6 to 2.50C (last 50 years) has increased to 1.4 to 5.80C in the 21st Century (Hassan, 2007). The detrimental effects towards the global climate include unpredictable weather and increasing sea level (10cm to 20cm) submerging of lowlands, deltas and islands.
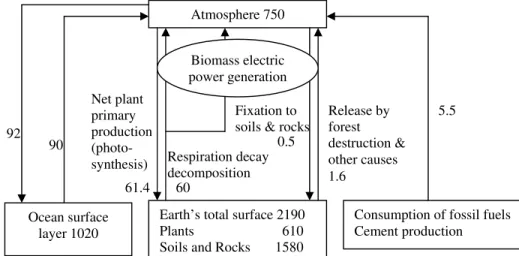
A complete diagram of carbon, of both absorption and release is shown below. In effect, the overall function of the system is to keep the atmospheric carbon dioxide concentration within certain level. Combustion of fossil fuel, by contrast, releases carbon that was stored underground and to the cycle. This represents an irreversible flow of carbon to the atmosphere and should be regarded as a disturbance to the balance of global circulation of carbon (Yamamoto, 2001).
Figure 1.2: Locations and Flow of Carbon in Zones of the Earth developed from the 1994 IPCC (Intergovernmental Panel on Climate Change)
The arrows in the figure represent the flow carbon in terms of Gt/y (giga tons per year), where one giga ton is equal to one billion tons. The numbers in the squares represent carbon stocks in terms of giga tons.
Atmosphere 750
Ocean surface layer 1020
Earth’s total surface 2190 Plants 610 Soils and Rocks 1580
Consumption of fossil fuels Cement production
92 90
5.5
1.6 0.5
60 61.4
Release by forest destruction &
other causes Fixation to
soils & rocks Respiration decay decomposition Net plant
primary production (photo- synthesis)
Biomass electric power generation
The consumption of biomass can never exceed the production. Moreover, the concept of renewability assumes that there will be reproduction corresponding to the amount consumed. The liberation of carbon dioxide by the combustion of biomass is an element of the carbon cycle between the atmosphere and plants and is not a disturbance that could disrupt the balance of the system. Hence, biomass is considered to be an effective fuel for co-firing. Thus, there should be a shifting of paradigm into co-firing coal with biomass, which is abundant, environmental friendly, sustainable and most importantly, renewable (Yamamoto, 2001).
1.2.5 Significance of Project
The study on co-firing coal with EFB is significant to improve the environmental conditions in Malaysia, as well as increase the usage of renewable energy resources.
With large biomass resources, experiments are done in researches on the benefits of co-firing rather than coal firing by itself. The aim is to diversify the fuel resources in Malaysia, as to reduce the dependency on petroleum (9th Malaysian Plan).
1.3 Objectives and Scope of Study
The objectives of the project are as follow:
1. To identify the effects of both coal firing and co-firing coal with biomass in terms of carbon dioxide concentration emission and temperature in the furnace.
2. To simulate the combustion of coal with biomass using Computational Fluid Dynamics method.
3. To decide on the suitable range of blending ratio between coal and biomass for optimum power generation.
This project is feasible due to availability of resources (equipments for laboratory work and simulation) in Universiti Teknologi PETRONAS itself. Samples of Empty Fruit Bunches (EFB) biomass and coal are obtained from oil palm mills in Bota and TNB Janamanjung Power Plant, respectively. The time frame of one year is also sufficient for research and project work, through proper planning and monitoring.
For the first semester, experiments to investigate the suitability of both resources to
be co-fired were done and the range of efficient blending ratio was identified. For the second semester, combustion of coal and EFB would be simulated using FLUENT software. The effects on temperature and carbon dioxide emission when EFB is introduced as the second fuel would be investigated. These simulation results will be verified by experiments to analyze the combusted gases from both coal firing and co- firing coal with EFB.
This project is relevant to the condition in Malaysia which is consuming energy tremendously throughout the recent years. Since Malaysia produces abundant amount of palm oil wastes, specifically EFB and the increasing usage of coal as fuel resources to generate electricity, the study on co-firing both resources are relevant to the country’s condition.
CHAPTER 2
LITERATURE REVIEW
2.1 Coal Firing
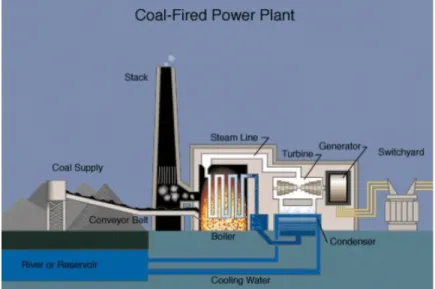
Coal firing is an established electricity source that provides vast quantities and inexpensive reliable power. It has become more important as supplies of oil and gas decreases. Coal power generation is a rather simple process. In most coal fired power plants, chunks of coal are crushed into fine powder and are fed into a combustion unit where it is burned. Heat from the burning coal is used to generate steam that is used to spin one or more turbines to generate electricity.
Figure 2.1: Schematic of a Coal Fired Power Plant
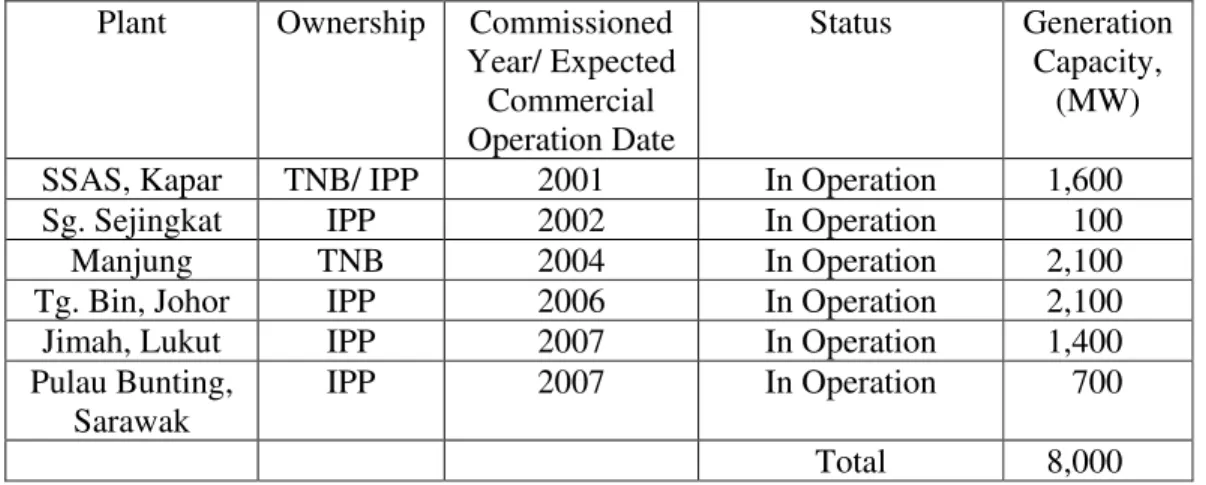
The biggest advantage of coal is that it is far more abundant than oil and gas. There are about 200 years of coal left (but only 100 years if it was used to replace oil and gas). Malaysia has a number of power plants burning coal, listed below (Nasrin, 2006).
Table 2.1: The List of Coal Fired Power Plants in Operation or In the Stage of Development in Malaysia (Nasrin, 2006)
Plant Ownership Commissioned Year/ Expected Commercial Operation Date
Status Generation Capacity,
(MW)
SSAS, Kapar TNB/ IPP 2001 In Operation 1,600
Sg. Sejingkat IPP 2002 In Operation 100
Manjung TNB 2004 In Operation 2,100
Tg. Bin, Johor IPP 2006 In Operation 2,100
Jimah, Lukut IPP 2007 In Operation 1,400
Pulau Bunting, Sarawak
IPP 2007 In Operation 700
Total 8,000
Nevertheless, coal is one of the dirtiest of fuels. Burning it produces enormous amounts of ash, and flue gasses containing pollutants such as sulphur dioxide, nitrogen oxides, sulphuric acids and arsenic. It also produces almost twice as much carbon dioxide as gas (for the same heat). These pollutants can be cleaned out of the system before they are released although this adds an extra expense to the cost.
2.2 Co-firing of Coal with Biomass
Klass (2003) stated that materials such as biomass are solid fuels in their own right, but of low calorific value, of variable composition, and requiring special low- intensity-combustion conditions. If mixed with coal, the average calorific value is increased, enabling it to be burned in conventional combustors and to have more average fuel properties. If coal is mixed with materials such as a typical biomass, then the combustion process can be considered to be increasing CO2 neutral. Its combustion also provides a route to the disposal of unwanted materials with the advantageous production of energy; hence this route is known as “energy from waste”.
There have been extensive research programs over the last decade to increase the use of biomass, and one of the easiest ways of introducing this technology is by co-firing with coal in existing coal installations. Coal is derived from biomass by the process of coalification, and therefore biomass is essentially an extremely low-rank coal.
They have high oxygen content and low carbon content of biomass compared with hard coals. The combustion of biomass is therefore also parallels that of coal in many respects. The first step involves devolatilization similar to that described for coal, namely:
Biomass volatiles + char
where the volatiles have a composition controlled by the biomass composition, the heating rate and the final temperature. A typical representative of biomass would be cellulose, which is the most abundant organic structure in the world, 90% of which is in trees. Cellulose consists of glucose molecules (C6H12O6) linked via oxygen bands, hence the high oxygen content in biomass fuels. Many biomass materials contain mainly CO and some hydrocarbons, and a small amount of tar. The char itself has reactivity similar to coal char and does not contain as much ash, although the nature, their metallic content of Na, K, can mean that they have an enhanced catalytic reactivity especially at low temperatures.
As far as mixtures of biomass and coal are concerned, it can be concluded that the initial components devolatilize and their chars burn independently. The volatiles mix, however, and the calorific value of this mixture and resultant flame temperature is very much a function of the composition of the components; the combined flame temperature is fed back to the initial chemical steps, and consequently, there is a very significant synergistic interaction. The subsequent rates of burn-out of the chars is determined by their individual reactivity (and combined temperature), and generally biomass chars burn out more rapidly that coal chars (Klass, 2004).
Despite the many advantages in co-firing, there are several problems to be resolved before implementation, which are logistical issues of supply and transport. A good collection system must first be set up to ensure a continuous supply of biomass and coal.
Research shows that the blending ratio would depend on the specifications of fuel for the boiler, and the calorific value, but normally at the maximum of 5% to 10%
biomass (Junker, 2005). Thus, in this project, the maximum usage of biomass will be limited to 10% and below. Palm biomass includes Empty Fruit Bunches (EFB), shell, fiber and fronds. Biomass resources to be used in this project are the Empty Fruit
Bunches (EFB) from palm oil wastes. This selection is made based on availability of the biomass in the country which is more than the other resources.
2.3 Combustion Technique
2.3.1 Pulverized-Fuel Combustion
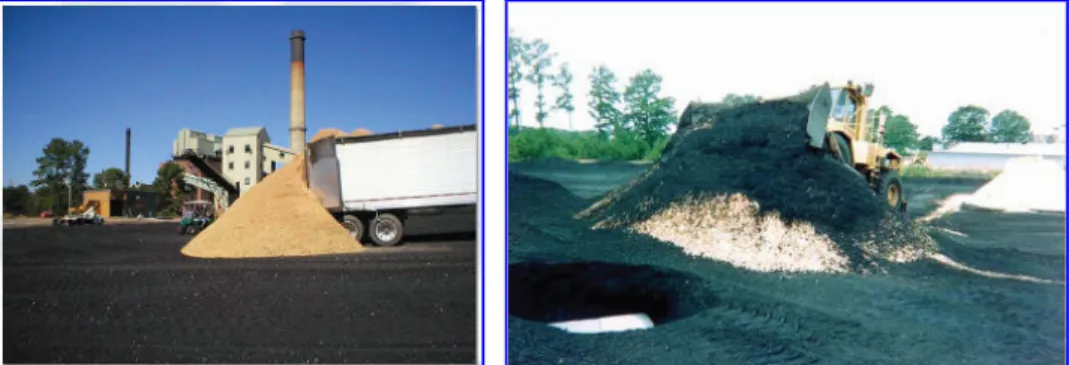
There are two ways to mix the coal-EFB blend. First is co-milling. The biomass is mixed with coal and introduced into the boiler through the coal handling system.
This method reduces capital costs and on-site processing costs. The procedures are shown below. The coal must first be pulverized into powder-like coal.
Figure 2.2: Pulverized Coal
Then, biomass is unloaded onto the pulverized coal and mixed using a bulldozer.
Figure 2.3 & 2.4: Unloading of Biomass and Mixed with Coal The mixed coal and biomass is then pneumatically conveyed to burners.
Figure 2.5: Mixed Coal and Biomass
The combustion of pulverized biomass and mixtures with coal is easier because most of the existing power plants are designed as pulverized-fuel plants. Modification of these plants for multifuel use is obvious but the difficulties are largely unknown – handling, storage, milling processes can cause problems as well as corrosion and slagging effects. Co-combustion of solid biomass in coal fired power plants seems to be a promising technique for the future to contribute both to the reduction of greenhouse gases and to the solution of the waste disposal problem.
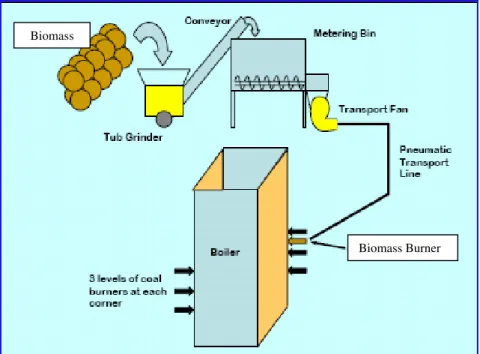
2.3.2 Direct Injection
In this method, biomass is pneumatically injected into the boiler through dedicated burners. This method provides higher co-firing percentages and has separate on-off controls. Nevertheless, this method needs some changes of the mechanism of existing coal firing (Hassan, 2006).
Figure 2.6: Co-firing Method for Direct Injection
Biomass Burner Biomass
CHAPTER 3
METHODOLOGY/PROJECT WORK
In this research, the methodology consists of three main parts, which is the data gathering on the topic, sample testing and software simulation/modeling. Below is the work flow for the project.
3.1 Work Flow
Figure 3.1: Work Flow
Identify the potential biomass – based on availability in Malaysia
Obtain samples of coal from Jana Manjung Power Plant and EFB samples from oil palm mills
Construct experiments for a range of mixing ratios of coal + EFB
Analyzing the combusted gases from coal firing and co-firing coal with EFB by experiments to verify results in simulations
Determine the most suitable blending ratio of coal and EFB to be co-fired Ultimate
Analysis
Proximate Analysis
Calorific Value
Doing simulation using Computational Fluid Dynamics to study the CO2 emission and temperature concentration of coal firing and co-firing coal with EFB
START
END
3.2 Tools and Hardware Required
The equipments that will be used in this project include:
• A Bomb Calorimeter is used in measuring the heat of combustion in a particular reaction. This is to calculate the calorie content of the fuel.
• EFB and coal fuels are analyzed by using ‘Proximate and Ultimate Analysis’.
The tools required for both analyses are Thermal Gravimetric Analyzer (TGA) and CHNS-932 Analyzer. The Proximate Analysis gives the degradation temperature, solvent residues and ash content of EFB and coal.
The Ultimate Analysis gives the composition of the EFB and coal in mole%
of Carbon, Hydrogen as well as Sulfur and Nitrogen.
• For the modeling and simulation of the burner, FLUENT software will be used. The results from simulation will be verified by experiments using Bomb Calorimeter and Gas Analyzer.
3.3 Sample Preparation
After obtaining samples of coal from TNB Janamanjung Power Plant, Manjung and Empty Fruit Bunches (EFB) from Felcra Nasarudin, Bota, both samples were brought to Materials Lab. EFB samples were first dried in an oven for 24 hours at 550C before being crushed using Granulator and coal samples were crushed in Rocklabs to produce powder-like samples. This is similar to the pretreatment of biomass before being utilized as fuel.
Figure 3.2 & 3.3: Crushed Samples of EFB and Coal, Respectively
After all samples were prepared, the coal and biomass powder were blended together according to its percentage. This was done in Chemicals Lab. Eleven samples of different compositions were prepared.
Table 3.1: Samples with Different Compositions
100wt% Coal Melawan (Indonesian Coal) 100wt% Coal Ulan (Australian Coal) 98wt% Coal Melawan + 2wt% EFB 98wt% Coal Ulan + 2wt% EFB 95wt% Coal Melawan + 5wt% EFB 95wt% Coal Ulan + 5wt% EFB 90wt% Coal Melawan + 10wt% EFB 90wt% Coal Ulan + 10wt% EFB 85wt% Coal Melawan + 15wt% EFB 85wt% Coal Ulan + 15wt% EFB
100wt% Empty Fruit Bunches (EFB)
These samples were then tested in laboratories for ultimate analyzes, proximate analyzes and calorific values. The procedures for each experiment are incorporated in Appendix A, B, and C respectively. After all the experimentation work was completed, FLUENT simulation was initiated.
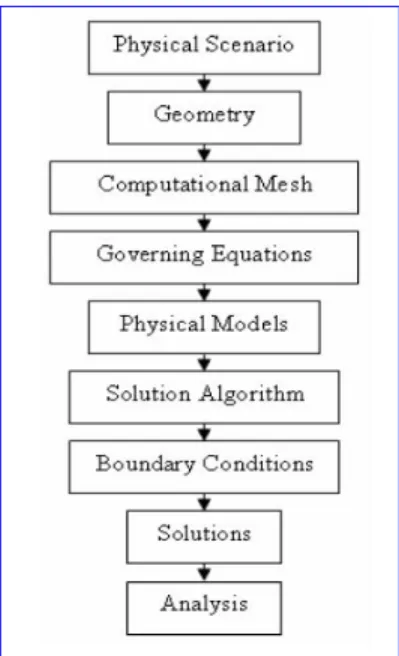
3.4 FLUENT Simulation
FLUENT is a multi-purpose interactive computational fluid dynamics (CFD) software. It is able to simulate complicated chemical reactions, fluid flow and heat transfer through a range of models it has. FLUENT is regarded as the world’s largest provider of CFD software and also its services. Its clients are from various backgrounds of industries such as automotive, aerospace, power generation, biomedical, electronics and even chemical and materials processing (Lee, 2004). In general, any CFD problem could be tackled following the general procedure as shown in figure below.
Figure 3.4: The General Modeling Process
3.4.1 Pre-Processing
It is the first step in building or analyzing a specific design. It includes the model building process which is to be analyzed, applying meshes and input data for the model. The pre-processor provided in the FLUENT package are GAMBIT, G/Turbo and Tgrid.
3.4.2 Solving
The solver, namely FLUENT, does calculations based on the mesh and produces the results required in the analysis.
3.4.3 Post-Processing
It is the final step in the analysis which involves the interpretation and organization of data and images.
3.4.4 Pre-PDF File Definition
For this project, pre-PDF files have been made for Coal Melawan. Only one type of coal was utilized because both Ulan and Melawan coals exhibit similar properties.
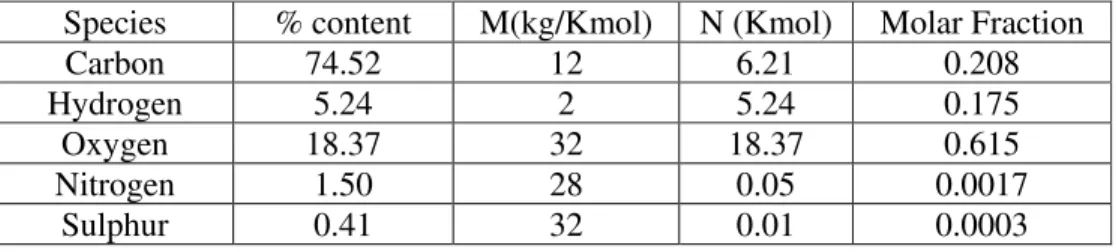
The file produced sets the species or properties identified in the fuel stream, oxidizer stream and secondary stream with respect to its temperatures. The ultimate analysis results are as follows. The mole fraction needed for input in the pre-PDF file was calculated by:
Table 3.2: Mole Fraction for Indonesian Coal (Melawan)
Species % content M(kg/Kmol) N (Kmol) Molar Fraction
Carbon 74.52 12 6.21 0.208
Hydrogen 5.24 2 5.24 0.175
Oxygen 18.37 32 18.37 0.615
Nitrogen 1.50 28 0.05 0.0017
Sulphur 0.41 32 0.01 0.0003
Ntotal Nspecies Mspecies=
The values obtained were provided as inputs for the pre-PDF file at the secondary stream which represents the fuel to be combusted with the oxidizer stream which consists of primarily oxygen and nitrogen gases in the atmosphere.
Conditions applied to the pre-PDF files such as temperatures used were according to the parameter suggested by Lee (2004). The temperatures which were defined were the temperatures of the fuel at 373K, oxidizer at 613K and the secondary air to be preheated to 500K. The data was computed using a non-adiabatic pre-PDF system.
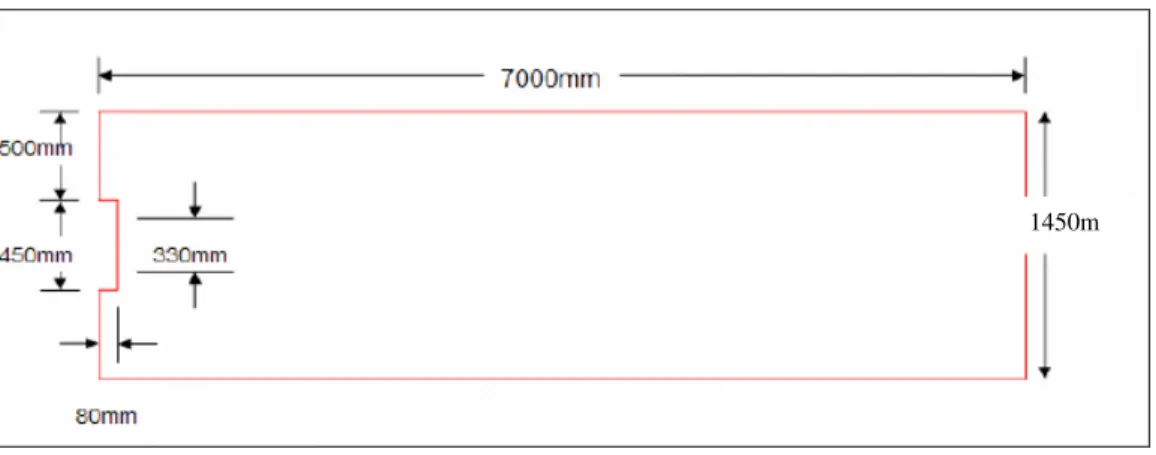
3.4.5 2 Dimensional Modeling of the Burner
In order to model the flame occurring, the burner in the furnace was modeled. For this project, only a single burner was modeled. GAMBIT 1.2 software was used to model the burner which was drawn 2 dimensionally to scale. The model created was adapted from TNB Kapar, Selangor. The real dimensions of the furnace were approximately given by:
o Height = 11m o Width = 7m o Length = 9m
From that, the model of the furnace was created using a control volume of 7m by 1.45m.With the gathered data, the burner was modeled with dimensions shown below:
Figure 3.5: Dimensions of Burner Model (Lee, 2004)
The model was meshed to smaller quadrilateral cells to enable the solver to compute data at these areas.
1450m
3.4.6 Modeling with FLUENT 6.2.16
The analysis of the computational fluid dynamics was done after the meshed file from GAMBIT was exported to FLUENT software for modeling. Using FLUENT, a segregated solver was chosen with an implicit formulation and steady time frame.
From that the mixture of air and fuel is assumed to be fully turbulent, and the effects of molecular viscosity are negligible. For that, the k-epsilon equation was utilized (Lee, 2004).
The mixture of the fuel and air which was created in the pre-PDF file was imported by FLUENT in order for the entry of fuel properties. The fuel inlet was set by the definition of injection where the discrete phase model was used to enable predictions towards the trajectories of each coal particles with the consideration of heat, mass and momentum (Lee, 2004).
Since the properties of the fuel used is unavailable in the definition of injections, medium volatility coal was assumed with its thermodynamic properties altered to suit the respective coal data. The assumptions for both types of coal are the same, except for the volatile composition and the combustible fractions. The assumptions made were tabulated below:
Table 3.3: Constants used in Modeling
Data Indonesian Coal
(Melawan)
Australian Coal (Ulan)
Thermal Conductivity 0.0454 0.0454
Density 1300kg/m3 1300kg/m3
Specific Heat 1000 1000
Volatile Component 28.5 26.6
Binary Diffusivity 5 x 10^-4 5 x 10^-4
Particle Emissivity 0.9 0.9
Scattering Factor 0.6 0.6
Swelling Coefficient 2 2
Burnout Ratio 2.67 2.67
Combustible Fraction 68.6 57.4
3.5 Gas Analysis
Gas analysis is an experiment to analyze the gases combusted from coal firing and coal-EFB blend co-firing from a bomb calorimeter. The Gas Analyzer is used to analyze and measure HC, CO, CO2, O2, NOx (5 gas version), and Air Fuel ratio. It has a Pocket PC based gas analyzer solutions that utilize a portable rugged analyzer design along with current technology to provide unbeatable features in a gas analyzer. It utilizes a hand held PC with touch screen technology setting a new standard in gas analyzer performance. This experiment’s objective is to verify the results obtained from FLUENT simulation. Procedures for operating the Gas Analyzer are attached in Appendix D.
Figure 3.6: Gas Analyzer
Table 3.4: Gas Analyzer Measurement Ranges Range Resolution
HC 0-2000ppm 1 ppm
CO 0-15% 0.001 vol%
CO2 0-20% 0.01 vol%
O2 0-25% 0.01 vol%
NOx 0-5000 ppm 1 ppm
CHAPTER 4
RESULTS AND DISCUSSIONS
4.1 Ultimate Analysis 4.1.1 Results
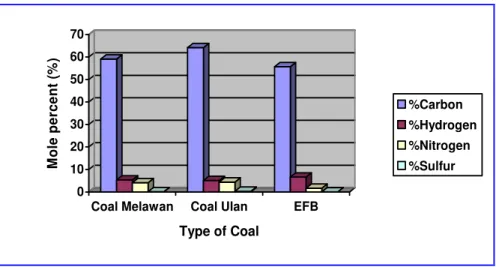
The ultimate analysis was done using two types of coal, Melawan (Indonesian Coal) and Ulan (Australian Coal). The results were analyzed using bar charts according to the type of coal used and composition percentage. Figure 4.1 shows a bar chart with pure component compositions of each type of coal (Melawan and Ulan) and EFB.
Tabulated form of the results is incorporated in Appendix E.
0 10 20 30 40 50 60 70
Mole percent (%)
Coal Melawan Coal Ulan EFB Type of Coal
%Carbon
%Hydrogen
%Nitrogen
%Sulfur
Figure 4.1: Composition Percentage of Pure Component Coal and EFB
Figures below show each type of coal and the respective coal percentages in each sample.
0 10 20 30 40 50 60
Mole percent (%)
100wt% 98wt% 95wt% 90wt% 85wt%
Coal Melawan
%Carbon
%Hydrogen
%Nitrogen
%Sulphur
Figure 4.2: Coal Melawan-EFB Composition Percentages
0 10 20 30 40 50 60 70
Mole percent (%)
100wt% 98wt% 95wt% 90wt% 85wt%
Coal Ulan
%Carbon
%Hydrogen
%Nitrogen
%Sulphur
Figure 4.3: Coal Ulan-EFB Composition Percentages
4.1.2 Discussions
According to the results obtained from the Ultimate Analysis, the carbon content as well as nitrogen and sulphur is decreasing as more percentage of EFB is added into the coal. Consequently, the below combustion equation shows that if the carbon content of the fuel decreases, the amount of carbon dioxide released as a bi-product of combustion decreases. Same goes for nitrogen content.
FUEL + AIR (PURE OXYGEN) HEAT + CARBON DIOXIDE + WATER
For example,
When the carbon content decreases, the amount of carbon dioxide released also decreases. The experiment shows that the amount of pollutant gases produced by co- firing coal and biomass (EFB) reduces as the percentage of EFB in the coal increases.
Unfortunately, the heat produced is also reduced. That is one of the reason why the percentage of EFB used in the mixture can’t be increased too much. If it goes further below, the carbon content is reduced until the efficiency of the heat produced is decreased.
4.2 Proximate Analysis 4.2.1 Results
Results for proximate analysis are only obtained for 100wt% EFB. This is due to equipment constraint. The TGA machine available can only heat the specimen up to 9000C and the burning temperature of coal and coal-EFB specimens should be more than 10000C. Thus, this experiment is not accurate enough to be used against coal, but it can still be applied to EFB.
O H CO
O H
C
10 2231
220
222
22 + → +
O y H xCO y O
x H
C
x y 2 2)
2( 2 4 )
( + → +
+
Below is the result of proximate analysis for EFB.
Figure 4.4: Weight vs. Temperature Curve for 100wt% EFB
4.2.2 Discussions
In most cases, TGA analysis is performed in an oxidative atmosphere (air or oxygen and inert gas mixtures) with a linear temperature ramp. The maximum temperature is selected so that the specimen weight is stable at the end of the experiment, implying that all chemical reactions are completed (i.e., all of the carbon is burnt off leaving behind metal oxides). This approach provides three important numerical pieces of information: ash content (residual mass, Mres), moisture content and degradation temperature (Refer Figure 4.5).
Figure 4.5: TGA Curve
Ash content ~ 20%
Degradation temp ~ 2500C
Degradation temperature is when the curve starts to decline downwards, as shown in the graph above and this indicates that the sample starts to burn at that particular temperature. Moisture content is the amount of moisture in the sample and this is shown in the results of the analysis, whereby during the initial part of the curve, there is a slight decline before the curve is horizontal again. Ash content is the Mres in the curve, showing the weight percent of ash leftovers after complete burning.
The EFB TGA curve shows that after complete burning, the degradation temperature is around 2500C and EFB produces ash content of 20 weight percent of the specimen.
This shows that EFB produces large amount of ash content. For coal, although the result from the TGA is not available, TNB Janamanjung provided data for proximate analysis made by them. Below are the data:
Table 4.1: Ash Content for Each Type of Coal (Data Obtained from TNB Janamanjung)
Coal Melawan Ulan
Ash Content (%) 5.6 2.9
Comparing the ash content of coal and EFB, the differences are large. Usually, ashes from the combustion are sold and used. In biomass firing, the ashes produced are in large quantity but low quality. Thus, they can’t be sold for profit. Therefore, the amount of EFB inserted into the coal for co-firing has to be controlled to produce high quality ashes.
4.3 Calorific Value 4.3.1 Results
The results obtained from the Bomb Calorimeter are as follows. The tabulated form is attached in Appendix F.
0 2000 4000 6000 8000 10000 12000 (cal/g)
Coal Ulan Coal Melawan EFB
Figure 4.6: Heating Value for 100wt% Coal and EFB
8800 8850 8900 8950 9000 9050 9100 9150 9200 9250 (cal/g)
100wt% 98wt% 95wt% 90wt% 85wt%
Coal Melawan
Figure 4.7: Coal Melawan’s Heating Value
10900 11000 11100 11200 11300 11400 11500 11600 11700 11800 11900 12000(cal/g)
100wt% 98wt% 95wt% 90wt% 85wt%
Coal Ulan
Figure 4.8: Coal Ulan’s Heating Value
4.3.2 Discussions
From the results, it is observed that the lower percentages of coal in coal-EFB blend would result in lower heating values. This proves that the higher amount of EFB incorporated into the burning of coal, the lower the heat content produced by burning, thus affecting the quality of the fuel. 85% of coal in coal-EFB blends shows comparatively low heating values.
4.4 FLUENT Simulation
FLUENT simulation demonstrates three types of results; temperature profile, carbon dioxide concentration and nitrogen concentration for each percentage of coal-EFB blend in an injector of a burner. A maximum of 90:10 coal-EFB co-firing ratios are used for simulations.
4.4.1 Temperature Profiles
The results from the contour plots below relates to the static temperature which was found to be in connection to this project.
Figure 4.9: Contour Plots of Static Temperature (Coal)
Figure 4.10: Contour Plots of Static Temperature (98:2 Fuel Blend)
Figure 4.11: Contour Plots of Static Temperature (95:5 Fuel Blend)
Figure 4.12: Contour Plots of Static Temperature (90:10 Fuel Blend)
4.4.2 Nitrogen Concentrations
Figures below are the simulation results for nitrogen concentration in a burner throughout the combustion process.
Figure 4.13: Contours of Nitrogen Concentration (Coal)
Figure 4.14: Contours of Nitrogen Concentration (98:2 Fuel Blend)
Figure 4.15: Contours of Nitrogen Concentration (95:5 Fuel Blend)
Figure 4.16: Contours of Nitrogen Concentration (90:10 Fuel Blend)
4.4.3 Carbon Dioxide Concentrations
Similar to the nitrogen concentration, below are the figures of simulation results for coal firing and coal-EFB blend co-firing.
Figure 4.17: Contours of Carbon Dioxide Concentration (Coal)
Figure 4.18: Contours of Carbon Dioxide Concentration (98:2 Fuel Blend)
Figure 4.19: Contours of Carbon Dioxide Concentration (95:5 Fuel Blend)
Figure 4.20: Contours of Carbon Dioxide Concentration (90:10 Fuel Blend)
4.4.4 Discussions
Through this result, it is able to see that both fuels are producing temperatures around the optimum temperature which is above 2000K (Lee, 2004) and therefore, provided with amounts of excess air, the temperature of these fuels can be lowered to suit the boiler requirements. The fuel rich zone is located at the centre of the peak flame temperature and the temperature is decreasing with the increase in EFB percentages. This is caused by the high moisture and volatility of EFB which in turn reduces the flame temperature of fuel rich zone and similarly decreases the amount of thermal NOx produced due to oxidation of atmospheric nitrogen atoms at high temperatures.
Following on with pollution reduction, the results obtained for the concentration of NOx proves that the NOx emission can be reduced. As can be seen from the contour plots of nitrogen concentration, there exist a reduction on the amount of nitrogen atoms produced as the amount of EFB percentages increase. The reduction in the concentration of nitrogen generally reduces the amount of nitrogen oxides produces.
This is due to lessen amounts of nitrogen atoms which is able to react with oxygen molecules to form NOx in spite of forming due to high combustion temperatures.
However, the actual concentration of CO2 produced by fuel blend has also reduced.
According to Yamamoto (2001), the amount of CO2 produced through the combustion of the biomass (EFB) is generally returned to the carbon dioxide cycle of the atmosphere as it is of equal amount to the CO2 used in its plant cycle. Therefore, the amount of CO2 produced from the fuel blend is generally lower than the coal combustion itself. The reduction of CO2 from coal firing and 90:10 fuel blend is 12.58%.
Nevertheless, any further reduction of coal and increase in EFB percentages for co- firing such as 85:15 fuel blend will reduce the heating value of the combustion (as shown in the result for calorific value). This will result in decrease of temperature and the steam generated will not be able to produce the power required for optimum electricity generation in power plants.
4.5 Gas Analysis 4.5.1 Results
The result from simulation was verified by an experiment using bomb calorimeter and gas analyzer. Table below shows the result of gas analysis done while analyzing the combusted gas from a bomb calorimeter. Gases from the bomb calorimeter are transferred directly into the nozzle of gas analyzer. The procedure for this experiment is appended in Appendix F.
Table 4.2: Combustion Gases for Each Co-firing Percentages Melawan Weight CO2 (%vol) O2 (%vol) NOx (ppm)
100:0 0.893g 29.73 25 85
98:2 1.022g 29.34 25 82
95:5 1.047g 27.66 25 76
90:10 1.013g 25.58 25 71
4.5.2 Discussions
From Table 4.2, it is observed that as the percentage of EFB is used more in co- firing with coal, the percentage volume of carbon dioxide decreases. The same goes to the concentration of NOx. The reduction of CO2 and NOx emission concentration is because of the less significant amounts of carbon and nitrogen elements in EFB. The oxygen level is at a constant value of 25% volume, due to the condition in the bomb calorimeter that allows for complete combustion.
This verifies the reduction in carbon dioxide and nitrogen concentration from the simulation. The patterns of reduction from the simulation results are similar to the reduction in the gas analysis. From the simulation, the reduction in carbon dioxide is 12.58% for 90:10 fuel blend. The gas analysis shows a reduction of 14% of carbon dioxide combusted from 90:10 fuel blend. The calculation for percentage reduction is shown in Appendix G.
The comparison for nitrogen content is more complicated than carbon dioxide content due to various factors affecting the NOx emission. NOx refers to all oxides of nitrogen. According to Lee (2004), the formation of NOx relies solely on high
temperatures and the availability of unused oxygen. There are three types of formation of NOx which are:
i. Thermal NOx: which is formed by the reaction of atmospheric nitrogen and oxygen at high temperatures.
ii. Fuel NOx: oxidation of fuel bound nitrogen
iii. Prompt NOx: formed by reaction of hydrocarbon fragments with atmospheric oxygen.
From the gas analysis result, the reduction is 16.5% whereas in the simulation yields 15.5% reduction. The emissions of NOx have to be examined thoroughly through experimentation with higher precision for more accurate results. Same goes for CO2.
Results from simulation and experimentation differed slightly due to a number of reasons. Below are the reasons:
• Simulation is done in perfect conditions and is not influenced by any external factors, whereby experiment considers all the external factors such as the ambient temperature, wind, flame, moisture.
• As people might say, simulation means “Garbage in, garbage out”. The solver in the software will simulate based on the input assigned and produce the result or output. In experiments, the results would depend on a lot of factors including human errors, parallax errors and surroundings.
• Equipments for experiments: If the equipments used are highly specialized, for example, more specialized equipment could detect the various types of NOx, the results would be more accurate and precise.
The gas analysis proves that FLUENT simulation is reliable to predict the behavior of temperature profile, carbon dioxide concentration emissions and nitrogen oxide concentration emissions.
CHAPTER 5
CONCLUSIONS AND RECOMMENDATIONS
From this project, several conclusions could be drawn from the simulation and experimental results. There were also some recommendations for future work that could probably be carried out to enhance the understanding about coal-EFB combustion and to further improve the accuracy of results.
5.1 Conclusions
The objectives of this project have been achieved throughout literature reviews, experiments and simulations. This project has concluded that:
• From experimental analysis, results show that besides reducing the amount of CO2 produced in the flue gases, through co-firing the blend, pollution emission of NOX can be reduced too.
• From the FLUENT simulation, it has concluded theoretically that, co-firing EFB with coal in small percentages (10%) is able to produce or generate the same amount of steam required to generate electricity, while reducing the amount of CO2 and NOX generated.
• Gas analysis has produced a good verification results towards the simulation, and it is reliable to use FLUENT simulation for analyzing the temperature profile and carbon dioxide concentration for combustion of any fuel blend percentages in a burner.
• The supplementation of EFB has reduced the amount of coal to be used and therefore results in a reduction of costs for coal.
• Application of co-firing EFB with coal in the existing coal-firing equipments reduces cost and time required to design and build new machines.
• No more than 10% of EFB should be used for co-firing due to deterioration in heating value and low quality of ash produced. Therefore 90:10 coal-EFB blend provides the optimum ratio for co-firing.
With the abundance of palm oil wastes in Malaysia and burdened by farmers to dispose them, EFB may eventually become a valuable asset for the country.
Hopefully, co-firing coal with EFB to provide energy can potentially reduce the usage of fossil fuels and diversify the fuel resources.
5.2 Recommendations
To perform Proximate Analysis using a TGA machine with higher range of temperature.
• This would be useful for the analysis of ash content of mixture of coal and EFB. This would help in strengthening the justification for the usage of 90%
coal + 10% EFB for co-firing blending ratio.
To perform modeling of the combustion process with higher percentage of EFB through a separate injection.
• Co-firing using a separate injection mechanism may result in higher percentages of biomass to be fed into the boiler. With the increase in the percentage of biomass, the cost for coal can be lowered due to the decrease in flow rate. Thus, a better understanding of the system may be reached through this step.
To perform modeling for a blend of different types of mixture of coal with EFB.
• Due to the fluctuations of coal supply, different types of coal which is in the specification of Tenaga Nasional Berhad can be used. However, the difference of properties in the fuel may also cause fluctuations to the amount of flow rate and the amount of excess air. Therefore, through the modeling of these blends, a better understanding can be reached according to the real case scenario.
REFERENCES
[1] 9th Malaysian Plan, 2006-2010. Chapter 19: Sustainable Energy Development, p.
393-411.
[2] Baukal, C.E. 2005, Computational Fluid Dynamics in Industrial Combustion, New York, John Wiley & Sons.
[3] Hassan, M.A., Yacob, S. 2007. Biomass Utilization in Malaysia: Current Status of Conversion of Biomass into Bioproducts, Universiti Putra Malaysia.
[4] Junker, H. 2005. Co-firing of 500MW coal-fired power plant with 10% EFB Bales or 5% Shells and as a 2015 Scenario 10% Co-firing of POFF. Report No.
208928, Malaysian –Danish Environmental Cooperation Programme Renewable Energy and Energy Efficiency Component.
[5] Klass, D.L. 2003, Biomass for renewable energy, fuels and chemicals, New York, John Wiley & Sons.
[6] Lee, V.H. 2004. Co-firing of Rice Husk for Electricity Generation in Malaysia.
Degree Thesis, University of Southern Queensland, Australia.
[7] Nasrin, A.B., Ma, A. N., Chow, M. C., Hamdan, H., Choo, Y. M. 2006. Blending of Palm Biomass and Coal: An Alternative Fuel for Power Generation in Malaysia. Vol. 6(2)/2006, Oil Palm Industry Economic Journal.
[8] Tillman, D.A. 2000, The Combustion of Solid Fuels and Wastes, Washington, Academic Press, Inc.
[9] Williams, A., Pourkashanian, M., Jones, J.M, Skorupska, N. 1999. Combustion and gasification of coal: Two-Component Coal Combustion, New York, Taylor
& Francis Inc.
[10] Yamamoto, K. 2001. Biomass Power Generation: Concept of Biomass Power Generation, p. 29-34.