Page | i
“Annexure B”
ANNUAL BUDGET OF
BUFFALO CITY METROPOLITAN MUNICIPALITY
2017/2018 TO 2019/20
MEDIUM TERM REVENUE AND
EXPENDITURE FRAMEWORK (MTREF) BUDGET
26 MAY 2017
Page | ii
Table of Contents
LIST OF TABLES ... III LIST OF FIGURES ... V ABBREVIATIONS AND ACRONYMS ... VI
PART 1 – ANNUAL BUDGET ... 1
1.1 EXECUTIVEMAYOR’SREPORT ... 1
1.2 COUNCILRESOLUTIONS ... 10
1.3 EXECUTIVESUMMARY ... 14
1.4 OPERATINGREVENUEFRAMEWORK... 42
1.5 OPERATINGEXPENDITUREFRAMEWORK ... 61
1.6 CAPITALEXPENDITUREFRAMEWORK ... 68
1.7 ANNUALBUDGETTABLES ... 73
PART 2 – SUPPORTING DOCUMENTATION ... 109
2.1 OVERVIEWOFANNUALBUDGETPROCESS ... 109
2.2 OVERVIEWOFALIGNMENTOFANNUALBUDGETWITHIDP ... 140
2.3 MEASURABLEPERFORMANCEOBJECTIVESANDINDICATORS ... 148
2.4 OVERVIEWOFBUDGET-RELATEDPOLICIES ... 158
2.5 OVERVIEWOFBUDGETASSUMPTIONS ... 161
2.6 OVERVIEWOFBUDGETFUNDING ... 170
2.7 EXPENDITUREONGRANTSANDRECONCILIATIONSOFUNSPENTFUNDS 181 2.8 COUNCILLORANDEMPLOYEEBENEFITS ... 185
2.9 MONTHLYTARGETSFORREVENUE,EXPENDITUREANDCASHFLOW 189 2.10 ANNUALBUDGETANDSDBIP’S–INTERNALDEPARTMENTS ... 196
2.11 ANNUALBUDGETANDSDBIPS–MUNICIPALENTITIESANDOTHER EXTERNALMECHANISMS ... 196
2.12 CONTRACTSHAVINGFUTUREBUDGETARYIMPLICATIONS ... 212
2.13 CAPITALEXPENDITUREDETAILS ... 216
2.14 LEGISLATIONCOMPLIANCESTATUS ... 237
2.15 CITYMANAGER’SQUALITYCERTIFICATE ... 252
ANNEXURES: ... 253
Page | iii
LIST OF TABLES
Table 1: Consolidated Overview of the 2016/17 MTREF Budget ... 25
Table 2: 2017/18 – 2019/20 Capital Budget Per Service... 28
Table 3: Average Tariff increases for 2016/17 to 2019/20 ... 30
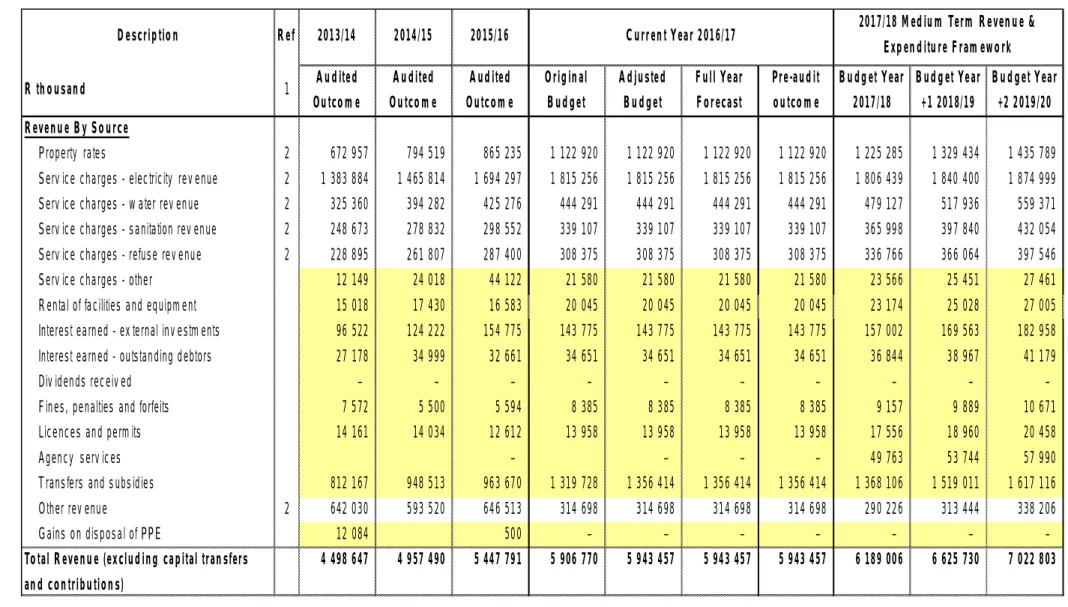
Table 4: Summary revenue classified by revenue source ... 43
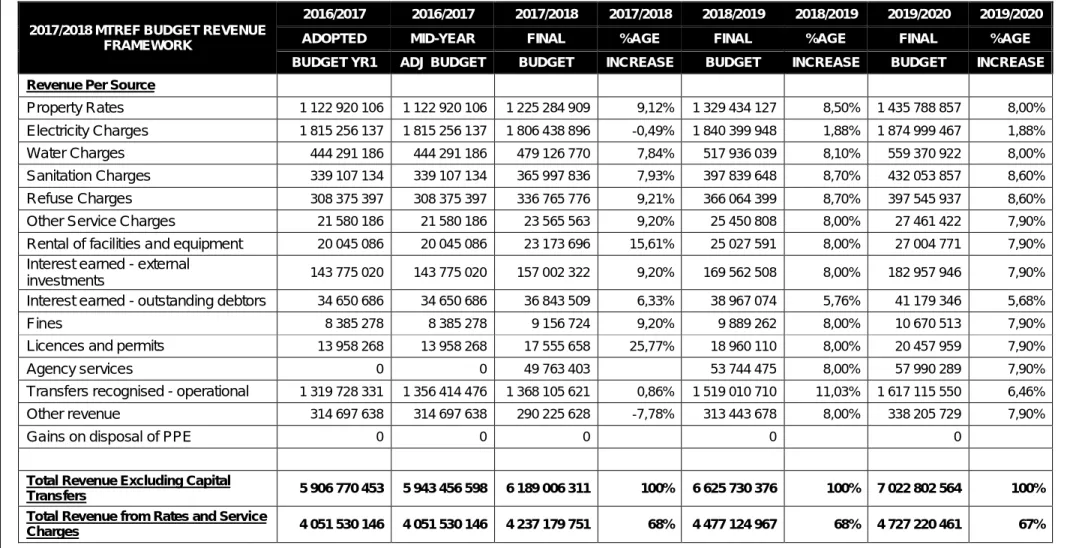
Table 5: Table A4 %age growth in revenue by main revenue source ... 45
Table 6: Table SA18 - Operating Transfers and Grant Receipts ... 47
Table 7: Comparison of proposed rates to be levied for the 2017/18 financial year ... 50
Table 8: Water Tariffs ... 53
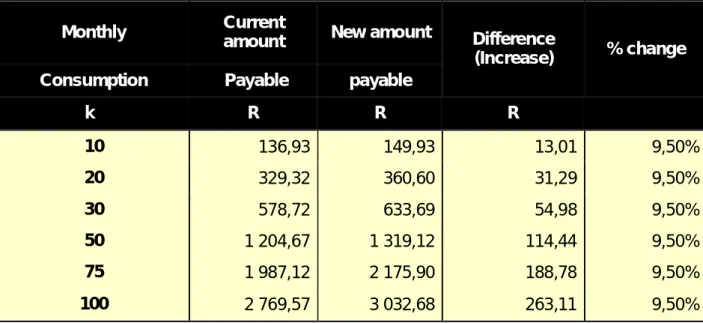
Table 9: Comparison between current water charges and increases (Domestic) ... 53
Table 10: Comparison between current electricity charges and increases (Domestic) . 55 Table 11: Comparison between current sanitation charges and increases, single dwelling- residence (per annum) ... 56
Table 12: Comparison between current refuse removal fees and increases ... 58
Table 13: SA14 – Household bills ... 60
Table 14: Table A4 - Summary of operating expenditure classification by type ... 61
Table 15: Table SA34c – Repairs and Maintenance expenditure by asset type ... 65
Table 16: Basic social services package per indigent household ... 67
Table 17: Table A5 2016/17 Medium-term capital budget per vote, standard classification and funding ... 68
Table 18: List of Key Projects Per Service ... 70
Table 19: MBRR Table A1 – Budget Summary ... 74
Table 20: MBRR Table A2 – Budgeted Financial Performance (revenue and expenditure by function classification) ... 78
Table 21: MBRR Table A3 – Budgeted Financial Performance (revenue and expenditure by municipal vote) ... 80
Table 22: MBRR Table A4 – Budgeted Financial Performance (revenue and expenditure by source and type) ... 81
Table 23: MBRR Table A5 - Budgeted Capital Expenditure by vote, standard classification and funding source ... 85
Table 24: MBRR Table A6 - Budgeted Financial Position ... 87
Table 25: MBRR Table A7 - Budgeted Cash Flow Statement ... 89
Table 26: MBRR Table A8 – Cash Backed Reserves/Accumulated Surplus Reconciliation ... 91
Table 27: MBRR Table A9 – Asset Management ... 93
Table 28: MBRR Table A10 – Basic Service Delivery Measurement ... 98
Table 29: MBRR Table A1 – Consolidated Budget Summary ... 100
Table 30: MBRR Table A4 – Consolidated Budgeted Financial Performance (Revenue and Expenditure) ... 102
Table 31: MBRR Table A5 – Consolidated Capital Expenditure (Vote, Functional Classification and Funding) ... 104
Table 32: MBRR Table A6 – Consolidated Budgeted Financial Position ... 106
Table 33: MBRR Table A7 – Consolidated Budgeted Cash Flows ... 107
Table 34: MBRR Table A8 – Consolidated Cash Backed Reserves / Accumulated Surplus Reconciliation ... 108
Table 35: Key activities in the review of the 2017/18 IDP and MTREF Budget ... 111
Table 36: Schedule of IDP/Budget Road Shows ... 136
Page | iv
Table 37: IDP’S Five Strategic Objectives ... 140
Table 38: Alignment of BCMM Strategic Objectives with National and Provincial Priorities ... 141
Table 39: MBRR Table SA4 - Reconciliation between the IDP strategic objectives and budgeted revenue ... 145
Table 40: MBRR Table SA5 - Reconciliation between the IDP Strategic Objectives and budgeted operating expenditure ... 146
Table 41: MBRR Table SA6 – Reconciliation between the IDP Strategic Objectives and budgeted Capital Expenditure ... 147
Table 42: MBRR Table SA7 - Measurable performance objectives ... 149
Table 43: MBRR Table SA8 - Performance indicators and benchmarks ... 151
Table 44: 2016/2017 to 2019/2020 Budget Assumptions ... 165
Table 45: Indigent Subsidy Package ... 166
Table 46: Tariff increases over the medium-term ... 166
Table 47: Credit rating outlook ... 167
Table 48: Tariff increases 2016/17 to 2019/20 ... 170
Table 49: MBRR Table SA15 – Detail Investment Information ... 171
Table 50: MBRR Table SA16 – Investment particulars by maturity ... 172
Table 51: MBRR Table A5 - Sources of capital revenue over the MTREF ... 173
Table 52: MBRR Table SA17 - Details of borrowings... 174
Table 53: MBRR Table SA 18 - Capital transfers and grant receipts ... 175
Table 54: MBRR Table A7 – Budgeted cash flow ... 176
Table 55: MBRR Table A8 – Cash Backed Reserves/Accumulated Surplus Reconciliation ... 177
Table 56: MBRR Table SA10 – Funding compliance measurement ... 178
Table 57: MBRR Table SA19 - Expenditure on transfers and grant programmes ... 181
Table 58: MBRR Table SA20 - Reconciliation between of transfers, grant receipts and unspent funds ... 183
Table 59: MBRR Table SA22 - Summary of councillor and staff benefits ... 185
Table 60: MBRR Table SA23 - Salaries, allowances and benefits (political office bearers/councillors/ senior managers) ... 187
Table 61: MBRR Table SA24 – summary of personnel numbers ... 188
Table 62: MBRR Table SA25 - Budgeted monthly Revenue and expenditure (Source and Type) ... 189
Table 63: MBRR Table SA26 - Budgeted monthly Revenue and expenditure (Municipal Vote) ... 190
Table 64: MBRR Table SA27 - Budgeted monthly Revenue and expenditure (Functional Classification) ... 191
Table 65: MBRR Table SA28 - Budgeted monthly capital expenditure (municipal vote) ... 192
Table 66: MBRR Table SA29 - Budgeted monthly capital expenditure (Functional classification) ... 193
Table 67: MBRR Table SA30 - Budgeted monthly cash flow ... 194
Table 68: MBRR Table D1 – Budget Summary – (BCMDA) ... 197
Table 69: MBRR Table D2 – Budgeted Financial Performance (revenue and expenditure) – (BCMDA) ... 198
Table 70: MBRR Table D3 – Capital Budget by vote and funding – (BCMDA) ... 199
Table 71: MBRR Table D4 – Budgeted Financial Position – (BCMDA) ... 200
Page | v
Table 72: MBRR Table D5 – Budgeted Cash Flow – (BCMDA) ... 201
Table 73: MBRR Table SD1 – Measurable Performance Targets (BCMDA) ... 202
Table 74: MBRR Table SD2 – Financial and Non-Financial Indicators (BCMDA) ... 203
Table 75: MBRR Table SD3 – Budgeted Investment Portfolio (BCMDA) ... 204
Table 76: MBRR Table SD4 – Board member allowances and staff benefits (BCMDA) ... 205
Table 77: MBRR Table SD5 – Summary of personnel numbers (BCMDA) ... 206
Table 78: MBRR Table SD6 – Budget Monthly Cash and Revenue/Expenditure - (BCMDA) ... 207
Table 79: MBRR Table SD7a – Capital Expenditure on New Assets by Asset Class - (BCMDA) ... 209
Table 80: MBRR Table SD8 – Future Financial Implications on the Capital Expenditure Budget - (BCMDA) ... 210
Table 81: MBRR Table SD9 – Detailed Capital Budget - (BCMDA) ... 211
Table 82: MBRR Table SA33 – Contracts having future budgetary implications ... 213
Table 83: MBRR Table SA35 – Future financial implications of the capital budget ... 215
Table 84: MBRR Table SA34a – Capital expenditure on new assets by asset class .. 217
Table 85: MBRR Table SA34b – Capital expenditure on the renewal of existing assets by asset class ... 219
Table 86: MBRR Table SA34e – Capital expenditure on the upgrading of existing assets by asset class ... 221
Table 87: MBRR Table SA34c – Repairs and maintenance expenditure by asset class ... 223
Table 88: MBRR Table SA34d – Depreciation by Asset Class ... 225
Table 89: MBRR Table SA36 - Detailed capital budget per municipal vote ... 227
Table 90: MBRR Table SA37 – Projects delayed from the previous financial year ... 229
Table 91: MBRR Table SA38 – Detailed operational projects ... 230
Table 92: MBRR Table SA1 – Supporting detail to budgeted financial performance .. 239
Table 93: MBRR Table SA2 – Matrix financial performance budget (revenue source/expenditure type and department) ... 242
Table 94: MBRR Table SA3 – Supporting detail to Statement of Financial Position ... 244
Table 95: MBRR Table SA9 – Social, Economic and Demographic Statistics and Assumptions ... 246
Table 95: MBRR Table SA32 – List of External Mechanism ... 251
LIST OF FIGURES
Figure 1: Cycle of Metro Growth and Development Strategy ... 14Figure 2: Strategic Framework ... 15
Figure 3: 2017/18 Capital Budget Per Service ... 29
Figure 4: IDP Priorities ... 39
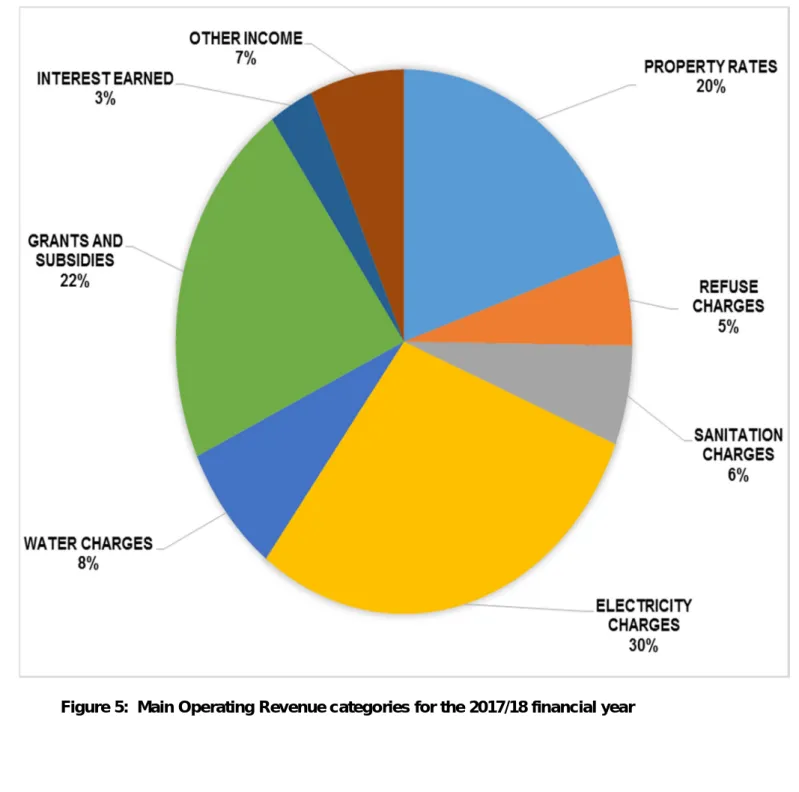
Figure 5: Main Operating Revenue categories for the 2017/18 financial year ... 44
Figure 6: Main operational expenditure categories for the 2017/18 financial year ... 62
Page | vi
ABBREVIATIONS AND ACRONYMS
AMR Automated Meter Reading Km Kilometre
ASGISA Accelerated and Shared Growth Initiative South Africa
KPA Key Performance Area
BCMM Buffalo City Metropolitan Municipality KPI Key Performance Indicator BCDA Buffalo City Development Agency kWh Kilowatt hour
BSC Budget Steering Committee ℓ litre
CBD Central Business District LED Local Economic Development CFO Chief Financial Officer MBRR Municipal Budgeting and Reporting
Regulations
CM City Manager MDGS Metro Growth and Development Strategy
CoGTA Cooperative Government & Traditional Affairs
MEC Member of the Executive Committee
CPI Consumer Price Index MFMA Municipal Finance Management Act CRRF Capital Replacement Reserve Fund MIG Municipal Infrastructure Grant DBSA Development Bank South Africa MMC Member of Mayoral Committee DoRA Division of Revenue Act MPRA Municipal Property Rates Act DWA Department of Water Affairs MSA Municipal Systems Act
EE Employment Equity MTEF Medium-term Expenditure Framework
EEDSM Energy Efficiency Demand Side Management
MTREF Medium-term Revenue and Expenditure Framework
EM Executive Mayor NDPG Neighbourhood Development Partnership
Grant
EPWP Expanded Public Works Programme NERSA National Electricity Regulator South Africa FBS Free Basic Services NGO Non-Governmental Organisations
FMG Finance Management Grant NKPIs National Key Performance Indicators GAMAP Generally Accepted Municipal
Accounting Practice
OP Operational Plan
GDP Gross Domestic Product PMS Performance Management System GFS Government Financial Statistics PPE Property, Plant and Equipment GRAP Generally Recognized Accounting
Practice
PPP Public Private Partnership
HR Human Resources PTIS Public Transport Infrastructure System HSDG Human Settlement Development Grant SALGA South African Local Government Association HSRC Human Science Research Council SDBIP Service Delivery Budget Implementation Plan IDP Integrated Development Plan SMME Small Micro and Medium Enterprises
ELIDZ East London Industrial Development Zone
USDG Urban Settlement Development Grant
INEP Integrated National Electrification Programme
VAT Value Added Tax
IT Information Technology WSA Waster Services Authority
kℓ Kilolitre WSDP Water Services Development Plan
Page | i PART 1 – ANNUAL BUDGET
1.1 EXECUTIVE MAYOR’S REPORT
The Honourable Minister of Finance in his budget speech of 22 February 2017 reminded South Africans about the following realities that the country is facing:
Income growth that has been uneven - the bottom 20 per cent have benefited from social grants and better access to services, the top 20 per cent have benefited from the rising demand for skills and pay increases. Those in the middle have been left behind.
Wealth remains highly concentrated – 95 per cent of wealth is in the hands of 10 percent of the population.
35 per cent of the labour force are unemployed or have given up hope of finding work.
Despite our progress in education, over half of all children in Grade 5 cannot yet read adequately in any language.
More than half of all school-leavers each year enter the labour market without a senior certificate pass. 75 per cent of these will still be unemployed five years later.
Our towns and cities remain divided and poverty is concentrated in townships and rural areas.
Our growth has been too slow – just 1 per cent a year in real per capita terms over the past 25 years, well below that of countries such as Brazil, Turkey, Indonesia, India or China.
The speechalso indicated that the above problems are not unique to South Africa as they mirror the stresses of poverty and vulnerability in many developing countries, and the inequality between rich and poor throughout the world. It further state that even in the developed world, there are serious faultiness and uncertainty:
Citizens lack of trust in elites
Growing inequality
Globalisation benefitting a few
Stagnant and falling incomes of the middle class.
All the above are contributing negatively to the world’s performance on economic growth.
Page | 2 On global economic outlook the speech suggest that after several years of tentative economic growth, there are signs that a more sustainable recovery might be under way:
Growth in the United States and Europe is steady, although at low levels.
India and China remain comparatively buoyant, and economies such as Russia and Brazil are set to recover from recessions.
The International Monetary Fund projects that the world economy will grow by 3.4 per cent in 2017 and 3.6 per cent in 2018.
Coming to South Africa, the Honourable Minister highlighted that moderate GDP growth recovery is anticipated as GDP growth is expected to increase from 0.5 per cent last year to 1.3 per cent in 2017, and will continue to improve moderately over the medium term. The Honourable Minister, however cautioned that,the projected rate of growth is not sufficient to reduce unemployment or impact significantly on poverty and inequality. It falls well short of our NDP goals. He further outlined the following several specific imperatives that are required in order to boost investment in the short term:
Finalising legislation relating to mining development and land redistribution.
Implementing the transition from analogue to digital television, which will release spectrum for broadband services.
Continuing our independent power producer programme, both in renewables and to take advantage of gas investment opportunities.
Further strengthening of economic regulatory functions and streamlining investment approval processes.
Production-friendly industrial relations and prompt resolution of disputes.
An enabling environment for small enterprises and support through leveraging both public and private sector procurement budgets.
Focused support on labour-intensive sectors, including agriculture, agro-processing and tourism-related services.
Strengthening regional ties and trade links.
Safeguarding South Africa’s investment-grade credit rating
Page | 3 In concurrence with the above, the Honourable Member of Executive Council (MEC) of the Eastern Cape for Finance in his budget speech of 02 March 2017 indicated that, while the global economic environment remains undefined, indications are that we have entered a period of recovery. The speech further indicated that the weak global and domestic economic environment has had a knock-on effect on the levels of economic activity in our province. The Honourable MEC also state that without economic growth we will not be able to generate the levels of revenue required to sustain our infrastructure investments and social programmes.
In response to the above challenges the Honourable MEC tabled the following mitigating measures against budget cuts:
Fiscal Sustainability
Strict implementation of cost containment measures
Containment of the Provincial Wage Bill
Increase in Own Revenue Generation; and
Rationalisation of Public Entities
The Buffalo City Metropolitan Municipality understands that it is not immune to the economic challenges that are experienced globally, by South Africa and most closely, the province of the Eastern Cape. Therefore, BCMM has taken and continued to follow conservative approach in the manner in which it approaches this MTREF budget. This approach includes giving consideration in the budget to the cost containment measures suggested by National Treasury. These measures are being implemented in an attempt to ensure the future viability of the institution and to focus on reducing the negative impact on the residents within our boundaries. Continuing from prior year cost containment measures, the following cost containment measures have been applied in the 2017/18 MTREF budget:
Feeling of vacant funded posts has been frozen with the exception of few critical posts.
Scarce skills allowance and additional responsibility allowance not to be implemented going forward.
General Expenditure budget has been reduced by 8% in the 2017/18 financial year.
Page | 4
Measures have been put in place to reduce overtime by 50% in the 2017/18 financial year.
No inflationary increase has been factored on contracted services for the 2017/18 financial year.
The exercise of scrutinising cost drivers within our value chain to identify areas for efficiency improvement is still on-going.
It gives me great pleasure to announce that our total budget (operating and capital) for the MTREF period is growing from R7.83 billion in the 2017/18 to R8.84 billion in the 2018/19 financial year, it further grows to R9.41 billion in the 2019/20 financial year of which consistently over R1.5 billion per annum has been allocated for infrastructure investment.
Our commitment to respond to our people’s legitimate demand for a better life is reflected in a budget in which the key priorities are Water and Sanitation, Roads and Storm water, Human Settlements development, Transport Planning, Electricity and related critical infrastructure and maintenance. In a continued effort to create jobs for the communities of Buffalo City and to encourage private sector investment the capital budget is being focused on a mix social and economic infrastructure investments. This is our contribution in trying to turn the corner from the economic hardships that our country experienced in the past few years since the global recession. As part of the City’s long term plan on human capital development, the city has allocated funding for internship programmes, especially in the areas of finance and engineering as well as the EPWP Programme. The City further continues to allocate funding for bursaries to its employees as well as communities of BCMM. This is in line with, and reflects our commitment to the priorities of the National Development Plan and Provincial Development plan while of course reflecting our own Constitutional role as a local actor on the national stage. The budget allocation is based on the priorities that have been identified through the City’s IDP reviews process. It also seek to works towards achieving the goals that are set in the recently adopted Metro Growth and Development Strategy.
In total, the budget for our capital and operating projects amounts to about R7.31 billion over the MTREF period (2017/18: R1.9 billion, 2018/19: R2.6 billion and 2019/20: R2.8 billion. The municipality has recognised the economic adversities that is currently being
Page | 5 experienced by its citizens and in an attempt to relieve the growing poverty it has taken a decision to strive to keep its tariff increases at the most minimal feasible levels. This has resulted in the Metro increasing its tariffs a single digit percentage increase on Property Rates and all the services.
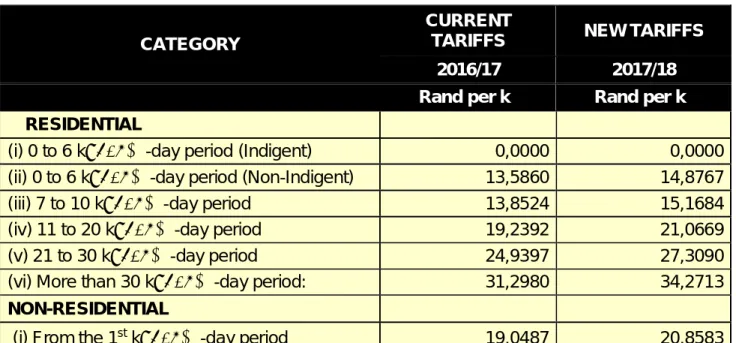
On Property Rates the increase has been set at 9.6% for 2017/18 financial year, the increase is decreased to 8.5% in 2018/19 financial year and it is further reduced to 8% in the 2019/20 financial year. Refuse Removal has been to increase by 9.8% for 2017/18 financial year, the projected increase is decreased to 8.7% and 8.6% in the two outer years respectively. Water and Electricity losses remain a concern. For the Water Service, the tariff increases are projected at 9%, 8.1%, and 8% over the 2017/18 MTREF period respectively.
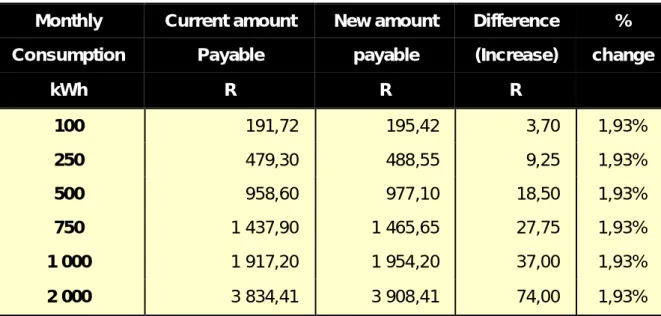
On Electricity, an increase of 1.88% is proposed over the MTREF period in line with the NERSA guideline. The Sewerage tariff increase has also been kept below double digit percentage increase, it is projected to increase 9.8% for the 2017/18 financial year, and this increase is reduced to 8.7% and 8.6% in the two outer years respectively.
The preparation of the General Valuation Roll as required by the Municipal Property Rates Act was undertaken and was implemented on 1 July 2014. Supplementary Valuations will continue being regularly conducted throughout the year. The City is currently in the process of undertaking the preparation of the next General Valuation Roll for implementation on 01 July 2018.
In a continued effort to ensure future financial viability of the city continuous review of the operational cost base is being undertaken in an attempt to identify inefficiencies. This has yielded positive results hence the institution has been able project reduced tariff increases.
The institution will continue focusing on the operational budget in the 2017/18 financial year in order to reduce further any inefficiency and thereby reduce the impact on Buffalo City Metropolitan Municipality residents. The City strives to ensure that the tariffs are cost reflective of the services that have been provided. It is however important to mention the fact that the City's revenue base is not at the required levels due to high rural areas that are part of the Metro. This required creative and innovative ways of ensuring efficiency in
Page | 6 whatever activities that are undertaken. We shall continue to strive for equal service levels for all our communities in the Metro.
We have been mindful that inflation leads to more pain for the poor than any other group. I am happy therefore to propose that the 8.85% increase of the basic welfare package for households that qualify in terms of our policy, which means that the indigents of Buffalo City will continue to have a safety net of free basic services, translating in the new year to a basket of services to the value of R623.08 per household per month.
In support of our local economy, the Directorate of Economic Development & Agencies is running programmes in an effort to reduce unemployment and indigent rate in our Metro.
The Directorate has been allocated a capital budget of R156 million (R43 million, R59 million and R50 million) over the MTREF period
In the coming year our engineers will continue with the process of eradicating backlogs in water supply infrastructure whilst also attending to aging infrastructure. We will continue to meet our pressing sanitation challenges in rural areas and informal settlements, as well as expanding the capacity of infrastructure in our urban area to accommodate and open opportunities for further developments.
Our Water Services benefit to a total capital budget of R665 million over the MTREF period (2017/18: R130 million, 2018/19: R220 million and 2019/20: R315 million) to expand our water infrastructure, to augment water treatment capacity and to eradicate backlogs in access to potable water supply. This includes the amount of R200 million from own funds specifically for the replacement and refurbishment of existing infrastructure within the Metro that has been allocated in the MTREF. It also include an amount of R230 million from loan funding to be utilised on Umzonyana Dam Upgrade project,
For Wastewater Treatment infrastructure, a total capital budget of R1.4 billion over the MTREF period has been allocated to this trading service (2017/18: R283 million, 2018/19:
R569 million and 2019/20: R497 million). This includes an amount of R322 million from own funds specifically for the replacement and refurbishment of existing infrastructure within the
Page | 7 Metro that has been allocated in the MTREF period. It also include an amount of R434 million from borrowings to be utilised over the MTREF period fund the Sewer Diversion Tunnel project.
An amount of R837 million (2017/18: R271 million, 2018/19: R261 million and 2019/20:
R304 million) has been set aside over the next three (3) years for the construction and refurbishment of Roads and Storm Water infrastructure across the City. The City is also continuing with the process of fleet renewal and procuring its own specialized vehicles for the maintenance and construction of rural roads. A total allocation of R60 million has been provided for this over the MTREF.
Electricity Trading Service has been allocated R499 million over the MTREF period (2017/18: R148 million, 2018/19: R152 million and 2019/20: R199 million) for bulk infrastructure, electrification and upgrading of informal areas. This includes the amount of R300 million from own funds specifically for the replacement and refurbishment of existing infrastructure within the urban core that has been provided in the MTREF (R100 million each year). BCMM is still proceeding with investigating potential alternative sources of energy to ensure a more sustainable energy mix by 2030. The BCM State of Energy Report (2008) highlighted some issues and opportunities associated with sustainable energy in BCMM. These are outlined here below:-
Energy not necessarily used efficiently or sustainably - Energy demand is increasing, the focus has been on increasing supply, rather than managing demand;
Lack of incentive to use energy efficiently;
There are a number renewable energy, energy efficiency and carbon trading opportunities in BCMM;
A number of sustainable energy initiatives have been planned for implementation by the municipality. Energy-efficient municipal operations provide a way to cut running costs while reducing negative impact on the natural capital.
Our Municipal Services Directorate is scheduled to spend a capital budget amounting to R533 million in the forthcoming MTREF period of which R120 million that is from own funds
Page | 8 will be spent over the MTREF period (R40 million per year) on Construction and Refurbishment of Waste Cells at Landfill Sites; Cemeteries as well as a range of public amenities including community halls, sports facilities, etc. Each year the City’s cemeteries are being brought under increasing pressure as a result of the elevated mortality rate in Buffalo City. This requires our Environmental Services Department annually to identify potential new sites for cemetery development that meet the rigorous requirements of environmental legislation, while being close enough to our settlements to be practically useful. An amount of R30 million over the MTREF period has been provided for development and upgrading cemeteries in the Metro.
From the Health, Public Safety and Emergency Services perspective, an amount of R55 million has been allocated over the MTREF period. The City has allocated R35 million in the MTREF period towards fire engines, fire equipment and disaster management vehicles & equipment to ensure that we are able to swiftly respond to fire and disaster emergency calls. An amount of R11 million has been set aside in the MTREF period for the KWT Traffic Building. A further R6 million has been provided over the MTREF period for installation of Closed Circuit Television Network in order to improve safety in the Metro.
Transport Planning continues to be a focus area for the institution considering the higher traffic volumes on our roads. In order to ensure that we are alleviating congestion and protecting our inhabitants an amount of R636 million (2017/18: R134 million, 2018/19: R247 million and 2019/20: R256 million) has been allocated in the MTREF period for the implementation of integrated transport plan. This includes the establishment and refurbishment of transport facilities.
On Spatial Planning and Development, the City will be spending R195 million (2017/18:
R63 million, 2018/19: R83 million and 2019/20 R50 million) over the MTREF period towards achieving spatial transformation and integration.
The municipality’s only entity, Buffalo City Metro Development Agency (BCMDA) whose mandate is to drive Buffalo City Metropolitan Municipality’s development has started to
Page | 9 operate. Appointment of Board members and administrative staff was done and the Agency is expected to start with the implementation of some developmental projects in the MTREF period within the City in line with its mandate. This is an attempt to grow the local economy through encouraging private sector investment. To allow the agency to realise its mandate, the City has set aside an amount of R23.1 million for 17/18 financial year as an operational grant to the agency. This amount will be escalated with CPI increase for the two outer years to R24.4 million and R25.8 million respectively. The above figure are vat inclusive.
BCMM, a City growing with you has a story to tell, I would like to believe, that this is a metro that is moving progressively towards being more productive, more sustainable, more responsive, more developmental and indeed more people-centred than we have been in the past.
Page | 10 1.2 COUNCIL RESOLUTIONS
On 26 May 2017 the Council of Buffalo City Metropolitan Municipality convenes to consider the 2017/18 Integrated Development Plan (IDP) Review, Medium Term Revenue and Expenditure Framework (MTREF) and Built Environment Performance Plan (BEPP). It is recommended that the Council approves and adopts the following resolutions:
1. The Council of Buffalo City Metropolitan Municipality, acting in terms of Section 34 of the Municipal Systems Act, 32 of 2000 approves and adopts the revised 2017/18 Integrated Development Plan (IDP).
2. The Council of Buffalo City Metropolitan Municipality, acting in terms of DoRA, 2017 approves and adopts the 2017/18 Built Environment Performance Plan (BEPP)
3. The Council of Buffalo City Metropolitan Municipality, acting in terms of section 24 of the Municipal Finance Management Act, (Act 56 of 2003) approves and adopts:
3.1. The annual budget of the parent municipality (BCMM) for the 2017/18 MTREF and the multi-year and single-year capital appropriations as set out in the following tables:
3.1.1. Budgeted Financial Performance (revenue and expenditure by standard classification) as contained on {Table 20};
3.1.2. Budgeted Financial Performance (revenue and expenditure by municipal vote) as contained on {Table 21};
3.1.3. Budgeted Financial Performance (revenue by source and expenditure by type) as contained on {Table 22}; and
3.1.4. Multi-year and single-year capital appropriations by municipal vote and function classification and associated funding by source as contained on {Table 23}.
Page | 11 3.1.5. Budgeted Financial Position as contained on {Table 24};
3.1.6. Budgeted Cash Flows as contained on {Table 25};
3.1.7. Reserves and accumulated surplus reconciliation as contained on {Table 26};
3.1.8. Asset management as contained on {Table 27}; and
3.1.9. Basic service delivery measurement as contained on {Table 28}.
3.2. The annual budget of the municipal entity (BCMDA) for the 2017/18 MTREF as set out in the following tables:
3.2.1. Budgeted Financial Performance (revenue by source and expenditure by type) as contained on {Table 69};
3.2.2. Budgeted Financial Position as contained on {Table 71};
3.2.3. Budgeted Cash Flows as contained on {Table 72};
3.2.4. Budgeted Capital by Vote and Funding as contained on {Table 70}
3.3. The consolidated annual budget of the municipality the 2017/18 MTREF as set out in the following tables:
3.3.1. Budgeted Financial Performance (revenue by source and expenditure by type) as contained on {Table 30};
3.3.2. Budgeted Financial Position as contained on {Table 32};
3.3.3. Budgeted Cash Flows as contained on {Table 33};
3.3.4. Reserves and accumulated surplus reconciliation as contained on {Table 34};
3.3.5. Budgeted Capital by Vote and Funding as contained on {Table 31}
4. The Council of Buffalo City Metropolitan Municipality Council, acting in terms of section 75A of the Local Government: Municipal Systems Act (Act 32 of 2000) approves and adopts tariffs (percentage increase contained on {Table 3}) effective from 1 July 2017:
4.1. property rates – as set out in Annexure E 4.2. electricity – as set out in Annexure E 4.3. water – as set out in Annexure E
4.4. sanitation services – as set out in Annexure E 4.5. solid waste services – as set out in Annexure E 4.6. other services as set out in Annexure E
Page | 12 5. To give proper effect to the municipality’s annual budget, the Council of Buffalo City
Metropolitan Municipality approves:
5.1. That an indigent subsidy be granted to registered indigents in terms of Council’s Indigent Policy.
5.2. That an indigent consumer be given a maximum subsidy on his/her account of R623.08 per month, which includes a maximum of 50kwh for electricity and 6kl for water.
5.3. That free basic electricity be granted for a registered indigent consumer of 50KWh per month.
5.4. That free basic water be granted to a registered indigent of 6Kl per month.
6. The Buffalo City Metropolitan Municipality Council, approves and adopts the new as well as the revised budget related policies as set out in Annexures F, G, H, I, J, K, and L:
6.1. Tariff Policy (Revised)
6.2. Budget Virement Policy (Revised) 6.3. Credit Control Policy (Revised) 6.4. Indigent Policy (Revised)
6.5. Supply Chain Management Policy (which include Supply Chain Management Policy on Infrastructure Procurement and Delivery Management) (Revised)
6.6. Immovable Asset Management policy (New) 6.7. Movable Asset policy (New)
7. That Council note the budget-related policies adopted in the previous financial years and where no amendments have been made after review, as listed in Section 1.3.8.2 of this report and are available on BCMM’s website at www.buffalocitymetro.gov.za .
Page | 13 8. That in terms of Section 24(2)(c)(iii) of the Municipal Finance Management Act, 56 of 2003, the measurable performance objectives for capital and operating expenditure by vote for each year of the medium term revenue and expenditure framework as set out in Supporting Table SA7 {Table 42} be approved.
9. That in terms of Section 24(2)(c)(iv) of the Municipal Finance Management Act, 56 2003, the amendments to the Integrated Development Plan as set out in the Budget Chapter 17 be approved.
10. Council notes that the 2017/18 MTREF Budget tabled for adoption is structured in terms of the then Buffalo City Metropolitan Municipality votes and functions.
11. MFMA Circular 85 and 86 Municipal Budget Circular for the 2017/18 MTREF attached as Annexure N to be noted by Council.
____________________________
X. PAKATI
EXECUTIVE MAYOR
Page | 14 1.3 EXECUTIVE SUMMARY
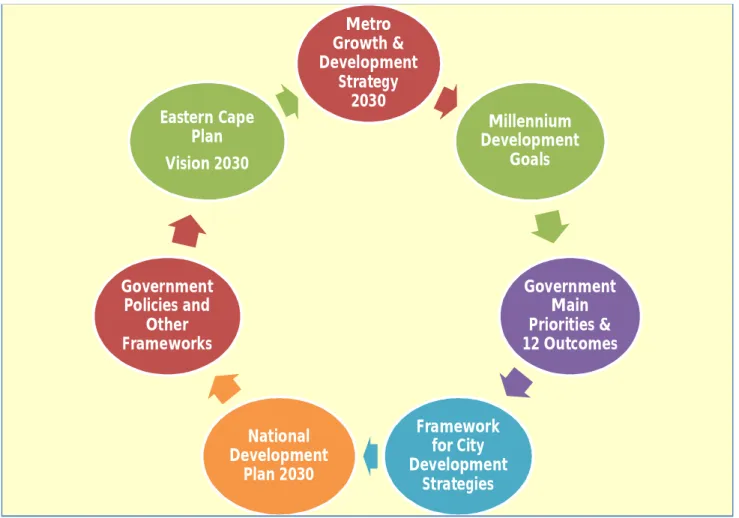
Buffalo City Metropolitan Municipality adopted the Metro Growth and Development Strategy in November 2015. The MGDS serves as the blueprint for social and economic development in the Metro towards the year 2030. The IDPs to be implemented in the next 15 years will be informed by the vision of the MGDS.
1.3.1 Metro Growth and Development Strategy
Figure 1: Cycle of Metro Growth and Development Strategy Metro
Growth &
Development Strategy
2030
Millennium Development
Goals
Government Main Priorities &
12 Outcomes
Framework for City Development
Strategies National
Development Plan 2030 Government
Policies and Other Frameworks
Eastern Cape Plan Vision 2030
Page | 15 1.3.1.1 Key Objectives of MDGS
• A strategy is a journey towards a common destination;
• Providing a liveable environment for the next generation;
• The Metro need to be competitive and find its niche in its region and amongst other secondary cities; and
• The city as a well governed city that is driven by insight and vision; and
• A Metro Growth and Development Strategy is a long term vision and goes beyond the IDP as a metro’s 2030 vision.
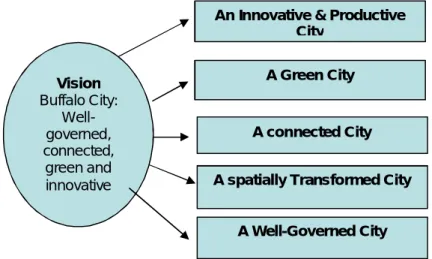
Figure 2: Strategic Framework
1.3.2 Scoping the Landscape
BCMM continues to take a more conservative approach in the manner in which it approaches the budgeting including the mid-year adjustment budget. This approach includes giving consideration in the budget to the cost containment measures suggested by National Treasury. These measures are being implemented in an attempt to ensure the future viability of the institution and to focus on reducing the impact on the residents within our boundaries.
Electricity loses remain a challenge, let alone the fact that keeps on reducing the benefit that has been realised from Electricity Trading Service as the highest contributor to the City’s internally generated funds. In an effort to curb this challenge, the City is progressing with the programme of electrifying informal dwellings and has budgeted R70 million over
Vision Buffalo City:
Well- governed, connected,
green and innovative
A Green City
A connected City A spatially Transformed City
A Well-Governed City An Innovative & Productive
City
Page | 16 the 2017/18 MTREF period (R10 million for each of the first two years and R50 million for the last year) towards this programme. Regarding Water Service, it continues to be of concern that indigent residents continue to utilise water in excess of what is allocated in term of the approved subsidy. This is cause for concern in that water needs to be considered a scare resource requiring focused demand and supply management. The demand management needs to be focused surrounding penalising individuals for excessive usage through either punitive tariffs or restricting use through engineering techniques. Supply management requires forward planning and allocating budget to meet and undertake infrastructure expansion to meet those demands. The staged tariff is used on water tariff as part of an effort to manage demand. Water losses are still significant and continues to be one of the focus areas for reduction in the MTREF budget whereby an amount of R200m of own funds over the 2017/18 MTREF period has been budgeted for replacement of old infrastructure. A further amount of R230 million has been budgeted over the MTREF period for the upgrade of Umzonyana Dam to be funded by a loan funding. The upgrade of this dam is crucial as it is envisaged to lower the cost of water to the consumer as the City will have more capacity to produce its own water and have insignificant need if any to procure expensive water from Amatola Water.
The key liquidity metrics are deemed to be currently adequate however to ensure future viability the institution needs to determine creative ways in which it can commence planning to fund the infrastructure replacement which is expected to occur over the medium to long term. This will require the institution to budget surpluses to allow for adequate funding of historical shortfall of depreciation on existing infrastructure assets as well as the creation of own funded new assets.
In the short term the Urban Settlement Development Grant (USDG) will be used to create new infrastructure in the previously disadvantaged areas and to replace existing infrastructure in those areas where infrastructure is nearing or has exceeded its useful life. This is required to ensure the continued economic growth of the city and to allow for business confidence.
Page | 17 The institution has historically undertaken capital projects with the view of expansion of the City. It is however recognised that capital expansion cannot occur indefinitely without corresponding economic growth else the cost of replacement of infrastructure, through the depreciation impact on operational budgets, will outweigh the affordability of the local economy. It is with this in mind that there needs to be strategic shift of focus towards creating infrastructure with the express purpose of job creation and creating an environment which is conducive to private sector investment in certain key industry points.
1.3.3 The National Development Plan
The National Development Plan which was adopted at the ANC’s 53rd National Conference in Mangaung identifies 5 pillars for the economy to grow to a level to which we can create sustainable jobs, these are;
Creating an environment for sustainable employment and economic growth;
Promotion of employment in labour-absorbing industries;
Promoting exports and competitiveness; strengthening the capacity of government to implement its economic policy, and
Demonstrating strategic leadership among the stakeholders to mobilise around the national vision.
These pillars continue to be the cornerstone of the strategy which the country would like to follow into the future. It would therefore appear appropriate to discuss which infrastructure projects are currently in progress. In the context of the National Development Plan, as Buffalo City Metropolitan Municipality, we see our primary task as developing and maintaining our infrastructure in order to ensure that private sectors partners see the potential to keep increasing their investment in our City, while creating more jobs for our residents.
1.3.4 Local Economic Development
One of the key objectives of local government in carrying out its developmental mandate is creating a conducive environment for economic development. This relates to a number of areas ranging from a conducive, business-friendly regulatory environment, competitive
Page | 18 costs of doing business, ensuring the provision of economic infrastructure, swift and predictable turn-around times for approval processes, etc.
Buffalo City Metropolitan Municipality is faced with a myriad of economic challenges, including amongst others the stubborn levels of high unemployment, especially amongst the youth, poverty, stagnant economic growth, dis-investment followed by job-shedding in certain instances, skills flight, low levels of entrepreneurial activity.
On the contrary, the city is full of potential in areas that require significant levels of public sector investment through infrastructure to leverage private sector participation. This ranges from tourism, agriculture and agro-processing, maritime sector, renewable energy, aquaculture, information and communication technology, to name a few.
In addressing the issues that challenge the prosperity of its citizens and the city’s sustainability in terms of its ability to increase its revenue base, Buffalo City has put a number of mechanisms and institutions to stimulate economic growth, accelerate entrepreneurship, facilitate job creation, improved positioning of the city as an investment and tourism destination of choice.
1.3.4.1 Buffalo City Metro Development Agency (BCMDA)
The city has taken huge strides in re-establishing this entity, which, amongst others, will drive tourism infrastructure and real estate investment. This in the backdrop of the somehow strong performance of the tourism sector in the city, its strategic location, rich heritage and cultural assets, scenic beauty and unspoilt beaches.
1.3.4.2 East London Industrial Development Zone (EL IDZ)
The East London IDZ’s key mandate is to ensure that jobs are created by attracting foreign direct investment. As a shareholder, BCMM is playing its part to ensure an enabling environment for the IDZ to operate in conditions that allow them to realize their strategic goals by making available 870 hectares of land in the Berlin area. This area, in particular, is an existing industrial area and has been earmarked as the Renewable
Page | 19 Energy Hub. It is envisaged that a cluster of activities covering the entire value chain including other complementary industries will be developed in this area. The EL IDZ will tap into its existing Renewable Energy Training Centre for skills.
There is currently a process underway to renegotiate the incentives which would be applicable to the IDZ over the medium term. The next three years will also see the implementation of the various co-operation agreements dealing with matters of mutual interest and broader community benefit such as waste to energy initiatives, aquaculture incubation, research and development as well as innovation through the Science and Technology Park (STP).
1.3.4.3 Invest Buffalo City
The Metro has partnered with organized business and a number of key institutions in endeavour to join forces to intensify and coordinate its investment promotion efforts.
There is an Advisory Board which steers and directs the work of Invest Buffalo City. The Metro has made financial contribution towards this cause over the next three years and the partners will provide technical expertise, research, marketing and other in-kind support. A full-time resource has been appointed to coordinate, lobby further support and assess impact of the efforts.
1.3.4.4 Priority Sectors
Automotive Sector
As a metro we are working hard to ensure that we support our auto sector by developing and maintaining our infrastructure in order for this sector to operate efficiently. We are very keen to maintain our niche in the auto sector by leveraging on the opportunities presented by the planned expansion of the Mercedes Benz South Africa (MBSA) and introduction of new models. We trust that this opportunity will lead to creation of new SMMEs on the supplier development front.
Page | 20 Further to the manufacturing side, the city is also supporting the after-market. The city will continue its support to the Auto Incubator in Mdantsane and subsequently contribute towards reviving the township economy.
Manufacturing Sector
The manufacturing sector is a vital sector for the city and the prosperity of the services sector is dependent upon a strong manufacturing base. Currently the non-automotive sector has experienced challenges which have led to de-industrialisation and job losses.
BCMM is determined to play a positive role to assist the non-automotive sector to be a thriving economic role player and major employer. BCMM will also look at implementing incentives for the non-automotive sector as a stimulus package, working closely with the department of trade and industry (the dti). Electricity incentives will be the base line for interventions as it the main cost of production to the sector. BCMM is fully determined to play its role in an effort to reindustrialise the City and create sustainable jobs.
Marine Sector
Some scoping and investigations are currently being undertaken with DEDEAT, EL IDZ, BCMM, Transnet and other key players to package opportunities for ship building and repairs. There are also several ocean economy opportunities that are being investigated to ensure the city optimises its coastal location and enable investment, skills and job creation.
Tourism Sector
The city will review its tourism strategy and amongst others will re-inforce the heritage, arts, culture, infrastructure and events pillars. Significant efforts will also be redirected towards marketing which will be done domestically and internationally in conjunction with key players such as South African Tourism (SAT), Eastern Cape Parks and Tourism and Agencies (ECPTA) and tourism industry.
Page | 21
Township Economy
The Township Economy has been identified as a major development priority. Businesses in the township are marginalised from the mainstream economy. BCMM is fully committed to revive the township economy by focusing on SMME development. The City will partner with the Department of Small Business Development and DTI to turn township from mainly areas of consumption to areas of productivity. This will best be achieved by intervention in the value chain of production to ensure products are produced and sold in the townships, infrastructure development will act as an enable to reviving the township economy
Central Business District Revitalization
It is recognised that the metro needs to create an environment which is conducive for private business investment. This environment needs to have stability in terms of various transport options as well as quick decision making capabilities.
A potential “game changer” which has occurred in the 2014/15 financial year is the successful completion of a property transaction for the purchase of land called “The Sleeper Site” which is situated in the centre of the central business district. This land was purchased from Transnet at a market related value. The institution is currently requesting interested parties to undertake a planning exercise to assess the most appropriate design for the land to assist in the economic growth of the city as well as encouraging development, which will assist in the revitalization of the CBD.
1.3.4.5 Revitalization Of Industrial Areas
The institution has identified a further 5 specific existing areas which it considers as business development nodes and, as such, areas which it considers as having huge benefits to potential investors. These areas are:
1) West Bank 2) Wilsonia 3) Fort Jackson 4) Berlin
Page | 22 5) Dimbaza
All these areas have existing infrastructure which, with minimal investment, could yield significant benefits for the local economy and contribute to the GDP of the country. It further needs to be recognised that these are effectively business nodes which could be developed to be closer to areas of labour resulting in reduced travelling costs for the labour force.
A fully-fledged business case has been developed for Dimbaza championed by the Eastern Cape Development Corporation (ECDC) as the landlord, supported by the dti, Department of Rural Development and Land Reform (DRDLR). BCMM has pledged its support for this initiative, which is envisaged to be executed over a 10-year period.
1.3.4.6 Skills Development, Employment Readiness And Research Collaboration
The focus needs to be on more permanent job creation, reducing dependence on social grants in the form of indigent subsidies. This will allow individuals to pay for the services they are receiving and allow for the reallocation of funds to other areas of focus.
This intervention will be coupled by institutions of higher learning partnering with the City in conducting research to find new value adding industries.
Over the next three years, the city will refocus its public employment programmes to ensure that those involved acquire new skills and are able to graduate into entrepreneurs or improve chances of employability.
1.3.5 Charting the Way Forward
The Honourable Minister of Finance of South African in his budget speech that he delivered on the 22 February 2017 charted the way by highlighting several specific imperatives that are required in order to boost investment in the short term:
Finalising legislation relating to mining development and land redistribution.
Page | 23
Implementing the transition from analogue to digital television, which will release spectrum for broadband services.
Continuing our independent power producer programme, both in renewables and to take advantage of gas investment opportunities.
Further strengthening of economic regulatory functions and streamlining investment approval processes.
Production-friendly industrial relations and prompt resolution of disputes.
An enabling environment for small enterprises and support through leveraging both public and private sector procurement budgets.
Focused support on labour-intensive sectors, including agriculture, agro-processing and tourism-related services.
Strengthening regional ties and trade links.
Safeguarding South Africa’s investment-grade credit rating.
National Treasury have recognised the importance of total urban settlement development and, in support thereof, has created the Built Environment Performance Plan (BEPP).
This plan is to ensure infrastructure projects are focused on economic corridors to have maximum benefit for the inhabitants of the city.
The Honourable MEC of the Eastern Cape for Finance in his budget speech of 02 March 2017 stated that, we must as a province, across all sectors and among all stakeholders, become seized with the responsibility of growing our investment and output. He further stated that, we need to work hand in hand with the private sector to reduce costs of doing business and address constraints to business expansion.
In concurrence with the above the City compiled this budget with the intention of keeping the cost of business within BCMM jurisdiction low and also to create a City that is investors friendly. Although it is recognised that there is an onus on the City to provide social support to its dwellers that are financially challenged, this is not considered the most beneficial for the individuals or the local economy. As such, focus needs to be on the creation of sustainable jobs through encouraging private sector investment in the City.
Page | 24 This strategy will identify certain economic zones where there is existing significant capital investment, and offer incentives to business over a period of time to invest in those areas.
This will allow individuals who may have been financially challenged to become active members of the local economy.
The institution has undertaken an exercise to analyse the capital infrastructure investment between social and economic investment with a target being placed of 60% economic investment and 40% social investment. Although the institution has not managed to achieve these target levels for all years in the MTREF period, it will continue attempting to achieve these targets going into the future in line with the strategic focus being given in the National Development Framework. It needs to be recognised that there have been a significant number of housing projects which entered their implementation phase resulting in pressure being placed on the MTREF budget.
Funding for the 2017/18 and 2018/19 infrastructure projects have been allocated in an attempt to ensure projects which are currently underway are completed and implemented for the benefits of the community to which they relate. The current capital work in progress continues to be a focus area to ensure the infrastructure assets are completed and brought into use.
The institution has taken a further strategic decision to invest funding to replace existing infrastructure. The investment is to be focused on the urban core which will allow for the upgrading of infrastructure to enable a regeneration of the central business area thereby encouraging private sector investment and job creation. The City is working on improving public transport network for easy accessibility and traffic flow within the CBD. This is a further effort to encourage private sector investment into the urban core.
Currently the City is in a fortunate financial position in that it has a low gearing ratio together with its “A” Long Term Rating (Global Credit Rating) thus allowing the city to obtain additional long term borrowings. A strategic decision has been taken that acquiring borrowings, these funds would be utilized on assets that are expected to generate a
Page | 25 return. However, the City continues to be cautious in accessing these borrowing facilities in an effort to ensure that they are kept at fordable level due to insufficient operating surpluses allowing for capital repayments. Projects need to be assessed in terms of additional revenue that can be generated for the City in order to determine the potential ability of the institution to repay the loan.
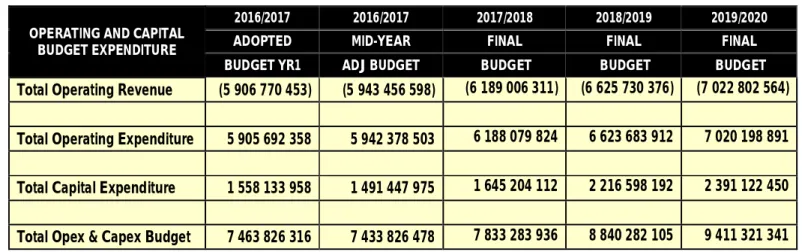
MFMA Circular 85 and 86 were taken into consideration in the preparation of the 2017/18 MTREF Budget. The BCMM consolidated budget for the 2017/18 MTREF period is R7.83 billion (2017/18), R8.84 billion (2018/19) and R9.41 billion (2019/20) with the table below summarising the consolidated overview of the 2017/18 MTREF Budget.
Table 1: Overview of the 2016/17 MTREF Budget
OPERATING AND CAPITAL BUDGET EXPENDITURE
2016/2017 2016/2017 2017/2018 2018/2019 2019/2020
ADOPTED MID-YEAR FINAL FINAL FINAL
BUDGET YR1 ADJ BUDGET BUDGET BUDGET BUDGET
Total Operating Revenue (5 906 770 453) (5 943 456 598) (6 189 006 311) (6 625 730 376) (7 022 802 564)
Total Operating Expenditure 5 905 692 358 5 942 378 503 6 188 079 824 6 623 683 912 7 020 198 891
Total Capital Expenditure 1 558 133 958 1 491 447 975 1 645 204 112 2 216 598 192 2 391 122 450
Total Opex & Capex Budget 7 463 826 316 7 433 826 478 7 833 283 936 8 840 282 105 9 411 321 341
The City’s revenue has increased by 4% whilst the expenditure increase is also 4% from 2016/17 revised budget to the 2017/18 budget. The capital budget has increase by 10%
resulting in the overall total budget increase of 5% from the 2016/17 revised budget to the 2017/18 budget. The operating revenue increase is mainly attributable to tariff increase as well as slight growth in revenue base e.g. new connections, supplementary valuation to include new developments and rezoning. The operating expenditure increase is mainly attributable to annual increase that is linked to CPI and additional repairs and maintenance provision to respond to the aging infrastructure. The increase in capital expenditure is in respond to service delivery needs to address backlogs and renew aging infrastructure.
Page | 26 1.3.5.1 Revenue & Expenditure Strategy
The municipality’s revenue strategy is built around the following key components:
Efficient revenue management, which aims to ensure not less than 92.5% annual collection rate over the medium term for property rates and other key service charges.
Though conservative approach was used in compiling this budget, based on revenue collection of 92.5%, the institutional set target for revenue collection is 92.5% for 2017/18 financial year, 93% for 2018/19 and 93.5% for 2019/20 financial year.
Achievement of full cost recovery of specific user charges especially in relation to trading services.
The City is striving to ensure that all its trading services are financially self-sustainable.
Move from a flat-rate billing system to all consumers billed according to consumption.
Implementation of an automated billing system as opposed to a manual meter reading process.
Regular Supplementary Valuations performed. The policy is for a minimum of 2 Supplementary Valuations per year, the City is however implementing monthly Supplementary Valuations.
The successful implementation of a General Valuation on 1 July 2014 and then every four years thereafter in terms of the Municipal Property Rates Act.
Creating a conducive environment to attract potential investors.
Review of the Spatial Development Plan to allow for human capital resources to be closer to economic and job opportunities.
The municipality’s expenditure strategy is built around the following key components:
Ensuring that capital expenditure is incurred in line with the requirements detailed in the Spatial Development Plan to ensure maximum return to the municipality.
Re-prioritisation of expenditure to ensure any inefficiencies are eliminated in an effort to contain costs, inter alia:
o Vacant funded posts have been frozen with the exception of few critical funded posts.
o No inflationary increase has been allocated on Contracted Services in 2017/18 financial year.
Page | 27 o General Expenses have been reduced by 8% in 2017/18 financial year.
o Reduction of overtime by 50%.
o Scarce skills allowance and additional responsibility allowance not to be implemented going forward
Additional funding allocation to the maintenance (Repairs and Maintenance budget has been increase by 10%) as well as renewal of existing infrastructure.
Funding of own funded operating projects is depressed, encouraging in-house implementation of projects through normal operating budget.
The capital expenditure of the municipality is guided community priorities as contained in the IDP. The asset management plans are also informing the asset renewal programme that is funded through capital budget. The City is also striving to have a good balance between social and economic infrastructure investment. The table below reflects the Capital Budget for services for the 2017/18 MTREF period.
Page | 28 Table 2: 2017/18 – 2019/20 Capital Budget Per Service
2017/2018 CAPITAL BUDGET PER SERVICE
Services
2017/2018 Capital Budget
2018/2019 Capital Budget
2019/2020 Capital Budget
Water 130 000 000 220 000 000 315 000 000
Waste Water 283 698 323 569 075 093 497 348 450
Electricity 148 000 000 152 000 000 198 500 000
Roads and Stormwater 270 956 000 261 457 000 304 099 000
Housing 185 855 000 107 504 640 129 965 000
Transport Planning 133 517 000 246 732 000 255 680 000
Local Economic Development 42 600 000 59 000 000 50 000 000
Spatial Planning 62 704 000 82 700 000 49 500 000
Waste Management / Refuse 65 821 640 79 452 360 125 000 000
Amenities 99 527 149 104 377 100 59 000 000
Public Safety 29 705 000 14 320 000 11 350 000
Support Services 169 820 000 296 980 000 372 680 000
Other - BCM Fleet 23 000 000 23 000 000 23 000 000
TOTAL PER SERVICE 1 645 204 112 2 216 598 192 2 391 122 450
Page | 29 Figure 3: 2017/18 Capital Budget Per Service
A major portion of the capital budget in the 2017/18 MTREF period has been allocated to the major infrastructure services (Waste Water: 17%, Roads and Storm Water: 17%).
Although these services are not all revenue generating the budget expenditure is in terms of the City’s socio-economic development mandate. They are also crucial in unlocking the economic growth of the City. There is however a drive to channel more funding towards economic infrastructure in order to stimulate economic growth in the Metro.
Page | 30 1.3.6 Summary of Rates and Service Charge Tariff implications to the 2017/18
MTREF Budget
Table 3: Average Tariff increases for 2016/17 to 2019/20
Description 2016/2017 2017/2018 2018/2019 2019/2020
Rates 7.60% 9.60% 8.50% 8,00%
Refuse 7.80% 9.80% 8.70% 8,60%
Sewerage 7.80% 9.80% 8.70% 8,60%
Electricity 7.64% 1.88% 1.88% 1.88%
Water 8.00% 9,50% 8,10% 8,00%
Fire Levy 7.60% 9.20% 8.00% 7,90%
Sundry Income 7.60% 9.20% 8.00% 7,90%
1.3.6.1 Overall Summary of Year-on-Year Increases
On average, tariff associated revenue is expected to increase year on year in 2017/18 by approximately 9%. The City strives to project increases that are not above the CPI, the proposed increases are however slightly above CPI due to a combination of increases in input costs associated with providing the service as well as an ongoing attempt to ensure each service produces revenue sufficient to cover the costs of providing the service.
There is an ongoing focus area in the MTREF budget to ensure that work-in-progress which is detailed in the Annual Financial Statements reaches completion stage and is implemented in various areas to improve the perception of service delivery. The impact of this which needs to be considered is that once implemented these projects will require additional operating budget through maintenance budget as well as depreciation funding to allow for the estimated useful life to be achieved and to allow for the replacement of the infrastructure assets in the future.
The ongoing expansion of the City through budget infrastructure spending without the corresponding economic growth is placing additional pressure on the BCMM local