isprsarchives XL 7 W3 837 2015
Teks penuh
Gambar

Garis besar
Dokumen terkait
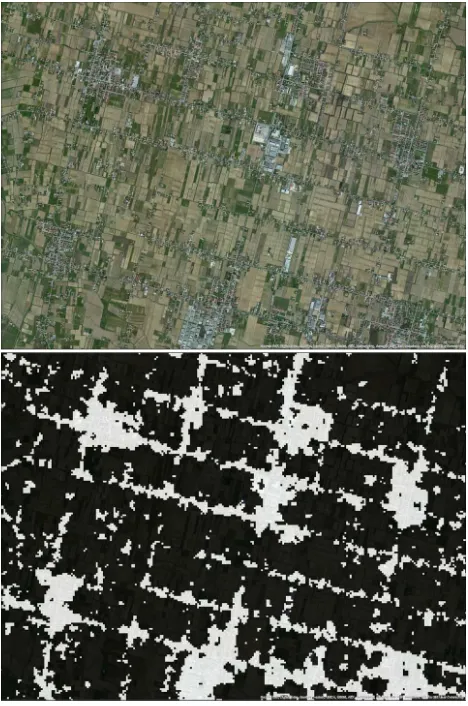
In order to assess the potential of using surface water irrigation in the delta area of Bangladesh, we used a series of Landsat images to analyze current cropping
GROUND SPECTRORADIOMETERS AND ARCHAEOLOGICAL RESEARCH 2.1 Atmospheric correction of archive satellite data Although satellite imagery and vegetation indices (e.g., NDVI)
Comparison between the research result of mathematical morphology method applied to satellite SAR data and the other reported results for the detection of the 2011 off the
Landsat images from 1977 to 2014 and water discharge data were analysed to find out a relationship between dynamics of erosion and accretion for different time intervals with
KEY WORDS: Image processing, Atmospheric correction, ATCOR, validation, aerosol retrieval, RapidEye,
The comparison of Landsat change maps of accumulative annual changes and direct changes between 2005 and 2010 (Table 6) shows the expected pattern: a high error for direct changes
The results determine the change of land use/cover and land surface temperature in Danang city by using multi-temporal Landsat and ASTER data for the period of
Vegetation index NDVI, as well as different biophysical parameters (LAI and fAPAR) derived from satellite data and WOFOST crop growth model are considered as predictors of winter
