isprs archives XLI B8 1327 2016
Teks penuh
Gambar


Garis besar
Dokumen terkait
A value of 65 was used as a maximum threshold for the assign class algorithm using mean DSM values to define the said unclassified segments as Vegetation..
This methodology allows us to compare European FUAs in terms of the spatial distribution of the land use classes, their complexity, and their structural changes, as well as to preview
According to the comparison results, the increasing extent of S-G with sliding window size of 5 (S-G 5) is most significant. The reason can be explained by the
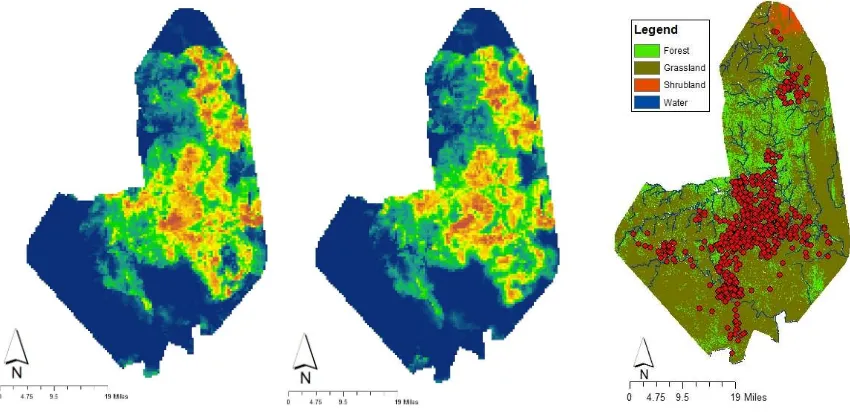
The current map (Figure 4a) shows the distribution of current values across the whole landscape. The distribution of current values show a pattern, which represents linear
This work provided an assessment of tornado- related damage and vegetation recovery in the GRSM and included the spatial distribution of damage, a disturbance
If, as one of the basic assumptions, the existence of connection between dry intrusions, dry bands, tropopause height and warm dark areas distribution on water vapor images (WV
In the present study, we used mono-window algorithm for to determine land surface temperature from 21.10.2014 Landsat 8 TIRS band 10 data.. We chosed only TIRS band 10 data
We used geospatial techniques and geographical information system (GIS) to analysing spatial relationship between the distribution of leptospirosis cases and