DEVELOPMENT OF TIME-SERIES HUMAN SETTLEMENT MAPPING SYSTEM
USING HISTORICAL LANDSAT ARCHIVE
H. Miyazaki a, *, M. Nagai b, R. Shibasaki a
a The University of Tokyo, 4-6-1 Komaba Meguro Tokyo 153-8505, Japan - (heromiya, shiba)@csis.u-tokyo.ac.jp b Asian Institute of Technology, P.O. Box 4, Klong Luang, Pathumthani 12120, Thailand - [email protected]
SpS 17 - GEO: Earth Observation from Global Land to Urban Systems
KEY WORDS: Landsat, human settlement mapping, Learning with Local and Global Consistency
ABSTRACT:
Methodology of automated human settlement mapping is highly needed for utilization of historical satellite data archives for urgent issues of urban growth in global scale, such as disaster risk management, public health, food security, and urban management. As development of global data with spatial resolution of 10-100 m was achieved by some initiatives using ASTER, Landsat, and TerraSAR-X, next goal has targeted to development of time-series data which can contribute to studies urban development with background context of socioeconomy, disaster risk management, public health, transport and other development issues. We developed an automated algorithm to detect human settlement by classification of built-up and non-built-up in time-series Landsat images. A machine learning algorithm, Local and Global Consistency (LLGC), was applied with improvements for remote sensing data. The algorithm enables to use MCD12Q1, a MODIS-based global land cover map with 500-m resolution, as training data so that any manual process is not required for preparation of training data. In addition, we designed the method to composite multiple results of LLGC into a single output to reduce uncertainty. The LLGC results has a confidence value ranging 0.0 to 1.0 representing probability of built-up and non-built-built-up. The median value of the confidence for a certain period around a target time was expected to be a robust output of confidence to identify built-up or non-built-up areas against uncertainties in satellite data quality, such as cloud and haze contamination. Four scenes of Landsat data for each target years, 1990, 2000, 2005, and 2010, were chosen among the Landsat archive data with cloud contamination less than 20%. We developed a system with the algorithms on the Data Integration and Analysis System (DIAS) in the University of Tokyo and processed 5200 scenes of Landsat data for cities with more than one million people worldwide.
INTRODUCTION
Urban expansion is one of the most important issues in development problems (Angel et al., 2005; Foley et al., 2005). Monitoring urban formation is needed for urban management which is connected to other issues, such as disaster risk management (Doocy et al., 2007; Dasgupta et al., 2009), public health (Brooker et al., 2006; Omumbo et al., 2005), transportation networks (Schneider et al., 2003), and food security (Balk et al., 2005). Because geographic data of urban development is rarely affordable to less and least income countries, innovative methods to develop such data are urgently needed.
Satellite-based human settlement mapping has contributed to better urban monitoring and planning (Schneider et al., 2003; Schneider and Woodcock, 2008). Automation of the mapping is important to achieve finer human settlement maps, which are especially needed in developing countries. As development of global data with spatial resolution of 10-100 m was achieved by some initiatives using ASTER (Miyazaki et al., 2014), Landsat (European Commision Joint Research Centre, 2014), and TerraSAR-X (Esch et al., 2013), development of time-series data would be suggested to be the next goal because such data can contribute to studies on urban growth processes (Taubenböck et al., 2014) which could be closely connected with socioeconomy, disaster risk management, public health, transport and other development issues. In this paper, we present development of a system for human settlement mapping using Landsat archive with
* Corresponding author
an automated algorithm. The preliminary results on the developed system is also presented.
METHODOLOGY
Development of human settlement maps was initiated by use of coarse-resolution satellite data, such as DMSP-OLS and MODIS (Center for International Earth Science Information Network et al., 2004; Schneider et al., 2010). The developed map data contributed to socio-economic analysis of urban development with the consistency of the data worldwide (Montgomery, 2008). In addition, needs for more spatially detail data were emerged for applying the data to analysis on urban forming, such as sprawl and compactness of cities (Angel et al., 2005; Schneider and Woodcock, 2008). For such analysis, Landsat and ASTER are good data resources to represent forms and networks of human settlement including buildings, paved areas, and other man-made structures (Small, 2005; Esch et al., 2014). To use such higher-resolution satellite data for human settlement mapping in traditional methods, development of training data, the most labour-intensive process in remote sensing projects, is required for accurate classification; however, such process is not feasible to extend the data development in global scale. Some research initiatives developed automated algorithms using machine learning algorithm to use existing coarse-resolution human settlement maps as training data (Miyazaki et al., 2014; Duan et al., 2015; European Commision Joint Research Centre, 2014).
The International Archives of the Photogrammetry, Remote Sensing and Spatial Information Sciences, Volume XLI-B8, 2016 XXIII ISPRS Congress, 12–19 July 2016, Prague, Czech Republic
This contribution has been peer-reviewed.
We applied this approach which enabled image classifications of large amount of satellite data without any human labour resource.
While classification algorithms were successfully automated, there have been still problems in accuracy caused by uncertainties of satellite data quality, such as cloud contaminations, which are considerable constraints for global applications of Landsat data (Ju and Roy, 2008). For development of time-series dataset, requirements of observation date are additional constraints in availability of good quality data. To reduce impact of the uncertainties in data quality, we proposed to combine datasets of multiple dates into a single target date. For example, to develop a data for 2005, supplement data for August 2004 and September 2006 were used in addition to the data for 2005.
In the following, we describe details of the method using coarse-resolution land cover maps as training dataset and combining supplement data into a single data.
2.1 Learning with Local and Global Consistency
For the classification of built-up and non-built-up area pixels, we applied a machine learning algorithm known as Learning with Local and Global Consistency (Zhou et al., 2003), which demonstrated an application to human settlement mapping using ASTER satellite data with 15-m resolution (Miyazaki et al., 2013). The LLGC enabled to use existing coarse-resolution human settlement maps as training data for classification of pixels in ASTER data to built-up or non-built-up areas through iterative graph-based clustering.
Another advantage of the LLGC is notable computation efficiency. Although the algorithm is iterative in concept, its calculation is solved by a few matrix operations (Zhou et al., 2003). This advantage is important to develop global human settlement maps using large amount of satellite data. It should be noted that LLGC yields not only classifications results (built-up
or non-built-up), also confidence of the classifications ranging 0.0 to 1.0, which can be interpreted as probability of existence of built-up area in the pixel.
Because the confidence values were likely to depend on proportions of initial classifications (built-up and non-built-up for this case), we masked extent of data processing by buffer areas of initial extents so that equal number of pixels within built-up and non-built-built-up areas were processed for LLGC.
2.2 Composition of the LLGC results
To reduce impact of the uncertainty, the confidence values were composed by taking median values by pixel among several LLGC results of Landsat data for a certain range of observation dates into a single output. For example, the results for August 2004, July 2005, October 2005, and September 2006 were used for the human settlement mapping for 2005.
The Landsat scenes were automatically assigned by a score that calculated from percent of cloud cover (less cloud cover is preferable) and the length of dates between the target date and observation date (observation date closer to the target is preferable).
IMPLEMENTATION OF THE SYSTEM
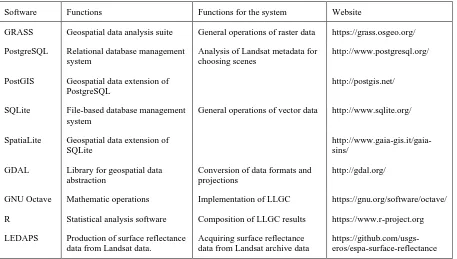
We implemented the algorithms on a high-performance computing system in the University of Tokyo, called Data Integration and Analysis System (DIAS). The DIAS provided parallel computing with a few tens of processors. For better flexibility and configurability, we implemented the algorithms and constructed the programs using open-source software only. As the DIAS was Linux-based system, which is originated by source development, construction of the system was open-source-friendly so that the system could be portable to other Linux-based computing systems. Table 1 lists the open-source software used for the system.
Software Functions Functions for the system Website
GRASS Geospatial data analysis suite General operations of raster data https://grass.osgeo.org/
PostgreSQL Relational database management system
Analysis of Landsat metadata for choosing scenes
http://www.postgresql.org/
PostGIS Geospatial data extension of PostgreSQL
http://postgis.net/
SQLite File-based database management system
General operations of vector data http://www.sqlite.org/
SpatiaLite Geospatial data extension of SQLite
http://www.gaia-gis.it/gaia-sins/
GDAL Library for geospatial data abstraction
Conversion of data formats and projections
http://gdal.org/
GNU Octave Mathematic operations Implementation of LLGC https://gnu.org/software/octave/
R Statistical analysis software Composition of LLGC results https://www.r-project.org
LEDAPS Production of surface reflectance data from Landsat data.
Acquiring surface reflectance data from Landsat archive data
https://github.com/usgs-eros/espa-surface-reflectance
Table 1. List of software used for the human settlement mapping system
The International Archives of the Photogrammetry, Remote Sensing and Spatial Information Sciences, Volume XLI-B8, 2016 XXIII ISPRS Congress, 12–19 July 2016, Prague, Czech Republic
This contribution has been peer-reviewed.
EXPERIMENT RESULTS AND DISCUSSIONS
We conducted an experiment of the proposed method to Landsat scenes covering cities with population more than one million for 1990, 2000, 2005, and 2010. The Landsat data were retrieved from the Landsat data archive of the US Geological Survey (U.S. Geological Survey, 2015). We used the built-up layer extracted from MCD12Q1 (Land Processes Distributed Active Archive Center, 2014), a MODIS-based global land cover map, for training data of built-up areas. The algorithm was applied to 5200 scenes of Landsat data for 1990, 2000, 2005, and 2010. Some examples of the results are presented in Figure 2. The results well represented urban expansion of the cities in the last decades.
However, some results for 1990 looked occupying major areas of human settlement extent although the urban development in the cities rapidly progressed later than 2000. It might be due to overestimation of built-up areas for 1990 where the results for
2000, 2005, and 2010 classified as non-built-up. This sort of inconsistency could be corrected by comparison of the results among the target years, such as majority decision or Bayesian inference. For example, if a pixel classified as a built-up area for 1990 and as a non-built-up area for 2000, 2005, and 2010, the pixel shall be classified as a non-built-up area also for 1990.
While such overestimations were observed for some cities, results for some other cities had much underestimations. This was due to underestimations of built-up areas in MCD12Q1 for such cities because the algorithm depended on the initial extent of human settlement (the built-up areas in MCD12Q1 for this case) by masking the data to adjust pixels for built-up and non-built-up areas in equal numbers.
We added supplemental data of initial built-up areas, which were prepared by visual interpretation of Landsat false colour composite for respective target years (Figure 1). The result was improved by addition of the supplemental data regardless that the visual interpretation was conducted very roughly in a coarse scale for Landsat’s spatial resolution. The results indicated the system should have a function of collecting visually interpreted data which supplements omitted built-up areas in the MCD12Q1.
For further improvements of the method, we will conduct accuracy assessment in statistical manners, such as use of error matrix (Foody, 2002). Also, we will publish the result data for end user’s applications once the accuracy reaches a product quality.
ACKNOWLEDGEMENT
This work is supported by the Green Network of Excellence Environmental Information project (GRENE-ei, 2011–2016) of Japan’s Ministry of Education, Culture, Sports, Science, and Technology.
REFERENCES
Angel, S., Sheppard, S. C. & Civco, D. L. 2005. The Dynamics of Global Urban Expansion, Washington D.C. Figure 2. Examples of the results. (a) Maputo, Mozambique;
(b) Antananarivo, Madagascar.
Figure 1. Improved result for Maputo with supplemental data of initial built-up areas.
The International Archives of the Photogrammetry, Remote Sensing and Spatial Information Sciences, Volume XLI-B8, 2016 XXIII ISPRS Congress, 12–19 July 2016, Prague, Czech Republic
This contribution has been peer-reviewed.
Balk, D., Storeygard, A., Levy, M., Gaskell, J., Sharma, M. & Flor, R. 2005. Child hunger in the developing world: An analysis of environmental and social correlates. Food Policy, 30(5), pp 584-611.
Brooker, S., Clements, A. C. A., Hotez, P. J., Hay, S. I., Tatem, A. J., Bundy, D. A. P. & Snow, R. W. 2006. The co-distribution of Plasmodium falciparum and hookworm among African schoolchildren. Malaria Journal, 5(1), pp 99-99.
Center for International Earth Science Information Network, Columbia, U., International Food Policy Research Institute, The World Bank & Centro Internacional de Agricultura Tropical. 2004. Global Rural-Urban Mapping Project (GRUMP), Alpha Version: Urban Extents. Socioeconomic Data and Applications Center (SEDAC), Columbia University.
Dasgupta, S., Laplante, B., Meisner, C., Wheeler, D. & Yan, J. 2009. The impact of sea level rise on developing countries: a comparative analysis. Climatic Change, 93(3), pp 379-388.
Doocy, S., Gorokhovich, Y., Burnham, G. M. D., Balk, D. & Robinson, C. 2007. Tsunami Mortality Estimates and Vulnerability Mapping in Aceh, Indonesia. American Journal of Public Health, 97(S1), pp S146-S146.
Duan, Y., Shao, X., Shi, Y., Miyazaki, H., Iwao, K. & Shibasaki, R. 2015. Unsupervised Global Urban Area Mapping via Automatic Labeling from ASTER and PALSAR Satellite Images. Remote Sensing, 7(2), pp 2171-2192.
Esch, T., Marconcini, M., Felbier, A., Roth, A., Heldens, W., Huber, M., Schwinger, M., Taubenbock, H., Muller, A. & Dech, S. 2013. Urban Footprint Processor - Fully Automated Processing Chain Generating Settlement Masks From Global Data of the TanDEM-X Mission. Geoscience and Remote Sensing Letters, IEEE, 10(6), pp 1617-1621.
Esch, T., Marconcini, M., Marmanis, D., Zeidler, J., Elsayed, S., Metz, A., Müller, A. & Dech, S. 2014. Dimensioning urbanization – An advanced procedure for characterizing human settlement properties and patterns using spatial network analysis. Applied Geography, 55(212-228.
European Commision Joint Research Centre. 2014. Global Human Settlement Layer [Online]. Available: http://ghslsys.jrc.ec.europa.eu/ [Accessed October 29 2014].
Foody, G. M. 2002. Status of land cover classification accuracy assessment. Remote Sensing of Environment, 80(1), pp 185-201.
Ju, J. & Roy, D. P. 2008. The availability of cloud-free Landsat ETM+ data over the conterminous United States and
globally. Remote Sensing of Environment, 112(3), pp 1196-1211.
Land Processes Distributed Active Archive Center. 2014. Land Cover Type Yearly L3 Global 500 m SIN Grid
[Online]. Available:
https://lpdaac.usgs.gov/dataset_discovery/modis/modi s_products_table/mcd12q1 [Accessed September 10 2015].
Miyazaki, H., Shao, X., Iwao, K. & Shibasaki, R. 2013. An automated method for global urban area mapping by integrating ASTER satellite images and GIS data. IEEE Journal of Selected Topics in Applied Earth Observations and Remote Sensing, 6(2), pp 1-27.
Miyazaki, H., Shao, X., Iwao, K. & Shibasaki, R. 2014. Development of a Global Built-Up Area Map Using ASTER Satellite Images and Existing GIS Data. Global Urban Monitoring and Assessment through Earth Observation. CRC Press.
Montgomery, M. R. 2008. The Urban Transformation of the Developing World. Science, 319(5864), pp 761-764.
Omumbo, J. A., Guerra, C. A., Hay, S. I. & Snow, R. W. 2005. The influence of urbanisation on measures of Plasmodium falciparum infection prevalence in East Africa. Acta Trop., 93(1), pp 11-21.
Schneider, A., Friedl, M. A. & Potere, D. 2010. Mapping global urban areas using MODIS 500-m data: New methods and datasets based on 'urban ecoregions'. Remote Sensing of Environment, 114(8), pp 1733-1746.
Schneider, A., Seto, K. C., Webster, D. R., Cai, J., Luo, B. & Publication, A. P. R. C. 2003. Spatial and temporal patterns of urban dynamics in Chengdu, 1975-2002. Stanford, California: Asia Pacific Research Center, Stanford University.
Schneider, A. & Woodcock, C. E. 2008. Compact, Dispersed, Fragmented, Extensive? A Comparison of Urban Growth in Twenty-five Global Cities using Remotely Sensed Data, Pattern Metrics and Census Information. Urban Studies, 659-692.
Small, C. 2005. A global analysis of urban reflectance. International Journal of Remote Sensing, 26(4), pp 661-681.
Taubenböck, H., Wiesner, M., Felbier, A., Marconcini, M., Esch, T. & Dech, S. 2014. New dimensions of urban landscapes: The spatio-temporal evolution from a polynuclei area to a mega-region based on remote sensing data. Applied Geography, 47(0), pp 137-153.
U.S. Geological Survey. 2015. Landsat Data Access [Online]. Available:
http://landsat.usgs.gov/Landsat_Search_and_Downloa d.php [Accessed September 10 2015].
Zhou, D., Bousquet, O., Lal, T. N., Weston, J. & Sch¨olkopf, B. 2003. Learning with Local and Global Consistency. Advances in Neural Information Processing Systems, 16(321-328.
The International Archives of the Photogrammetry, Remote Sensing and Spatial Information Sciences, Volume XLI-B8, 2016 XXIII ISPRS Congress, 12–19 July 2016, Prague, Czech Republic
This contribution has been peer-reviewed.