Modeling the Distribution of African Savanna Elephants in Kruger National Park: An
Application of Multi-Scale Globeland30 Data
W. Xua, B. Haysb, R. Fayrer-Hoskenc, A. Presottoa
a
Center for Geospatial Research, University of Georgia, Athens, GA 30602, USA - (wenjing.xu, presotto)@uga.edu b
University of North Carolina at Chapel Hill, Chapel Hill, NC, 27514, USA - [email protected] c
Sand Diego Zoo, San Diego, CA 92101, USA - [email protected]
KEY WORDS: Globeland30, Globcover, Species Distribution Model, MaxEnt, Elephants, Classification
ABSTRACT:
The ability of remote sensing to represent ecologically relevant features at multiple spatial scales makes it a powerful tool for studying wildlife distributions. Species of varying sizes perceive and interact with their environment at differing scales; therefore, it is important to consider the role of spatial resolution of remotely sensed data in the creation of distribution models. The release of the Globeland30 land cover classification in 2014, with its 30 m resolution, presents the opportunity to do precisely that. We created a series of Maximum Entropy distribution models for African savanna elephants (Loxodonta africana) using Globeland30 data analyzed at varying resolutions. We compared these with similarly re-sampled models created from the European Space Agency’s Global Land Cover Map (Globcover). These data, in combination with GIS layers of topography and distance to roads, human activity, and water, as well as elephant GPS collar data, were used with MaxEnt software to produce the final distribution models. The AUC (Area Under the Curve) scores indicated that the models created from 600 m data performed better than other spatial resolutions and that the Globeland30 models generally performed better than the Globcover models. Additionally, elevation and distance to rivers seemed to be the most important variables in our models. Our results demonstrate that Globeland30 is a valid alternative to the well-established Globcover for creating wildlife distribution models. It may even be superior for applications which require higher spatial resolution and less nuanced classifications.
This contribution has been peer-reviewed.
1. Introduction
There is a pronounced need for accurate modeling of species distributions at the landscape level, particularly within protected areas that are actively working to manage and conserve species of concern (Guisan et al., 2006). This is the case for African elephants (Loxodonta africana) within Kruger National Park (KNP), South Africa (DeKnegt et al., 2011). It is difficult to collect comprehensive presence and absence data for the estimated 12,000 elephants across the entire park (Smit et al., 2007a). Furthermore, elephants have a home range of up to 1,800 km2 in KNP, making it especially difficult to accurately track them within a park of 19, 485 km2 (Whyte, 2001; Grainger et al., 2005).
For this reason, tools which incorporate remotely sensed data to produce accurate models of species distribution are highly useful for ecological research and conservation. These species distribution models (SDM) combine species occurrence data with geographically referenced environmental data as inputs into a statistical algorithm to infer the environmental restraints of the study species and predict areas with ecologically suitable habitat (Hernandez et al., 2006; Guisan et al., 2007).
Many SDM’s require information on where the species presence and where it is absent, necessitating higher sampling effort (Guisan & Zimmerman, 2000). However, absence data is often unavailable for many species or less than reliable, since a lack of observation does not always equal a lack of presence (Philips et al., 2006). Therefore models which can produce accurate distributions with only presence data are desirable. One such SDM is Maximum Entropy, or MaxEnt, which ranks highly in model performance when compared with other SDM’s (Elith et al., 2006,; Hernandez et al., 2006). MaxEnt is a machine-learning algorithm which estimates the target probability distribution by finding the probability distribution that is most spread out, or closest to uniform (Phillips et al., 2006). The inputs are presence observations for the species of concern as well as data for any environmental variables that constrain the species’ geographic distribution, such as available water, temperature, or disturbance. Many of these variables can be accounted for in land cover classifications, which incorporate the presence of landscape features.
Recent improvements in satellite platforms and remote sensing image classification techniques have facilitated the creation of fine scale land cover data. One of the most prominent of these newly developed land cover data sets is the Globeland30 set produced by the National Geomatics Center of China. This is the first global land cover product with a resolution of 30 m and it opens new possibilities for global land cover studies since most human activities and changes in land cover can be detected at this scale (Chen et al., 2015; Han et al., 2015).
Scale is an important consideration when collecting and analyzing ecological data. If a system is studied at an inappropriate scale, the target dynamics may not be captured; rather, any patterns described may instead be artifacts of scale (Wheatley & Johnson, 20090; Renner & Warton, 2013). In the case of habitat selection, the spatial resolution of landscape
the effects of scale to create accurate species distribution models.
The objectives of this study were twofold: 1) to test the utility of GlobeLand30 for creating species distribution models, and 2) to examine the effects of scale on analysis by modifying grain size, or the finest level of spatial resolution of the available data. Although Globeland30 has been used in multiple studies on subjects such as soil mapping (Hengl et al., 2015), cropland mapping (Lambert et al., 2016), and land cover change (Yushuo et al., 2015), we are unaware of any other studies using this data set for wildlife ecology applications. As such, this study represents the first application of Globeland30 data for wildlife ecology. We used MaxEnt software to compare Globeland30 with an older and more widely used data set, Globcover, produced by the European Space Agency, which has a lower spatial resolution but a finer classification scheme.
2. Methodology 2.1 Study Site
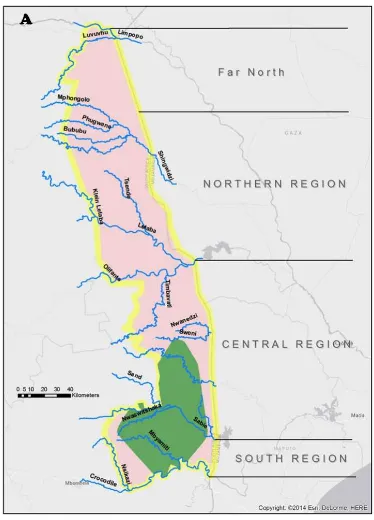
Kruger National Park is located in the northeast portion of South Africa with a total area of 19,485 km2. It was proclaimed as a national park in 1926 and has become one of the largest wildlife sanctuaries in the world. KNP is a part of the “lowveld” savanna with altitude varying from 200 m to 840 m (Codron et al., 2006). The differences in climate and geology across the park produce a variety of landscapes (Gertenbach, 1983) leading to a patchy distribution of resources for different species (Crooks & Sanjayan, 2006). The park is divided into 16 ecozones classified by dominant vegetation types. The climate of KNP is classified as tropical to subtropical and the average annual precipitation varies from 401 mm to 600 mm. Drought is endemic in this region, occurring typically from March to middle October, followed by the wet season from October to February (Tyson, 1986).
2.2 Data Description
Figure 1. KNP and location of the study area (green polygon)
We used two different landscape classification schemes in our models. The first, Globeland30, was produced by the National Geomatics Center of China and uses a combination of 30 m multispectral imagery from the TM5 and ETM+ sensors of the American Land Resources Satellite (Landsat) and the Chinese Environmental Disaster Alleviation Satellite (HJ-1) from the year 2010. The end product is a global land classification set with ten categories and a 30 m spatial resolution (Chen et al., 2015). The second scheme, Globcover, produced by the European Space Agency, consists of imagery from the Medium Resolution Imaging Spectrometer (MERIS) on board the ESA’s ENVISAT satellite from the year 2009. The final product is a 22 category classification with 300 m spatial resolution (Bontemps et al., 2011).
2.3 Model Construction
We followed the Maximum Entropy method described by Phillips et al. (2006) using the freely available MaxEnt software, version 3.3.3k (Schapire, 2012) to build multiple models of elephant distribution at varying spatial resolutions within Kruger National Park (Phillips & Dudík, 2008). We created two models at each spatial scale, one using the Globeland30 land classification scheme and the other using the Globcover scheme. Both classifications were re-sampled to isolate forests to make
them comparable; all forest classes were assigned a value of 1, while all other classes were assigned a value of 0. By applying an 8-neighbor focal statistics function to calculate the mean value of the central cell within a 3x3 matrix, we generated continuous raster layers to serve as a proxy for forest cover. This transformation was tested against a model run with the unaltered classification schemes and was found to consistently produce a higher AUC score. In addition to forest cover, we generated 7 other raster layers of environment variables (Table 2). We created a total of seven models, each with one of the two landscape classification schemes at varying spatial resolutions. The first 4 models were created using GlobeLand 30, with spatial resolutions of 30 m, 300 m, 600 m, and 900 m. Since the original resolution of Globcover is 300 m it could not be used to create a model at 30 m scale. Thus, the remaining three models used Globcover at 300 m, 600 m, and 900 m resolutions. The other 7 environmental variables were also re-sampled to match the spatial resolution of each model.
Ten thousand randomized background points were selected from the area encompassed by the minimum convex hull polygon to create pseudo-absences. One elephant’s full movement pattern, consisting of GPS points taken every hour from September 1995-February1996, was used as presence data. The results of 15 iterations were averaged to create the final models. Subsequently model performance was evaluated using a sub-sample of all of the elephant GPS-collar points. This sub-sample consisted of every 12th point in the data set, approximating 2 points per day per elephant over the length of time each elephant’s collar was active.
2.4 Evaluation
We evaluated the models using a Receiver Operating Curve (ROC) analysis, using the Area Under the Curve (AUC) as a measure of model fitness, where values higher than 0.5 indicate that the model predictions are better than random. The AUC method has been popularized as an omnipotent statistic in assessing the predictive accuracy of species distribution models
and is directly offered by the MaxEnt package
(Jiménez-Valverde, 2012; Phillips & Dudík, 2008).
3. RESULTS
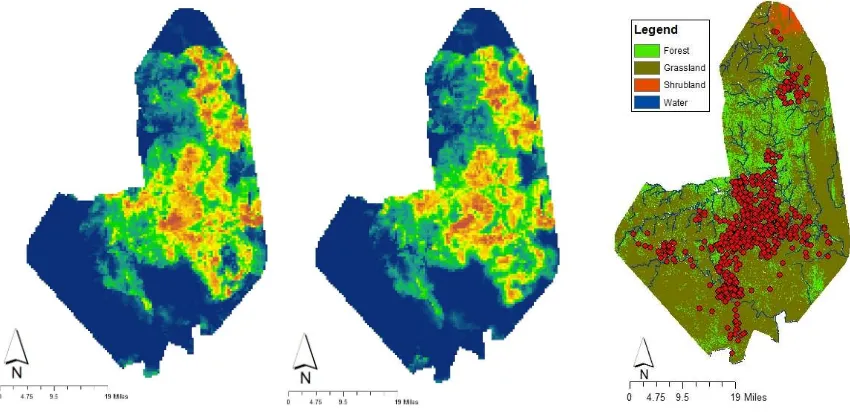
The prediction maps in Figure 2 show the probability of elephant occurrence within the study area for two models: Globeland30 and Globcover, both at 600 m spatial resolutions. The highest probability of elephant occurrence is scattered around the center of the study area, with another area of high probability to the north. These predictions generally match the GPS collar data of elephant presence.
This contribution has been peer-reviewed.
Figure 2. Prediction maps from MaxEnt showing probability of elephant occurrence within the study area based on the Globeland30 (left) and Globcover (center) based on GPS collar training data, a subset of which is shown over Globeland30 classification scheme
(right).
For each model, the area under the Receiver Operating Curve was calculated, also known as an Area Under the Curve (AUC) score. AUC scores represent the slope of a line x
y
in which y
is the rate of commission error and x is the rate of omission error, with all of the observation data placed along this line. Thus, the AUC score is an indication of how well each model classifies a presence observation as a presence and a pseudo-absence as an absence and serves as a good metric of model performance (Phillips et al., 2006).
Of the models developed, those based on Globeland30 outperformed the Globcover models at 3 out of the 4 spatial resolutions we tested according to AUC scores (Figure 3).
Figure 3. Comparison of AUC scores of MaxEnt models created with Globeland30 and Globcover.
The models in which all variables were re-sampled to 600 m performed best. Analysis at the coarsest resolution, 900 m, had the worst scores; however the AUC of the finest resolution, 30 m, was a close second. The highest AUC score was the Globeland model at 600 m (0.825) while the lowest score was the 900 m Globeland model (0.8) (Table 1).
Globeland30 Globcover
30 m 0.801 N/A
300 m 0.817 0.811
600 m 0.825 0.821
900 m 0.800 0.804
Table 1. AUC scores for all of the models developed.
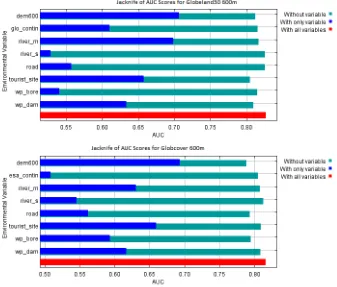
Figure 4. Jackknife tests of variable importance for Globeland30 (top, glo_contin) and Globcover (bottom, esa_contin) models at 600 m. The explanatory power of each individual parameter relative to the total AUC score is represented by the blue bar.
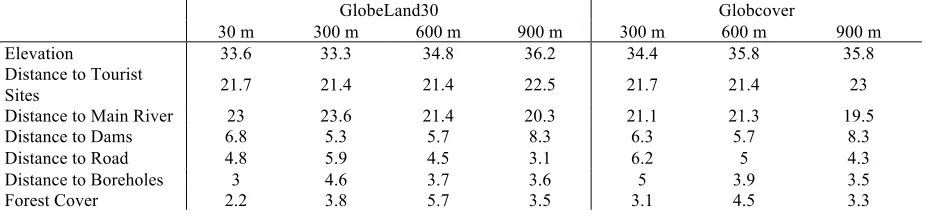
The percent contribution of each variable to the overall model performance remained fairly consistent across all models (Figure 5), however there was some variation in the ranked importance of variables. These changes in variable importance did not follow a trend according to spatial scale of analysis (Table 2), thus we attribute them to stochasticity within the models.
Finally, of all of the environmental variables included in the model, elevation was consistently the most important, followed by distance to tourist sites, and then distance to rivers. Distances to dams, roads, boreholes, and forest cover as calculated from the classification schemes were of interchangeable importance, varying by spatial resolution.
Figure 5. Graph showing the percent contribution of each parameter within all of the models created.
This contribution has been peer-reviewed.
GlobeLand30 Globcover
Table 2. Percent contribution of each parameter for each model, categorized by spatial resolution and land cover classification used.
4. DISCUSSION
This study presents a broad comparison between two land cover data sets in terms of their different classification schemes and spatial resolutions using movement data from a small number of elephants. We employed the AUC method included in the MaxEnt package to compare model performances (Guisan et al., 2007; Hernandez et al., 2006; Matawa et al., 2012). Although AUC scores can only be used to compare the models, there remain informative conclusions to be drawn from the general trends.
Of the environmental variables analyzed, forest cover generally had the lowest relative contribution to model performance. This could be due to the high portion of grasses in the diet of elephants within Kruger National Park, who consume approximately 50% grasses in the wet season (Codron, 2006). Additionally, this could be attributable to the uncertainty that was introduced by the reclassification process. In the original Globcover product, pixels were classified by percent composition of forest, grass, agriculture, etc. Our reclassification, which assigned pixels containing more than 50% forest as forest cover, was necessary to make the two classification schemes directly comparable. Ultimately, our reclassified landcover had a higher relative importance and higher model AUC compared with models built with the original Globcover and Globeland30 products. Additionally, Globeland30 models still performed better in the majority of spatial scales tested. Finally, it may be an artifact of the classifications themselves being created partially from supplementary data sets including water and elevation (Chen et al., 2015; Bontemps et al., 2011).
The low relative importance of artificial water points, the boreholes and dams, is likely due to the GPS data being recorded primarily during the rainy season, when natural water supplies are more abundant (Van Wyk, 2010). Moreover, KNP is not a highly water limited system for elephants, with few areas being more than 10 km away from natural water sources (Smit et al., 2007b). Due to their high rates of evaporative and respiratory water loss, distance to water is an important determinant of elephant movement and distribution, (Stokke & Du Toite, 2002; Smit et al., 2007a). As such, the high contribution of the distance to main rivers variable is expected. Distance to tourist sites also had a high relative contribution, though this is likely an artifact of correlation, as these sites are purposely located at locations where elephants tend to congregate and visit repeatedly (Van Wyk, 2010).
frequently tourist site locations. Additionally, elephants tend to eschew steeper areas in favor of easier to traverse level plains, avoiding energetically costly ascents (Wall & Vollrather, 2006).
Although the AUC scores were generally quite close, the models built with Globeland30 outperformed those with Globcover in 3 out of 4 resolutions tested. The lack of greater discrepancy in scores between scales of analysis may be attributable to the relative simplicity of the models themselves, as models with insufficient predictive power may fail to show large scaling effects (Guisan et al., 2007). Still, the overall disparity in scores could be due to differing amounts of ecologically relevant information being captured by the differing resolutions. The Globeland30 classification scheme has a ten times finer spatial resolution - though it can differentiate between fewer classes. However, elephants may perceive their landscape as a gradient of resources and habitat rather than a systematic division of classes and sub-classes, in which case a coarser classification scheme might be favorable.
a large home range which can be readily analyzed at different spatial resolutions. However for smaller species with smaller home ranges and restricted mobility across the landscape, a 300m classification scheme may be insufficient for accurate modeling purposes. Further tests with presence data for a species with these range restrictions might demonstrate a greater discrepancy in accuracy and utility between the two classifications and across scales.
In addition, our results demonstrate the importance of collecting data and analyzing it at an ecologically relevant spatial scale. This is a crucial consideration to be made when designing studies; the spatial needs of the species or ecological process of concern should be carefully examined to inform the design of models.
ACKNOWLEDGEMENTS
We wish to acknowledge the contribution of Dr. Douw Grobler, JJ van Altena, and Jay Kirkpatrick. Also we sincerely thank the staff of Kruger National Park and SANParks, especially Johan Malan and Marius Kruger. Data collection was funded by U.S. Fish and Wildlife, USA.
REFERENCES
Baguette, M., & Van Dyck, H. (2007). Landscape connectivity and animal behavior: functional grain as a key determinant for dispersal. Landscape ecology, 22(8), 1117-1129. resolution: A POK-based operational approach.
ISPRS Journal of Photogrammetry and Remote Sensing, 103, 7-27.
Codron, J., Lee-Thorp, J.A., Sponheimer, M., Codron, D., Grant, R.C., & de Ruiter, D.J. (2006). Elephant (Loxodonta africana) diets in Kruger National Park, South Africa: spatial and landscape differences.
Journal of Mammalogy, 87 (1), 27-34.
Crooks, K.R., & Sanjayan, M. (2006). Connectivity conservation: maintaining connections for nature.
CONSERVATION BIOLOGY SERIES-CAMBRIDGE, 14, 1.
De Knegt, H. J., Van Langevelde, F., Skidmore, A. K., Delsink, A., Slotow, R., Henley, S., Bucini, G., de Boer, W., Coughenour, M., Grant, C., Heitkönig, I., Henley, M., Knox, N, Kohi, E., Mwakiwa, E., Page, B., Peel, M.,
Guisan, A., Hijmans, R. J., Huettmann, F., Leathwick, J. R., Lehmann, A., Li, J., Lohmann, L. G., Loiselle, B. A., Manion, G., Moritz, C., Nakamura, M., Nakazawa, Y., Overton, J. McC., Peterson, A. T., Phillips, S. J., Richardson, K. S., Scachetti-Pereira, R., Schapire, R. E., Soberon, J., Williams, S., Wisz, M. S.
And Zimmermann, N. E. 2006. Novel methods improve prediction of species’ distributions from occurrence data. Ecography 29, 129-151
Fayrer-Hosken, R.A., Brooks, P., Bertschinger, H.J., Kirkpatrick, J.F., Turner, J.W., & Liu, I.K. (1997). Management of African elephant populations by immunocontraception. Wildlife Society (USA). Gertenbach, W.D. (1983). Landscapes of the Kruger National
Park. Koedoe, 26(1), 9-121.
Grainger, M., van Aarde, R., & Whyte, I. (2005). Landscape heterogeneity and the use of space by elephants in the Kruger National Park, South Africa. African Journal Of Ecology, 43(4), 369-375.
Guisan, A., Zimmermann, N.E. (2000). Predictive habitat distribution models in ecology, Ecological Modelling 135(2–3), 147-186.
Guisan, A., Lehmann, A., Ferrier, S., Austin, M., Overton, J.M.C., Aspinall, R. & Hastie, T. (2006). Making better biogeographical predictions of species’ distributions. Journal of Applied Ecology 43, 386–392.
Guisan, A., Graham, C. H., Elith, J., & Huettmann, F. (2007). Sensitivity of predictive species distribution models to change in grain size. Diversity & Distributions, 13(3), 332-340
Han, G., Chen, J., He, C., Li, S., Wu, H., Liao, A., & Peng, S. (2015). A web-based system for supporting global land cover data production. ISPRS Journal of Photogrammetry and Remote Sensing, 103, 66-80. Hengl, T., Heuvelink, G. B., Kempen, B., Leenaars, J. G.,
Walsh, M. G., Shepherd, K. D., Sila, A., MaMillan, R.A., Mendes de Jesus, J., Tamene, L., & Tondoh, J. E. (2015). Mapping soil properties of Africa at 250 m resolution: Random forests significantly improve current predictions. PloS one, 10(6), e0125814. Hernandez, P. A., Graham, C. H., Master, L. L., & Albert, D. L.
(2006). The effect of
sample size and species characteristics on performance of different species distribution modeling methods. Ecography 29, 773- 785. Jiménez-Valverde, A. (2012). Insights into the area under the
receiver operating characteristic curve (AUC) as a discrimination measure in species distribution modelling. Global Ecology and Biogeography, 21(4), 498-507.
Lobo, J. M., Jiménez-Valverde, A., & Real, R. (2008). AUC: a misleading measure of the performance of predictive distribution models. Global Ecology and Biogeography, 17(2), 145-151.
Lambert, M. J., Waldner, F., & Defourny, P. (2016). Cropland Mapping over Sahelian and Sudanian Agrosystems: A Knowledge-Based Approach Using PROBA-V Time Series at 100-m. Remote Sensing, 8(3), 232. Matawa, F., Murwira, A., & Schmidt, K. S. (2012). Explaining
elephant (Loxodonta africana) and buffalo (Syncerus caffer) spatial distribution in the Zambezi Valley using maximum entropy modelling. Ecological Modelling, 242, 189-197.
Phillips, S.J., Anderson, R.P., Schapire, R.E. (2006). Maximum entropy modelling of
species geographic distributions. Ecological Modelling,190, 231–259.
Phillips, S.J., & Dudík, M. (2008). Modeling of species distributions with Maxent: new extensions and a comprehensive evaluation. Ecography, 31(2), 161-175.
Renner, I. W., & Warton, D. I. (2013). Equivalence of This contribution has been peer-reviewed.
MAXENT and Poisson point process models for species distribution modeling in ecology. Biometrics, 69(1), 274-281.
Schapire, R., 2012. Maxent software for species modeling. https://www.cs.princeton.edu/~schapire/maxent/ (15 Oct. 2015)
Smit, I. J., Grant, C. C., & Whyte, I. J. (2007a). Landscape-scale sexual segregation in the dry season distribution and resource utilization of elephants in Kruger National Park, South Africa. Diversity & Distributions, 13(2), 225-236. doi:10.1111/j.1472-4642.2007.00318.x
Smit, I. P. J., Grant, C. C. and Whyte, I. J. (2007b), Elephants and water provision: what are the management links?.
Diversity and Distributions, 13, 666–669
Stokke, S., & Du Toit, J. T. (2002). Sexual segregation in habitat use by elephants in Chobe National Park, Botswana. African Journal of Ecology, 40(4), 360-371.
Tyson, P.D. (1986). Climatic change and variability in southern Africa. Oxford University Press, USA.
Van Wyck, L. (2010). Review of the ecological implications of artificial waterholde closures in Kruger National Park and the effect thereof on tourism. Dissertation. University of Johannesburg. Johannesburg.
Wall, J., Douglas-Hamilton, I., & Vollrath, F. (2006). Elephants avoid costly mountaineering. Current Biology, 16(14), R527-R529.
Wheatley, M., & Johnson, C. (2009). Factors limiting our understanding of ecological scale. Ecological Complexity, 6(2), 150-159.
Whyte, I.J. (2001). Conservation management of the Kruger National Park elephant population. PhD Thesis, University of Pretoria, Pretoria
Worton, B. (1987). A review of models of home range for animal movement. Ecological modelling, 38 (3), 277-298.
Yushuo, Z., Jun, C., Lijun, C., Ran, L., Weiwei, Z., Nan, L., & Jiyu, L. (2015). Characteristics of land cover change in Siberia based on GlobeLand30, 2000-2010.