i PREDICTIVE ANALYSIS FOR STUDENT'S PERFORMANCE EVALUATION
BY
SAJID ALAM CHOWDHURY ID: 201-25-870
This Report Presented in Partial Fulfillment of the Requirements for the Degree of Master of Science in Computer Science and Engineering
Supervised By Md. Zahid Hasan Assistant Professor Department of CSE
Daffodil International University
DAFFODIL INTERNATIONAL UNIVERSITY
DHAKA, BANGLADESHSEPTEMBER 2021
ii APPROVAL
This Project titled “PREDICTIVE ANALYSIS FOR STUDENT'S PERFORMANCE EVALUATION”, submitted by Sajid Alam Chowdhury, ID No: 201-25-870 to the Department of Computer Science and Engineering, Daffodil International University has been accepted as satisfactory for the partial fulfillment of the requirements for the degree of M.Sc. in Computer Science and Engineering and approved as to its style and contents.
The presentation has been held on 12th September, 2021.
BOARD OF EXAMINERS
________________________
Dr. Touhid Bhuiyan Professor and Head
Department of Computer Science and Engineering Faculty of Science & Information Technology Daffodil International University
Chairman
________________________
Dr. Md. Ismail Jabiullah Professor
Internal Examiner
iii Department of Computer Science and Engineering
Faculty of Science & Information Technology Daffodil International University
________________________
Dr. Sheak Rashed Haider Noori
Associate Professor and Associate Head
Department of Computer Science and Engineering Faculty of Science & Information Technology Daffodil International University
Internal Examiner
________________________
Dr. Mohammad Shorif Uddin Professor
Department of Computer Science and Engineering Jahangirnagar University
External Examiner
iv
DECLARATION
I hereby declare that, this project has been done by me under the supervision of Md. Zahid Hasan, Assistant Professor, Department of CSE Daffodil International University. I also declare that neither this project nor any part of this project has been submitted elsewhere for award of any degree or diploma.
Supervised by:
Md. Zahid Hasan Assistant Professor Department of CSE
Daffodil International University
Submitted by:
Sajid Alam Chowdhury ID: 201-25-870
Department of CSE
Daffodil International University
v
ACKNOWLEDGEMENT
First, I express my heartiest thanks and gratefulness to almighty God for His divine blessing makes us possible to complete the final year project successfully.
I really grateful and wish our profound our indebtedness to Md. Zahid Hasan, Assistant Professor, Department of CSE Daffodil International University, Dhaka. Deep Knowledge
& keen interest of our supervisor in the field of “Machine Learning” to carry out this project. His endless patience, scholarly guidance, continual encouragement, constant and energetic supervision, constructive criticism, valuable advice, reading many inferior drafts and correcting them at all stage have made it possible to complete this project.
I would like to express my heartiest gratitude to Dr. Touhid Bhuiyan, Professor and Head, Department of CSE, for his kind help to finish my project and also to other faculty member and the staff of CSE department of Daffodil International University.
I would like to thank our entire course mate in Daffodil International University, who took part in this discuss while completing the course work.
Finally, I must acknowledge with due respect the constant support and patients of my parents.
vi
ABSTRACT
These days, the instructional learning methods are not restricted to the traditional strategies, which used to be ten years prior. The 21st-century students need to be outfitted with information and abilities to establish fruitful and long-lasting learners. Innovation made it conceivable to attempt new learning strategies. So, with the development of technology and the necessary technology being more and more affordable and accessible to the general public, learning online is gaining popularity. Our exploration objective was to examine and investigate the Online Activity information to acquire significant knowledge of educators and their educating designs and eventually devise a prediction model to anticipate the outcome dependent on their action inside the learning time frame. Subsequently, Steps like data selection, data generation, data structure, feature engineering, feature selection were applied. Then, distinctive ML algorithms like CATBOOST, XGBOOST were applied for the prediction. This paper outlines the methods used to predict student's final results by various Machine Learning algorithms.
vii
TABLE OF CONTENTS
CONTENTS PAGE
Board of examiners ii
Declaration iii
Acknowledgements iv
Abstract v
Table of Contents vi
List of Figures vi
List of Tables viii
CHAPTER
CHAPTER 1: INTRODUCTION
1-31.1 Introduction 1
1.2 Motivation 2
1.3 Objectives 2
1.4 Expected Outcome 3
1.5 Report Layout 3
CHAPTER 2: METHODOLOGY OVERVIEW
4-122.1 Methodology outline in short 4
2.2 INSTRUMENTS UTILIZED 8
2.3 DATA GENERATION PROCESS IN A NUTSHELL 9
2.4 Some challenges during data processing 12
viii
CHAPTER 3: HYPOTHESIS & DATA ANALYSIS
13-203.1 Hypothesis 1 13
3.2 Hypothesis 2 14
3.3Hypothesis 3 15
3.4Hypothesis 4 16
3.5Hypothesis 5 17
3.6Hypothesis 6 17
3.7Hypothesis 7 18
3.8Hypothesis 8 19
3.9Hypothesis 9 20
CHAPTER 4: RESULT ANALYSIS
21-254.1 Objective 21
4.2 Methodology to prepare a reasonable data set for modeling 21
4.3 Feature selection 22
4.4 Feature Engineering 22
4.5 Data Splitting 23
4.6 Hyper-parameter Tuning of each model 23
4.7 Comparative analysis of each model 24
4.8 A FEW CHALLENGES 25
CHAPTER 5: CONCLUSIONS
26-265.1 Conclusions 26
ix
REFERENCES
27PLAGIARISM REPORT
28-29x
LIST OF FIGURES
FIGURES PAGE NO
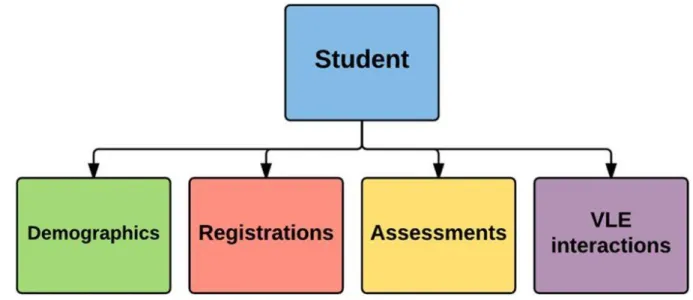
Figure 1: Shows the Data files 1
Figure 2: Shows the Data Preparation 5
Figure 3: Shows mining 9
Figure 4: Relation of tables in the database 10
Figure 5: Shows the impact gender has on students' final result 13 Figure 6: Shows the impact region has on students' final results. 14 Figure 7: Shows the final result of the student dependent on their
activities with interaction.
15 Figure 8: Shows the relationship imd band have with students withdraw
from subjects
16
Figure 9: Shows performance of disability students 17
Figure 10: Shows the impact of past endeavors on the final result 17 Figure 11: Shows students earlier education relationship with the final
result
18 Figure 12: The quantity of students in a class thought about against
student performance on the Final result
19
Figure 13: Shows Genders withdrawn rate. 20
Figure 14: Shows the Feature Selection 22
Figure 15: Feature Selection Line Chart 22
Figure 16: Performance investigation of the various models for predicting the final result
24
xi
LIST OF TABLES
TABLES PAGE NO
Table 1: Comparative analysis 24
1
CHAPTER 1 Introduction
1.1 IntroductionOur research analyzed collections of data of students' intercommunication with learning management system (LMS) [1]. This thesis aspires to interpret the data and learn how it can be used to improve students' learning experience optimize student's accomplishments.
The research centers around the assortment and examination of students' information to further develop their learning experience by giving educated direction and streamlining learning materials. The dataset we utilized in this research contains information from courses introduced at the Open University (OU). The dataset is exceptional because it incorporates demographic data and aggregated clickstream data of students' communications in the Virtual Learning Environment (VLE). This empowers the investigation of student behavior, addressed by their activities. The dataset contains data around 22 courses, 32,593 students, their assessment results, and logs of their interactions with the VLE addressed by everyday rundowns of student clicks (10,655,280 entries).
The dataset used in this thesis can be found at https://analyse.kmi.open.ac.uk/open_dataset under a CC-BY 4.0 license.
Figure 1: Shows the Data files
2 By executing data analysis techniques on the data sets of the students from Open University, we can discover valuable bits of knowledge from our data, for example, regardless of whether it is feasible to predict a student's result depends on how they interact with the LMS and so on.
The principal goals that ought to be met are and not restricted to
● A full investigation of the data set provided by the Open University.
● Use various data visualization tools to improve knowledge of the data.
● Get better insights dependent on some statistical analysis.
● Find out which are the prevailing variables contributing to the Online Learning Experience.
Finally,
● We should concoct a few suggestions and essential insights from the data that will work with us to work on such projects and be more helpful.
1.2 Motivation
During the covid-19 pandemic situation, we all were forced to stop our educational system as we were not prepared for such a situation. With the rise of online activity, it is highly needed to evaluate student's online presence. Predicting a student's condition early by using a Machine Learning model can reduce the risk of withdrawal or failure of a student by taking frequent actions.
1.3 Objective
During this exploration, our research objective was to audit and break down the Online Activity data to get significant insights in regards to students and their learning patterns and, in the long run, devise a Machine Learning model to foresee the final result dependent on their activity inside the learning time frame.
3 1.4 Expected Outcome
Through this model-based prediction framework, we can accomplish the objective of the cutting-edge world for a superior learning experience in online stages that are acquiring ubiquity step by step. Our expected result is to make a prediction model which can distinguish a student's final result dependent on their online activity.
1.5 Report Layout
Chapter 1 presents the research introduction, objectives and expected outcome.
Chapter 2 highlights methodology overview.
Chapter 3 describes data analysis trough questions and hypothesis Chapter 4 explains the machine learning models.
Chapter 5 concludes the research and discusses overall finding.
4
CHAPTER 2
METHODOLOGY OVERVIEW
2.1 Methodology outline in short
The entire methodology splits into following segments:
1. Data retrieving 2. Preparing the data [2]
Cleaning the data
Cleaning the data is a crucial move when starting the data analysis process. Due to Online universities (OU) having relatively clean data because of the database backend they have; all the data had the appropriate value and are uniform. With further exploration, it was found that specific values were null or NaN, meaning that there were no values in that given column. Since the models we have implemented can’t take null values, all null values were replaced with a 0 value.
Data wrangling
Data wrangling is when we group all the attributes from related tables to make the data easier to work with. By data wrangling, we could group and define values such as the type of assignment a student completed and the score they had received for that assignment. This makes the data readable to groups and us all the relevant information of all the tables relating to a student to allow for accurate testing with our models. The aim of data wrangling was from having multiple data files that OU provided us to having one primary dataset uniformly used for all our testing and data analysis.
5 Figure 2: Show the Data Preparation
4. Intermediate Exploration of Data for Generating insights to discover connections among the parameter
Data Visualization
Our report tested multiple minor hypotheses created to identify whether specific attributes affected the student's overall academic performance. We utilized data visualization technologies such as matplotlib library for python. Using these technologies, we were able to test and identify which attributes affected our target variable's final result. Through this method, we identified attributes and relationships between variables within our data set.
6 5. Feature Selection
After data wrangling, we got the final dataset and we can proceed to Machine Learning next. Our final dataset has 19 features, but it is not sure whether we can use them all. Some of them might not be that useful feature so we have to remove them. Therefore, feature selection is a must step to help us improve the result of prediction.
Since we didn't find suitable tools in Python to do feature selection, the sklearn package is used to do the job. Since sklearn doesn't support string type, we need to transform the categorical values into indexed values firstly.
Another thing we need to do is to slice the data set into features and target variables to run a Machine Learning model to generate a feature importance vector where each feature is ranked based on a score on how well they can explain the target variable.
6. Feature Engineering i. Feature Creation ii. Outlier Removal iii. Categorical Encoding iv. Missing Data Imputation
v. Variable Transformation Python Packages used:
1. Pandas/NumPy 2. Sklearn package 3. Matplotlib 4. XGBoost 5. CATBoost
7 The methodologies we have applied are
1. We concocted a few Hypotheses
2. We set up the data that extricate the important data to test a similar Hypothesis 3. Finally test the Hypothesis and give our decision
For the critical Hypothesis:
Hypotheses:
Would we be able to predict the final result dependent on the online activity and demographic data of the students?
Model testing:
1. Convert all string values to integer values by masking attributes (e.g. Final Result:
Withdrawn, Fail, Pass, Distinction = 0, 1, 2, 3). This is done because the models used can only use numeric values
2. Create the pandas data frame including entire features.
3. Define attributes for model testing a. Feature columns
i. The attributes being used to predict the target values b. Target value
i. The attribute we are predicting (Final Results) 4. Feature importance
a. Test the feature columns with the target value. This shows how much of an effect the attributes have on the target value.
5. Create new pandas data frame with attributes with a significant impact on the target value.
a. Create new train and test set based on feature importance 6. Run and test models with the new data frame.
8 Model Evaluation
1. Classification report
a. The classification report looks at the performance of the model by comparing the results of the test and train sets of data. The report displays:
i. The precision of the model ii. The rate of recall
iii. The f1- score
iv. The overall accuracy of the model
b. The key criteria of the classification report we focused on is the overall accuracy of the model in predicting the target attribute which is the final result of the student.
2. Confusion Matrix
a. The confusion matrix allows us to view which target attribute value (e.g.
final result) the model has troubles in identifying
2.2 INSTRUMENTS UTILIZED
We had five datasets. Among them, one of the files contains more than 1.5 million rows.
This was difficult for us to manage these vast datasets. For starting data investigation, we utilized 'weka,' 'orange' from anaconda distribution, and python's 'matplotlib' library to analyze an underlying visualization of the information and its shape and different cycles Exploratory data examination.
We have utilized 'tableau' to create some intuitive plots to get the bits of knowledge of our dataset for a superior comprehension of certain patterns and to produce and demonstrate our hypothesis.
We attempted to utilize 'weka' for machine learning algorithms. However, it showed lacking execution in managing a lot of data and its opportunity to play out any
9 investigation. Then we choose jupyter notebook for investigating, modeling, selection of feature, construction of feature, lastly applied prediction models to foresee the result given some online activity and demographic data has been taken care of to the model.
2.3 DATA GENERATION PROCESS IN A NUTSHELL OU Data
Open University (OU) published the dataset[3]; which contains information on students during 2013 and 2014. The data contains information on the student’s demographic and VLE (Virtual Learning Environment).
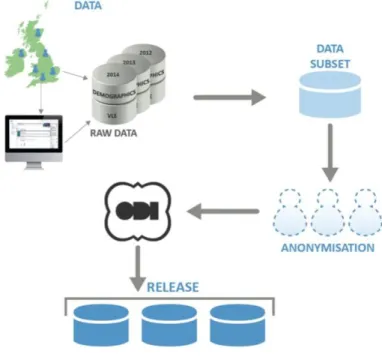
Figure 3: Shows mining
In the OU data, there are three key data types: Performance, Demographic, and Learning behavior. The data assembled from numerous frameworks are put away in OU’s Data distribution center.
The dataset given is produced by data mining the enlisted student's data.
10 Data Selection
The data had specific standards for delivery. Main determination is that number of students in the module show should contain over five hundred students. The module should have no less than two presentations, and that VLE(Virtual Learning Environment) should be available. In conclusion, the module should have significant students failing.
Structure of Data
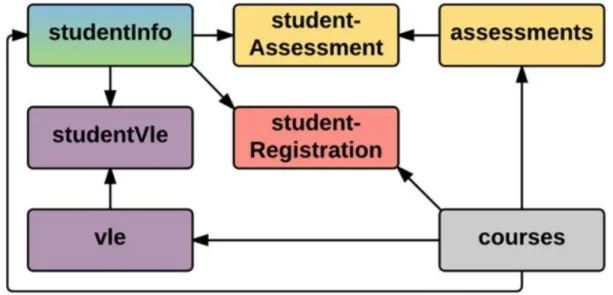
Figure 4 portrays table relations of all the tables available inside the database of OU.
Figure 4: Relation of tables in the database
From the above picture, we can clearly see that studentInfo table is connected with studentVle, studentAssessment and studentRegistration table. Also we can see that course table is connected with assessments, vle and studentRegistration table. Another relation we can see from the above picture is, assessment table is connected with studentAssessment and courses.
11 Test Datasets
StudentInfoVle.csv
There is six columns and a total of 173,912 rows in the file studentInfoVle.csv. This file contains StudentID, Course Code and presentation. From this file, we made another very important attribute called sum clicks, which is the equivalent to student’s action in the vle.
StudentInfoQ.csv
This is equivalent to StudentInfoVle, yet we converted the string values to numeric values.
We converted to numeric values that the algorithms we utilized (e.g., XGBoost, CATBOOST, and Decision tree) can use only numeric values. We mapped each string's values to numeric values. For instance, the student's final results were mapped like 0 for withdrawn, 1 for fail, 2 for pass, 3 for distinctions.
StudentAssessmentInfo.csv
There is ten columns and a total of 2,021,069 rows in the file StudentAssessmentInfo.csv.
We created the dataset through joining assessment and student_assessment_info.
MergedData.csv
The state of this data is 11 columns and a total of 1,048,545 rows, containing both studentAssessmentInfo & studentInfoQ. Through testing and recognizing feature significance, the last CSV document contained just six sections rather than 11. This is our final table in which we applied our prediction modeling. The tables consists the columns 'id student', 'code module', 'code presentation', 'num of prev attempts', 'final result'.
12 2.4 Some challenges during data processing
Data Missing
In the IMD_Band column, there were Null/Nan values which caused error. So, we have tto replace every Null/Nan value with 0. For this, we used pandas library from our jupyter notebook.
Imbalance of the data
During hypothesis testing and data investigation, we found that there is massive data imbalance available. In our final result table, there are 4 types of results- Failed, Withdrawn, Pass or Distinction. But in our data, Failed or Withdraw has more data than the other two. This was a problem. One of the advantages of utilizing XGBoost[4] and CATBoost[5] is that they can deal with data imbalances. In our scenario, these algorithms pur less weight when there is failed or withdraw, and vice versa for the remaining two.
Another strategy was to put arbitrary data. Like, 1000 students have got pass as their result.
Students who have got distinction, failed or withdrawn will also got 1000 arbitrary records.
Data validation and size
One of the table Student_vle had over 10 million rows. While handling such big portion of data, our algorithms ran very slow. Also, there were ambiguous student records. To solve this problem, we created aggregated feature like clicks. Clicks consists the vle activity of the students’ interactions.
Due to complexity of information and data about the name and kind of an evaluation or vle data, it was challenging to ensure that the data created was precise and exact. This was overseen by wrangling[6].
13
CHAPTER 3
HYPOTHESIS AND DATA ANALYSIS
First of all, before attempting data analysis[7] we first came up with mini hypothesis question and investigated whether our hypothesis was right or wrong. The reason why we did this is so by doing this we could generate one main hypothesis and then do our data modelling on that.
3.1 Hypothesis 1
H0: Gender Plays a fundamental job in students final result
H1: Gender doesn't assume a fundamental part in students final result
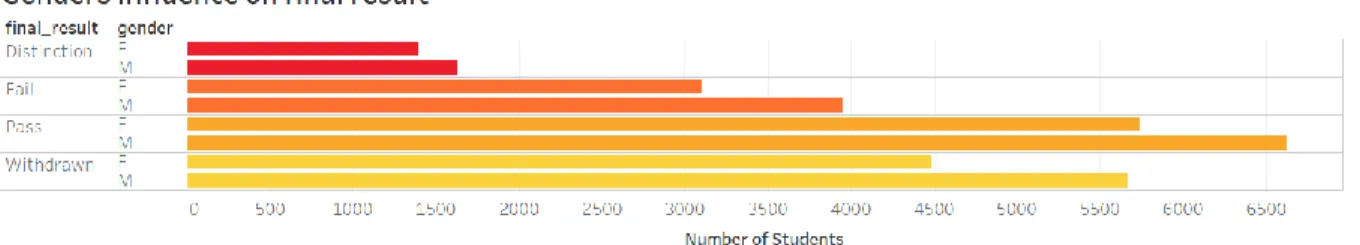
Figure 5: Shows the impact gender has on students' final result
Findings and verdict: For this hypothesis, we wanted to clarify that whether gender plays an important role on acquiring better final results or the other way around or does gender assumes a significant part in distinguishing a final result. We can clearly see from our chart that gender has no relationship with the final result of a student. This way, we reasoned that the null hypothesis H0 can be rejected and we accept H1 to demonstrate gender doesn’t play any significant role on a student’s final result.
14 3.2 Hypothesis 2
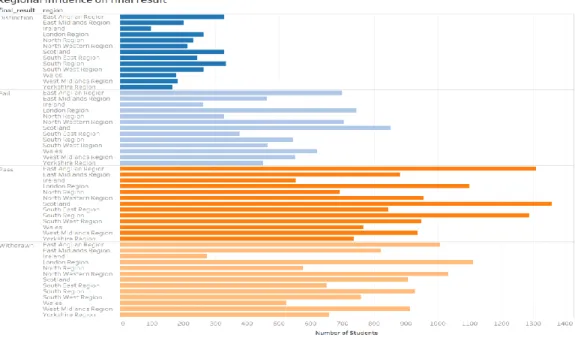
Ho: “The Regional Area is one of the critical contributors in the exhibition of the Students' final result.”
H1: “The Regional region where a student comes from doesn't affect a student's final result.”
Figure 6: Shows the impact region has on students' final results.
Findings and verdict: For this hypothesis, we wanted to clarify that region plays an important role to acquiring better final result. After investigation, we found that, region doesn’t influence the performance of the student’s final result. So, we reject the null hypothesis H0 and accept the H.
15 3.3 Hypothesis 3
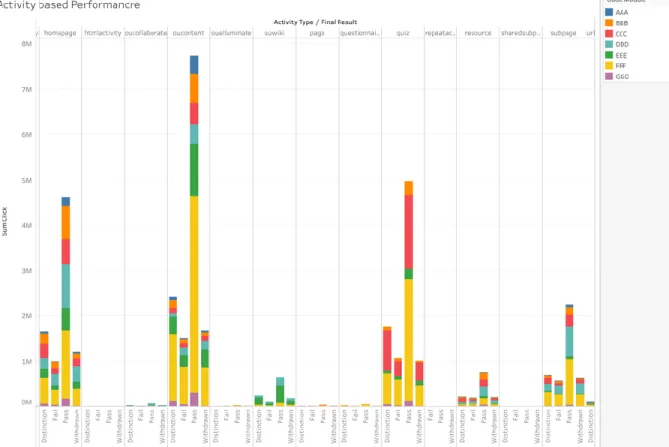
Ho: “Final Result has a positive connection with the measure of online action by the students.”
H1: Types of online activity a student collaborates with don't straightforwardly identify with student performance.
Figure 7: Shows the final result of the student dependent on their activities with interaction.
Findings and verdict: For this hypothesis, after seeing the graphs, we can conclude that, students who are active in oucontent got better result. So, we can conclude that, we accept our null hypothesis H0 and reject H1.
16 3.4 Hypothesis 4
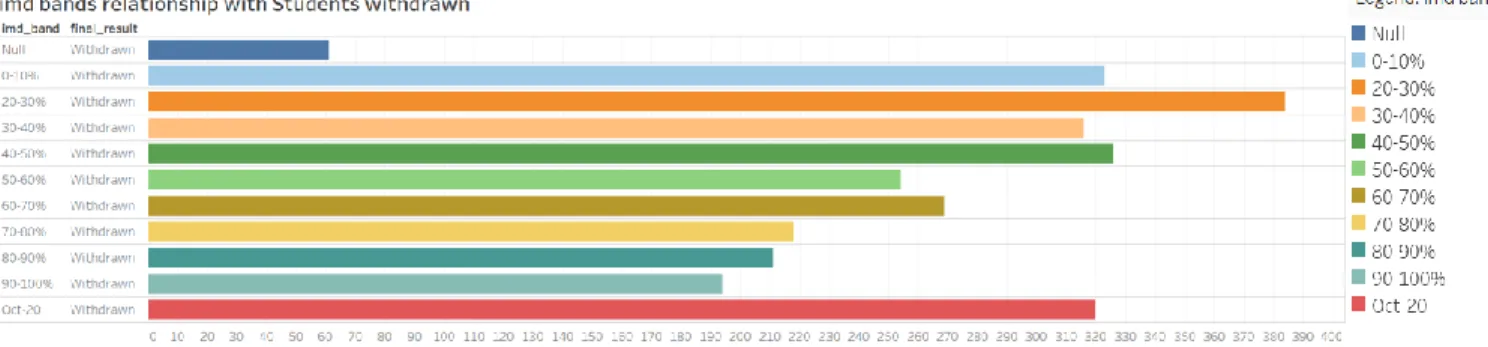
Ho: “Students from low imd-ratings regions are more inclined to withdraw from a course than their lower partners.”
H1: “Withdrawal rate doesn't correspond with withdrawal rate.”
Figure 8: Shows the relationship imd band have with students withdraw from subjects
Findings and verdict: For this hypothesis, from the chart we can see that, students who have imd_band of 20-30% are more prone to withdraw from course, whereas students with 90- 100% imd_band are less prone to withdraw from courses. So, we can conclude that there is a relation between the final result and imd_band. So, we accept the null hypothesis H0 and reject the H1.
17 3.5 Hypothesis 5
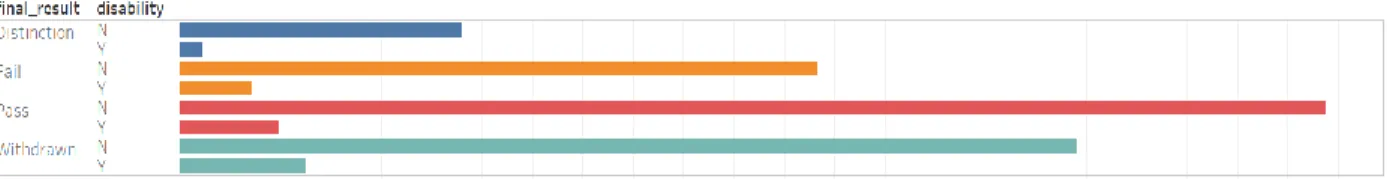
Ho: “Disability students perform more worse than non-disability students.”
H1: “Disability doesn't influence a student's presentation.”
Figure 9: Shows performance of disability students
Findings and verdict: For this hypothesis, we can see that both disabled and regular students are high in pass rate. Withdrawal rate is higher in regular students, and for disabled students, withdrawal rate is low. So we conclude that disabled student improved in less withdrawing and prone to finish their course.
3.6 Hypothesis 6
Ho: “Overall, does previous attempts permits students to excel on the final exam.”
H1: “Number of the previous attempts influences students to excel on the final test.”
Figure 10: Shows the impact of past endeavors on the final result
Findings and verdict: For this hypothesis, we can see that previous attempts don’t play any vital role. Also, our investigation discloses that multiple attempts won’t assist with improvements in the forthcoming assessment.
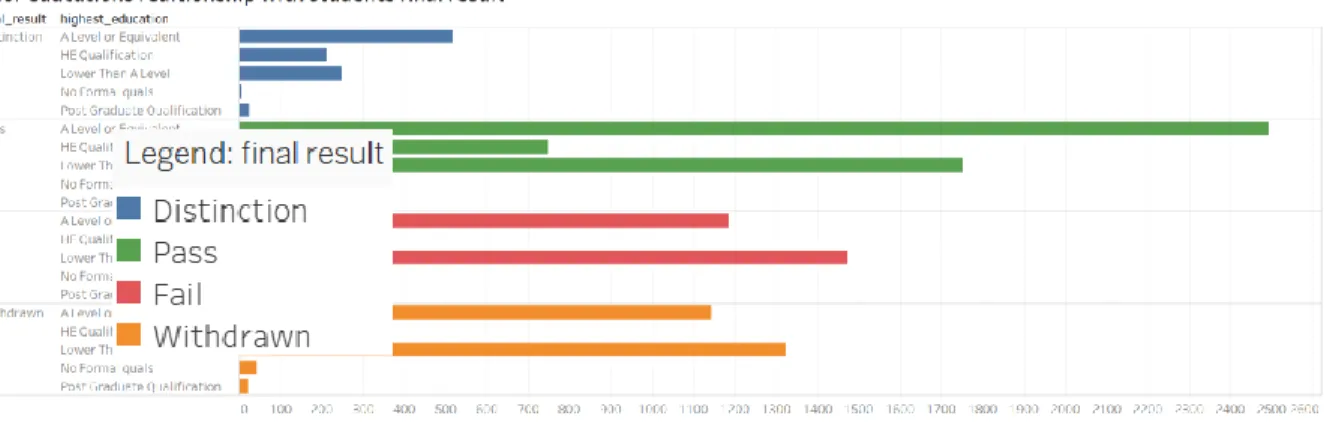
18 3.7 Hypothesis 7
Ho: “Prior education assist students with performing better in final Examination.”
H1: “We reject the null hypothesis as there is no huge connection between prior education and final result.”
Figure 11: Shows students earlier education relationship with the final result Findings and verdict: For this hypothesis, we can see that prior results has some impact on final result. We can see from the graph that, students with previous result as A or HE are more prone to get distinction and pass rate. So, we can conclude that we accept null hypothesis H0 and reject H1.
3.8 Hypothesis 8
Ho: “The quantity of students in class by implication influences the class environment and henceforth influences student performance.”
H1: “The quantity of students in a class has a direct/indirect effect on the student.”
19 Figure 12: The quantity of students in a class thought about against student performance
on the Final result
Findings and verdict: For this hypothesis, we can find that, number of students available in a class doesn’t influence the final result of a student. So, we conclude with rejecting the null hypothesis H0 and accept the H1.
3.9 Hypothesis 9
Ho: “Male is inclined to withdraw from the course than ladies.”
H1: “Male is more instinctive than female, performs better and is probably going to finish the course.”
20 Figure 13: Shows Genders withdrawn rate.
Findings and verdict: For this hypothesis, without much of a stretch, we can recognize that males think that it is more requesting about the course and are probably going to withdraw. The justification behind withdrawal could be different. Nonetheless, thinking about all that, we conclude with accepting the null hypothesis H0 and reject the H1.
21
CHAPTER 4 RESULT ANALYSIS
4.1 Objective
Tracking down a reasonable prediction model for anticipating a student’s final result from information of a student and demographic data.
4.2 Methodology to prepare a reasonable data set for modeling
Our target component is a student’s final result. To predict this, at first, we needed the connection between various features like student’s gender, region, background, age, online activity, previous level of study, number of clicks and so forth. Then depending upon thos demographic and social data, we tried to predict the final result of a student.
The principal issue was that, those data were gathered from different span of times in different files like student info, online activity of a student in student_vle data etc.
This is why we wrangled all the data in a single file MergeData.csv which we used for our prediction algorithm to dissect student’s final result.
22 4.3 Feature selection:
Figure 14: Shows the Feature Selection
Figure 15: Feature Selection Line Chart
4.4 Feature Engineering
We applied feature engineering to create features like sum_clicks and score depending on the assessment weights, and so on to predict the final result of a specific student.
23 4.5 Data Splitting
Eventually, the dataset we produced for our machine learning prediction model contains 11 important features and 592000 rows, including our target feature (final result). These features are the main provisions that have been painstakingly looked over different performance estimation models.
We divided our datasets to play out any machine learning algorithm to train data and test data. We used our train data to prepare our model for predicting, and we used the test data to gauge our model’s performance.
We used the ‘train_test_split’ package from sklearn to divided our data into train and test data.
Some basic split among train and test data are: 80:20,90:10,60:40,70:30 and so on.
4.6 Hyper-parameter Tuning of each model
For doing the performance investigation of various models, we have chosen five levels. At every level, we recorded the accuracy of our model. This process was a time consuming one, particularly for XGBOOST and CATBOOST. These algorithms can learn from each cycle and train accordingly. In this way, we needed to ensure that we give our models sufficient time to learn and perform accordingly. For instance, in CATBOOST, after cycle number 300, we got our best result.
24 4.7 Comparative analysis of each model
TABLEI.COMPARATIVEANALYSIS
Algorithm performance
Trial 1 Trial 2 Trial 3 Trial 4 Trial 5
Decision Tree 64 63 67 68 69
Random Forest
66 64 69 63 65
KNN 42 45 53 55 56
CATBOOST 96 94 95 93 96
XGBOOST 65 88 86 87 89
Figure 16:Performance investigation of the various models for predicting the final result
25 From the above char and table, we can find that CATBOOST is the winner compared to other models over 90% accuracy. This is because CATBOOST learns in each iteration and discover the classifiers with weak weight and attempt to develop its performance, further giving loads to them in following emphasis and further develops general accuracy. The main down side of CATBOOST is that, if the dataset is huge, then it will take huge time and computing resources to perform. XGBOOST is the close contender, even it begins with a lower accuracy rate, but ultimately it reached accuracy over 85%.
4.8 A FEW CHALLENGES
Managing a data set that has close around 2 million rows was really difficult for us. We were battling a ton initially for legitimate tool choice. We attempted WEKA and ORANGE for demonstrating; however, they fizzled as these two stages don't uphold broad data with restricted computing resources. Lastly, we used Jupyter Notebook and utilized the power of python libraries.
Finding our objective was also a challenge. We started with many things in mind, but later we limited our objective to few hypotheses and predict a student’s final result.
26
CHAPTER 5 CONCLUSIONS
5.1 Conclusion
Through our report, we could recognize the key attributes that would impact how a student will act as far as their final result in the wake of finishing the module. We were able to create a prediction model which can 96% accurately predict a student’s final result.
The motivation of this research can be predicting a student’s condition early and suggest course plans to them. The admin and the teachers will have the necessary access to the student’s demographic and online data which they can use to evaluate and assign resources and material to student’s according to the weight of the assignment. Also this information can be helpful for the teacher to get an idea about a particular student. About their weakness on any subject of assignment, and help them accordingly.
This investigation can also be used to give the student’s a better online learning experience.
By analyzing the clicks and activity data, teachers and admins can have an idea that which contents or subjects are more user friendly for the students. They can produce more contents like that so that students can enjoy the experience. Thus, withdrawal of fail can be reduced.
27
REFERENCES
[1] “Learning Analytics System“ University of the British Columbia (2020). Learning Analytics. Retrieved from https://learninganalytics.ubc.ca/about-the-project/tool-pilots/
[2] “Data Preparation”Kotu, V. Deshpande, B. (2019). Chapter 3 - Data Exploration. Data Science (Second Edition).Pages 39-64. https://doi.org/10.1016/B978-0-12-814761-0.00003-4.
[3] Kuzilek J., Hlosta M., Zdrahal Z. (2017). “OU published the data we used (Open University)” Open University Learning Analytics Dataset Sci. Data 4:170171 doi: 10.1038/data.2017.171. Retrieved from https://analyse.kmi.open.ac.uk/open_dataset
[4] “XGBoost” Data Preparation for Gradient Boosting with XGBoost in Python(2020).
https://machinelearningmastery.com/data-preparation-gradient-boosting-xgboost-python
[5] “CATBOOST”CatBoost – A new game of Machine Learning.(2020) Retrieved from https://affine.ai/catboost-a-new-game-of-machine-learning/
[6] "Data wrangling" What is Data Wrangling(2020). https://www.altair.com/what-is-data-wrangling [7] Haroon, M. (2020). Big Data Exploration, Visualization and Analytics.“Data Analysis” Retrieved from https://datascience.foundation/datatalk/big-data-exploration-visualization-and-analytics
28
PLAGIARISM REPORT
29