reMote sensing approach
noorazuan bin Md. hashim1, asmala bin ahmad2 and Mardina binti abdullah3
1School for Social, Development and Environmental Studies, Faculty of Social Sciences and Humanities,
Universiti Kebangsaan Malaysia, 43600 UKM, Bangi, Selangor E-mail: [email protected]
2Department of Science and Mathematics, Centre for Academic Services (CAS), Kolej Universiti Teknikal Kebangsaan Malaysia
Locked Bag 1200, Ayer Keroh, 75450 KUTKM, Melaka E-mail: [email protected]
3Department of Electrical, Electronic and Systems, Faculty of Engineering, Universiti Kebangsaan Malaysia, 43600 UKM, Bangi, Selangor
E-mail: [email protected]
abstract
This article investigates the application of remote sensing data for mapping urban heat island (UHI) phenomenon in an urbanised area of Selangor. The selected area covers Kajang, Cheras and Dengkil mukims in Selangor with total area of 4950 ha. The urban heat island was determined by using the land surface temperature (LST) information from thermal infrared band (Band 6) of Landsat image with 120 m pixel resolution. A subset of Landsat TM acquired on April 17, 1988 (path 127/row58) covers the urbanised
mukims was used in this study. Erdas Imagine 8.5 was the main software for image classiication of urban land covers in 1988, while
GIS-Grid Calculator functions were used to derive land surface temperature. This study demonstrates the spatial variation of LST within urban blocks with temperature above 27.5o Celcius. About 3557 pixels (or approximately 32 ha of area) has been identiied as UHI pixels in both Cheras and Kajang mukims. Urban impervious area near Pekan Bt 9, Cheras, Kajang town and Bandar Baru Bangi have been recognised areas with highest number of UHI-related pixels. The result revealed the effectiveness of remote sensing data application in analysing urban heat island-land surface temperature relationships in Selangor.
Keywords: Land Surface Temperature (LST), Thermal Infrared, Urban Heat Island (UHI)
1. introduction
The state of Selangor has experienced rapid development and high growth of urbanisation and industrialisation over the past two decades. These urban transfusions especially in Klang Valley conurbation have altered its physical and natural
environment. Urban encroachment was signiicant especially in
urbanised mukims of Kajang, Cheras and Dengkil, transferred rural environment into a new urban landscape. In late 1980s, a large rural area of agricultural land has been converted into urban
areas, hence changed the surface proile of the area [1, 2].
The urban surfaces absorb heat and increase the temperature comparatively to the surrounding area. The heat bubble, known as urban heat island (UHI) not only reduced human comfortability
but it also could increase energy consumption in buildings [3, 4]. For daytime temperatures, it is observed that large cities such as Kuala Lumpur, Georgetown and Seremban can be 3oC hotter
than the suburbs area [5]. Latest research has also showed the
effectiveness of urban heat island in changing the urban
micro-climate e.g. changes of intensity and frequency of rainfall [6, 7, 8]. Urban areas may create higher frequency and magnitude of
rainfall events due to the ‘urban heat island’ effect and increase the water input into an urban catchment.
2. urban heat island studies
The UHI phenomenon is also well known among various
agencies in Malaysia. For example, the Malaysian Meteorological
Service is concerned on warm nights due to UHI in metropolitan areas that can induced higher frequency of ‘heavy’ rainfall. A
study carried out by the Department of Irrigation and Drainage
has revealed a rising trend of 3-hour rainstorms characteristics
in Kuala Lumpur compared with rainfall observed in a rural
area [6]. The difference of the 3-hour rainstorms has increased at least 6 % in the urban station i.e. Kuala Lumpur due to
UHI phenomenon.
The urban heat island effect deines as larger temperatures in
urbaniced areas as compared to surrounding areas with relatively
larger amount of vegetation [3, 9]. Nowadays, urban heat island
is a common phenomenon in major cities in the world, including Malaysia. This is because of large areas of dark surfaces like concrete roofs, pavements and asphalt whereby these surfaces can absorb more heat from the sun all day.
In general, land surface temperature is recorded by using Sling Psychrometer at certain point on the ground. The reading shows ambient temperature variation within a limited space, for example, from 10 m2 up to 1 km2 radius, or depend on land cover types as well as local topographical element. However, surface temperature detection using remote sensing method is cost effective and
involved large and synoptic view [10, 11].
This article investigates the application of remote sensing data for detecting land surface temperature (LST) and mapping UHI phenomenon. Urban heat island due to rapid growth in urbanisation can be determined by using the surface temperature information
from Thermal Infrared band (10.40 – 12.50 µm) of Landsat
image. However, works need to be done for LST retrieval from
the original raw Digital Number (DN) value of band 6 Thermal
Journal - The Institution of Engineers, Malaysia (Vol. 68, No.3, September 2007) 26
LST is an important parameter in the ield of atmospheric
sciences as it combines the result of all surface-atmosphere
interaction and energy luxes between the ground and the
atmosphere and is, therefore, a good indicator of the energy
balance at the Earth’s surface [12]. LST controls the surface heat
and water exchange with atmosphere. Estimation of LST from satellites infrared radiometers has been proven useful and most studies have focused on the use of Landsat images because of their
high spatial resolution [11].
3. study area
The study area (Cheras, Kajang and Dengkil mukims) is located in central part of Selangor, the most urbanised state in Malaysia
(Figure 1). Geographically, the study area falls within latitudes 3o 26’ N and 3o 31’N, and longitudes 101o 18’ E and 102o 33’E.
The geographic location of the Landsat TM image for this study
area is Path 203, Row 23 according to the Worldwide Reference System (WRS).
The study area is located downstream of Langat river basin,
which Sungai Langat forms major drainage lows towards Straits
of Malacca. The general topography varies considerably. The study area experienced hot and wet tropical climate with an
average annual temperature between 21o to 32o Celsius. The
annual rainfall is approximately 1900 mm, that is lower than the
overall average rainfall for the Peninsular of Malaysia [3]. October
to December are considered as wet season, whereas January, June and August are months of the driest period in the study area.
The April 17, 1988 scene has been selected due to several
factors, i) the UHI study should take consideration on antecedent
soil wetness condition (ASW). High value of ASW will produced error in the LST retrieval [13]. In our pilot study, most of recent images (1999 and 2001 for Path 127/Row58) have a very high ASW relatively due to prolonged wet spell within the Langat
basin (Table 1).
The April 17, 1988 scene has also recorded drastic changes
of land cover within the Langat basin. Based on landuse maps
(1984-1999), it was recorded a signiicant increment of urban land cover especially in Cheras, Kajang and Dengkil mukims [1].
This was due to the development of newly township area within Kajang-Bandar Baru Bangi corridor in the late 1980s.
4. Methodology
Basically, there are two major methods involved in this study,
image classiication and land surface temperature retrieval:
i. Image classiication
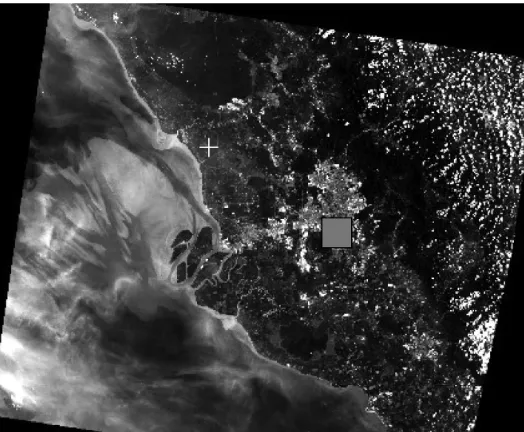
A subset of Landsat TM acquired on April 17, 1988 (path 127/ row58) that covers an urbanised mukims (Kajang-Cheras-Dengkil) was used in this study (Figure 2). 15-class ISODATA unsupervised classiication was then performed using ERDAS-IMAGINE on the
dataset in order to interprete the land cover information of the study
area [1]. Based on visual examination on the 1984 Land Use Map of
Figure 2: A subset of Landsat TM covers three main urban mukims, i.e. Dengkil, Kajang and Cheras
Figure 3: Image classiication for 1988 Figure 1: The location of study area in Landsat TM scene
Image Acquisition Date
Total rain 5
days before image acqui-sition date at UM station (mm)
Total rain 5
days before image acqui-sition date at PJ station (mm)
Total rain 5
days before image acqui-sition date at Subang station (mm)
April 17,
1988 (dry) 12
0 7.2
February 11,
1999 (wet) 111.5 72 21.4
May 5,
2001 (wet) 35 32 29.5
Selangor, ive common land cover types can be detected and well represented in the ISODATA result (Figure 3).
ii) Land Surface Temperature (LST) Retrieval
LST retrieval was carried out through three phases.
i) Conversion from Digital Number to Radiance
All TM bands are quantised as 8 bit data thus, all information is
stored in DN with range between 0 to 255. The data was converted to radiance using a linear equation as shown below:
CVR = G (CVDN) + B (2)
where:
CVR = the cell value as radiance
CVDN = the cell value digital number
G = the gain (0.005632156 for TM6 and 0.003705882 for
ETM+6)
ii) Conversion from Radiance to Brightness Temperature By applying the inverse of the Planck function, thermal bands radiance values was converted to brightness temperature value.
T =
(3) where:
T = º Kelvin
CVR = the cell value as radiance
K1 = calibration constant 1 (607.76 for TM) and (666.09 for ETM+)
K2 = calibration constant 2 (1260.56 for TM) and (1282.71 for ETM+)
iii) LST Retrieval
LST was derived from TM6 using model developed which use spectral surface emmissivity and Normalised Density Vegetation Index or NDVI values of the particular scene [18]. The equation
is as below,
St = (4)
where:
St = LST
= wavelength of emitted radiance ( = 11.5 μm) r = h×c/ (1.438 ×10⁻² m K)
σ = Boltzman constant (1.38 ×10⁻²³ J/K) h = Planck’s constant (6.626×10⁻³⁴ J s) c = velocity of light (2.998 ×10⁸ m/s)
Emissivity ε can be estimated through:
= fv v + ( 1-fv ) s (5)
where v and s denote emissivity of vegetation ( v = 0.99) and soil ( s = 0.973), while fv can be expressed as [14]:
fv = 1 - (6)
where:
NDVI max = NDVI for complete vegetation cover NDVI min = NDVI for bare soil
a = function of leaf orientation distribution with the canopy
5. result and discussion
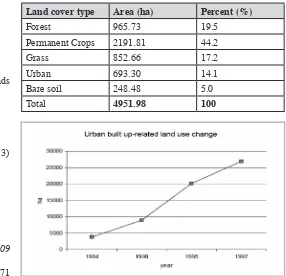
Table 2 shows the land cover classiication result based
on the year 1988 in the study area. The result shows the spatial variation of land covers within the mukims in 1988. Cheras and Kajang were the most urbanised area compared to Dengkil. The vegetated or permanent crops area occupied more of the Dengkil than other land cover types. Most of the agricultural area was high-grade farmland that is associated with local alluvium soil.
In 1988, the most extensive urban area is within Cheras-Kajang-Bandar Baru Bangi corridor. Some of the open spaces, especially around Dengkil and Kajang area were bare soils demarcated the newly urban development area. The amount of urban area in 1988 indicates that the area had undergone urbanisation and industrialisation in the the early 80s. The increment of the urban built up area in Langat river
basin from 1984 to 1997 (Figure 3) [1]. These urbanised mukims
were most affected area of urbanisation in the Langat river basin
since late 1980s (Figure 4).
T 1 + ( x T / r) In
K2
In + 1 K1
CVR
NDVImax - NDVI
NDVImax - NDVImin a
land cover type area (ha) percent (%)
Forest 965.73 19.5
Permanent Crops 2191.81 44.2
Grass 852.66 17.2
Urban 693.30 14.1
Bare soil 248.48 5.0
Total 4951.98 100
Table 2: Land cover of the study area year 1988
In terms of LST spatial variation, Figure 5 shows the temperature values between 24o to 26o Celsius. Most of the areas
with these temperature values include urban, grass and bare soil
covers (see Figures 5 and 7). These areas cover approximately 146,236 pixels. Agricultural and forest covers exhibit lower temperature value, i.e. less than 24o Celsius and form ‘cold
island’ phenomenon.
Based on Figure 5, the two degree Celcius difference is signiicant enough to visualise the effective temperature for human comfortability. According to Shaharuddin [15], temperature value above 24º Celcius refers to the ‘above acceptable value’ for
human comfort in the tropical region. He also recommended the optimum effective temperature for Kuala Lumpur i.e. between
20 to 22º Celcius. However, the area (total pixel involved) that
can be considered as optimum effective temperature was rather
small in 1988 (Figure 6).
Figures 7 to 9 shows the location of urban heat island (UHI)
within the urban blocks, especially in Cheras and Kajang mukims.
About 3557 UHI-related pixels have been identiied, mostly
within Pekan Bt. 9, Cheras, Kajang town center and Bandar Baru
Bangi area. These areas have the highest LST values (above 27.5o
Celsius) as the high intensity of thermal energy responses due to the man-made impervious covers such as asphalt and concrete
[3, 9, 15]. This variability of UHI in the study area will likely
to increase energy consumption and demand for cooling system in buildings.
Research elsewhere also conirmed the human health risk due
to UHI because of heightened levels of secondary pollutants such
as ozone in urban conurbation [8]. Given the relationship between
surface temperature and the land cover types, the dynamics in
urban changes have a profound effect on the UHI. For example, if
the deforestation is not practice wisely, this will increase the area related to UHI.
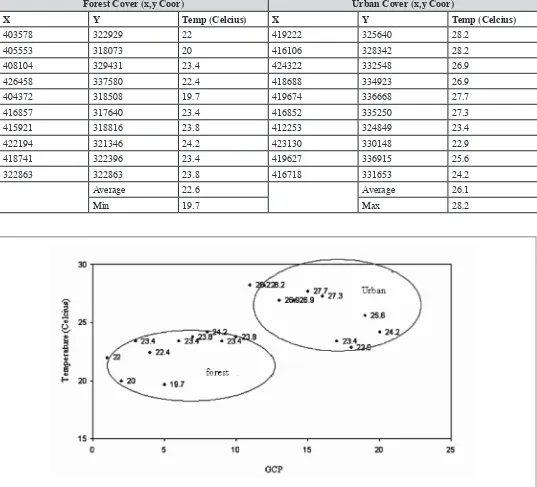
Vegetation or forest patches within urban conurbation are essential in reducing surface temperature as cooling effect due
to evapo-transpiration processes [4]. The inverse relationship
between forest cover and urban built-up in affecting LST has
been signiicantly proven (Figure 10). Based on 20 ground
control points collected randomly for within the LST map, it shows a different group of surface temperature based on land
cover characteristics in the study area (Table 3). The differences between both land cover types, i.e. about 8.5o Celsius shows the
importance of vegetation coverage in minimising the thermal energy responses in urban areas.
6. conclusion
The urban conurbation of Kajang-Cheras-Dengkil mukims, one of the fast expanding Selangor urban areas, has a remarkable UHI-related area in 1988. It becomes more important to urbanisation as the new central government city, i.e. Putrajaya hasten in-migration processes towards this conurbation area in 1990s. The Landsat TM data with
120 m resolution of band 6 in estimating LST succeed to
highlight the UHI-related area in 1988.
This LST result could help especially to urban planners in better understanding urban climate as well
as inding solution of managing urban environment. The
result also shows remote sensing data has been found to be effective in analysing urban-land surface temperature relationships. Data quality and accuracy assessment of
Journal - The Institution of Engineers, Malaysia (Vol. 68, No.3, September 2007) 28
Figure 7: Distribution of UHI (in red) greater than 27.5o C in the year 1988 within
the urban blocks (in yellow). 3557 pixels has UHI greater than 27.5o c
Figure 4: The study area within Langat river basin
Figure 5: 1988 temperature image – red region indicates area with temperature 24o C – 26o C (146,236 pixels). The white region indicates
area mostly from vegetation cover
Figure 8: The UHI within Kajang urban block Figure 9: The UHI within Cheras urban block
Forest cover (x,y coor) urban cover (x,y coor)
X y temp (celcius) X y temp (celcius)
403578 322929 22 419222 325640 28.2
405553 318073 20 416106 328342 28.2
408104 329431 23.4 424322 332548 26.9
426458 337580 22.4 418688 334923 26.9
404372 318508 19.7 419674 336668 27.7
416857 317640 23.4 416852 335250 27.3
415921 318816 23.8 412253 324849 23.4
422194 321346 24.2 423130 330148 22.9
418741 322396 23.4 419627 336915 25.6
322863 322863 23.8 416718 331653 24.2
Average 22.6 Average 26.1
Min 19.7 Max 28.2
Table 3: 20 GCP collected for land cover – LST relationships
Journal - The Institution of Engineers, Malaysia (Vol. 68, No.3, September 2007) 30
the result is an important and rather dificult task in LST analysis.
In our study, the assessment of the result was not conducted due to lacking of ground temperature information. However, in order to produce more reliable and meaningful result, future study should incorporate ground weather station information for thermal infrared data calibration. n
reFerences
[1] Noorazuan, M.H, Ruslan R, and Haizan, J. 2003. GIS
application in evaluating land use – land cover change and its impact on hydrological regime in Langat. Inter
national Proceedings of Map ASIA 2003. WWW URL: www.GISdevelopment.net. Singapore. [online]
22 February 2003.
[2] Kamaruzaman, J and Hasmadi I. 1999. Monitoring of land
cover changes in Sungai Langat Basin using satellite
remote sensing technique. Paper presented at National
seminar on Integrated drainage basin management and modelling. Universiti Kebangsaan Malaysia. UKM Bangi
16-17 November 1999.
[3] Shaharuddin A., Noorazuan M.H. & Yaakub M. 2006. Best Management Practices for Stormwater and Heat Reduction using Green Roof : The Bangi Experimental Plot. Paper
presented at Southeast Asian Geography Association
(SEAGA) Conference. 28-30 November 2006. Singapore. [4] Weng, Q. 2001. A remote sensing-GIS evaluation of urban
expansion and its impact on surface temperature in
Zhujiang Delta, China. Int. J. Remote Sensing, 2001, Vol 22, No 10, 1999-2014.
[5] Sin H. T. and Chan N. W. 2004. The urban heat island phenomenon in Penang Island: Some observations during
the wet and dry season. In Jamaluddin Md. Jahi, Kadir
Ariin, Salmijah Surif and Shaharudin Idrus (eds). Proceed ings 2nd. Bangi World Conference on Environmental Management. Facing Changing Conditions. 13 – 14 September, 2004. Bangi, Malaysia. 504 – 516.
[6] Ahmad, F and Norlida, M. 2004. Can we modify our weather to decrease loods? The urban heat island connection.
Paper presented at Persidangan Pengurus Kanan JPS
Malaysia. 25-27 Ogos 2004. Kota Kinabalu, Sabah. [7] Jauregui, E., and. Romales, E. (1996), Urban effects of
convective precipitation in Mexico City, Atmos. Environ.,
30, 3383–3389.
[8] Solecki, W. Cynthia R, Gregory P, Mark C, Richard G and Alex P. 2004. Urban Heat Island and Climate Change: An
Assessment of Interacting and Possible Adaptations in the
Camden, New Jersey Region. Research Project Summary. New Jersey.
[9] Arnis, A, Shattri, M. Wong, T.H. 2003. Rule based classii
cation for urban heat island mapping. Proceedings of the
2nd FIG Regional Conference Marrakech, Morrocco. The
International Federation of Surveyors (FIG), Morrocco. [10] Jensen, J.R., 1996, Introductory Digital Image Processing,
2nd Ed., Upper Saddle River, NJ: Prentice Hall, 318 pages. [11] Sarkar, H. 2004. Study of Landcover and Population
Density Inluences on Urban Heat Island in Tropical Cities by Using Remote Sensing and GIS: A Methodological Consideration. Paper presented at the 3rd FIG Regional Conference. Jakarta, Indonesia, October 3-7, 2004
[12] Jackson L., Kustas, T.J., Schmugge, W.P., French, J., Cosh, A. N., and Bindlish, R., 2004 Deriving land surface temperature from Landsat 5 and 7 during SMEX02/ SMACEX, Remote Sensing of Environment, vol. 92, pp. 521-534.
[13] Sun, D and Pinker, R. 2004. Case study of soil moisture
effect on land surface temperature retrieval. IEEE Geoscience
and remote sensing letters. Vol 1, No 2, April 2004.
[14] Sobrino, J.A, Munoza and J. Paolini, F. 2004. Land surface temperature retrieval from LANDSAT TM 5. Remote Sensing of Environment 90 (2004) 434–440.
[15] Shaharuddin, A. 1997. Urbanization and human comfort in
Kuala Lumpur-Petaling Jaya, Malaysia. Jurnal Ilmu Alam,
Bil 23, 171-189.
asMala bin ahMad
Asmala Ahmad, received MSc. in Land Surveying
with specialisation in Remote Sensing from University of Technology Malaysia in 2001. He is currently a
Lecturer at the Department of Industrial Computing,
Faculty of Information and Communication
Technology, Universiti Teknikal Malaysia Melaka (UTeM). the Social, Development and Environmental Studies, Universiti Kebangsaan Malaysia (UKM).
Mardina binti abdullah
Mardina Abdullah, received PhD from University of
Leeds in 2005 and currently a Senior Lecturer at the
Department of Electrical, Electronic and Systems,
Faculty of Engineering, Universiti Kebangsaan