UNIVERSITI TEKNIKAL MALAYSIA MELAKA
USING VISUAL MANAGEMENT TOOL TO ERROR PROOF
WIP LOTS WITHDRAWAL IN SEMICONDUCTOR
MANUFACTURER
This report submitted in accordance with requirement of the Universiti Teknikal Malaysia Melaka (UTeM) for the Bachelor Degree of Manufacturing Engineering
(Manufacturing Management) (Hons.)
By
WONG KUAN LIH B051210022 910510-07-5380
DECLARATION
I hereby, declared this report entitled “Using Visual Management Tool to Error Proof WIP Lots Withdrawal in Semiconductor Manufacturer” is the results of my
own research except as cited in the references.
Signature : ………
Author’s Name : WONG KUAN LIH
APPROVAL
This report is submitted to the Faculty of Manufacturing Engineering of UTeM as a partial fulfillment of the requirements for the degree of Bachelor of Manufacturing Engineering (Manufacturing Management) (Hons.). The member of the supervisory is as follow:
i
ABSTRAK
iii
ABSTRACT
iv
DEDICATION
v
ACKNOWLEDGEMENT
I would like to express my gratitude to my academic supervisor, Associate Professor Dr. Chong Kuan Eng for his advice and guidance throughout the duration of this final year project. Without his kindly guidance, I might get lost in this final year project.
Special thanks to my industry supervisor, Ng Kam Choi at Case Company, he always supporting and giving me some idea when I face problems in this final year project.
vii
2.4.4 A3 15
2.4.5 Standard Operating Procedures 16
2.4.6 Seven Quality Tools 16
2.4.7.6 Production Control Board 25
2.4.7.7 Visual Management Board 25
2.4.7.8 Kanban 26
2.4.7.9 Five S 28
2.5 Visual Management Implementation 29
2.5.1 Application of Visual Management Tool in Industries 29
2.6 Benefit of Implementing Visual Managment 33
2.7 Summary 35
CHAPTER 3: METHODOLOGY 37
3.1 Flow of methodology 37
3.1.1 Research Methodology for FYP 1 38
3.1.1.1 Conceptualization 39
3.1.1.2 Literature Review 40
3.1.1.3 Design of Methodology 40
3.1.2 Research Methodology for FYP 2 40
3.1.2.1 Data Collection Plan 41
3.1.2.2 Data Analysis 43
3.1.2.3 Develop the Plan, Implement the Plan and Validate 44
the Result
3.1.2.4 Conclusion and Documentation 46
viii CHAPTER 4: DESIGNING A FIFO CABINET AND PROPOSALS FOR 47
IMPROVEMENT
4.1 Data Collection for Operators’ Errors 47
4.1.1 Data Analysis 49
5.2.1 Data Collection for Operators’ Errors 69
5.2.2 Data Analysis 71
5.3 Feedback 74
5.3.1 Before Implementation of FIFO Cabinet with 5S, Colour 75 Code and SOP
5.3.2 After Implementation of FIFO Cabinet with 5S, Colour 76 Code and SOP
CHAPTER 6: CONCLUSION AND RECOMMENDATION 83
6.1 Conclusion 83
ix
REFERENCES 85
APPENDIX A 90
APPENDIX B 91
APPENDIX C 92
x
LIST OF TABLES
2.1 Research and Article of Implementation of Visual 32 Management Tool in Industry
2.2 Benefits of Implementing Visual Management Tool 34
3.1 Data Collection Sheet (Operators’ Errors) 42
4.1 Operators’ Errors before Implementation of FIFO Cabinet with 5S, 48 Colour Code and SOP
4.2 BOM List of the Components 59
4.3 Five S Plans 60
4.4 Standard of Procedure (SOP) 63
5.1 Operators’ Errors after Implementation of FIFO Cabinet with 5S, 69 Colour Code and SOP
xi
4.1 Percentages of Operators’ Errors before Implementation of FIFO 49 Cabinet with 5S, Colour Code and SOP
xii 5.3 Percentages of Operators’ Errors after Implementation of FIFO 71
Cabinet with 5S, Colour Code and SOP
5.4 Result for Before and After the Implementation of FIFO 72 Cabinet with 5S, Colour Code and SOP
5.5 Root Causes of Operators’ Errors Reduced 73
xiii
5S - Sort, Set in Order, Shine, Standardize and Sustain SOP - Standard Operating Procedure
OSHA - Occupational Safety and Health Administration ANSI - American National Standards Institute
1
CHAPTER 1
INTRODUCTION
This chapter defines the background of study, problem statement, objective, scope and organization for the whole project.
1.1Background of study
In a high technology era, manufacturing industries faced strong competition with other organizations to maximize profit, productivity and customer satisfaction.
According to Nurul (2012), a high level of coherence between strategies and implementation of good practices are being developed and maintained at all industry due to the competitive pressure among them. Therefore, the industry try hard to improve their manufacturing practises or system continuously to reduce lead time in their operations, improve product quality and ensure the product at competitive selling price.
Semiconductor industry at Malaysia accounts for 25% of the industry‟s exports and 30% manufacturing output making it a major contributor to Malaysia economy (Ooi, 2007).
2 Singapore and Japan. In order to sustain in the markets, this company should continue to develop a good practices that can reduce waste in every sectors. However, operators‟ errors in choosing a wrong lot has impacted the fluency of production flow. This will give impact to production efficiency and subsequently will increase cycle time of the production line.
The focus of this study is to investigate the causes of operators‟ errors and through the implementation of the right methodology such as FIFO cabinet and visual management tool. FIFO cabinet aids in error proofing by allowing flows of WIP lots in the manner of first WIP lots to go in will be the first WIP lots to go out. Visual management tool, a tool that gives clear information in the way of highlight graphic rather than numbers and words, so that employees can understand the information at glance, communicate in ease way and perform jobs in an effective and efficient way FIFO cabinet with visual management tools will reduce operator‟s error in picking the wrong lot and ensure the operator take the right lot based on schedule.
1.2Problem Statement
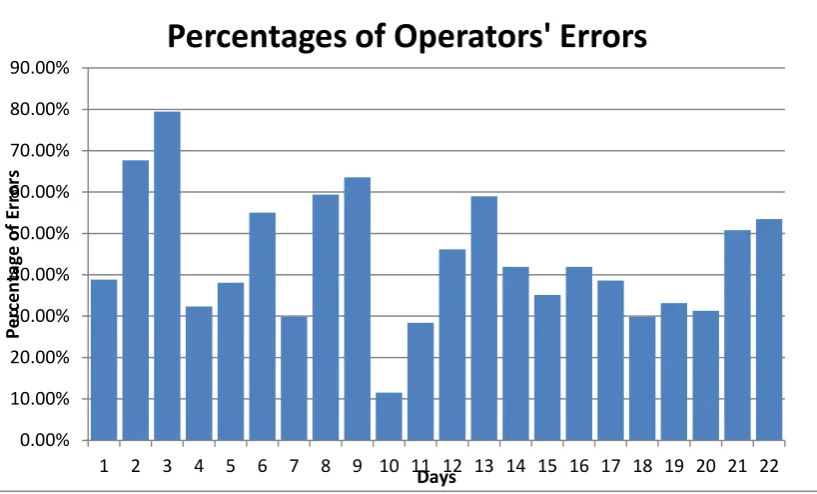
The case company is currently facing operators‟ errors in picking lots (WIP product) at the bottleneck machine. Figure 1.1 shows the percentage of operators‟ errors in picking WIP lots in one month period. The WIP products are kept inside a cabinet without proper arrangement according to schedule. Operators waste a lot of time in finding a right lot, and randomly pick an undesirable lot to put inside the detapping machine.
3
Figure 1.1: Percentages of Operators‟ Errors
1.3Objectives
The aim of this project is to reduce the operators‟ errors in picking wrong WIP lots and ensure the operators pick the correct WIP lots according to schedule.
The objectives of this project are:
1. To identify the causes of operators‟ errors in picking the wrong WIP lots. 2. To redesign a FIFO cabinet and develop a visual management tool to reduce
operators‟ errors in picking the wrong WIP lots.
3. To implement the FIFO cabinet with visual management tool in case company and validate the benefits.
1.4Scope of Study
The scope of this project is focused to the application of visual management tool approach as a methodology for discrete department and end of line in case company. The study is conducted on the detapping machine and TSNP product.
4
1.5Organization of Report
This report is constructed as follows: I. Chapter 1- Introduction
It introduces the overall report with background study, problem statement, objective, scope and organization of the report.
II. Chapter 2-Literature Review
This chapter presents the literature review of lean and visual management tool according to journal, book, article and other resources. It discusses the implementation of visual management tool in various industries and benefit of applying visual management tool.
III. Chapter 3 – Methodology
This chapter describes the appropriate methodologies chosen to carry out this study.
IV. Chapter 4 – Redesigning a FIFO Cabinet and Proposals for Improvement This chapter presents the operators‟ errors before the implementation of proposals, discusses the proposals such as redesign a FIFO cabinet together with implementation of 5S, colour code and SOP.
V. Chapter 5 – Result and Discussion
This chapter presents the result of implementing visual management tools in detapping machine, validates, analyses and discusses the result.
VI. Chapter 6 – Conclusion and Recommendations
5
CHAPTER 2
LITERATURE REVIEW
This chapter discusses literature review. It covers the work done such as journal, book, article, etc by previous researchers from various significant references. It reviews house of lean, various visual management tools, and benefits of applying visual management tools in a lean environment.
2.1Introduction of Lean Manufacturing
Lean manufacturing is a best manufacturing strategy that is derived from Toyota production system (TPS) that can eliminate wastes and meet customer‟ satisfaction (Kriztina, 2011). There are many industries practice lean, number of lean transformation is increasing all around the world is the best proof of lean‟s significance and effectiveness.
Lean manufacturing is guided by five key principles which are identify the value of product by meeting customer‟s satisfaction, value stream mapping that helps better understanding of streamline work processes using relevant tools and techniques, work flows steadily and continuously without interruption from supporting activity to the next, response rate to the customer‟s rate of demand, keep the operations going on by constantly striving for perfection by a process of continuous improvement. According to Puvanasvaran (2014), lean highlights eight wastes which are the major loss to industry. The eight wastes:
I. Overproduction
6 II. Inventory
Carrying stock will increase cost and storage problems. All the activity performs at inventory areas such as racking, stacking, bar coding, etc. adds no value to the product.
III. Waiting
Waiting for products or services from previous operations, upstream activity does not deliver on time.
IV. Unnecessary motion
Movement of people that is unnecessary and it adds no value to the product.
V. Transportation
Cost is increasing through internal or external movement.
VI. Defects
Defects occur when a product fails to meet the expectation. Need wasting time to perform extra repairing operation.
VII. Inappropriate process
More steps in the process than required where it add cost but no value, customers do not want to pay for it.
VIII. Underutilized people
7
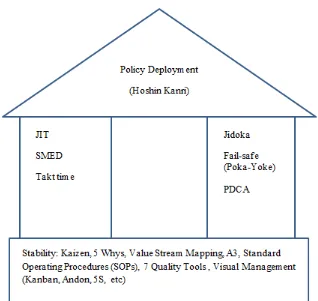
Figure 2.1:House of Lean (Michel, 2013)
Figure 2.1 shows the house of lean (Michel, 2013). There are two pillars: JIT and Jidoka, a basic element that regulate the mechanism of lean. However in order to make both pillars can stand strong, some fundamental tools can be used to support both pillars which are 5S, visual management, 7 quality tool, standard operation, Kaizen, 5 Whys, Value Stream Mapping, and A3.
2.2 First Pillar
8
2.2.1 Just In Time (JIT)
JIT is not produce the product and keep inside inventory then pushes the product to customer. It is a pull system whereas it only produces the product when there is a demand. In other words, JIT means that production begins only when requested or as needed basis is made to delivery (David, 2003).
According to Lutfar (2002), not only manufacturers, suppliers and vendors also play an important role to practice JIT; as to minimize inventory holding costs for the buyer, they must supply small quantities of items frequently. In order to reduce retailer‟s holding cost, the manufacturer also need to deliver small quantities of product. It is essential to maximize both production lot size and material purchasing lot size simultaneously by estimating all the operating parameter in order to implement JIT practice optimally.
Ziaul (1999) states that JIT involves trailing a perfect journey that has no defect, no inventories, no disturbance and total standardization, all these factors make the JIT philosophy not an easy way to be implemented. However, JIT cannot work alone as to improve the system performance continually, it needs a good commitment between reduction of organizational slack, participatory management, continual education, and proper problem solving.
2.2.2 SMED

