1Institute of Animal Breeding and Husbandry with Veterinary Clinic, Martin-Luther-University, Halle-Wittenberg,
Germany, 2Faculty of Animal Science, Bogor Agriculture University, Indonesia
NORBERT MIELENZ, RONNY R. NOOR and LUTZ SCHÜLER
Estimation of Additive and Non-Additive Genetic Variances of Body Weight, Egg Weight and Egg Production for Quails (Coturnix coturnix japonica) with an Animal Model Analysis
Dedicated to Professor Dr. Gerhard Seeland on the occasion of his 65th birthday
Abstract
This study estimates the additive and non-additive variances for egg production and body weight traits of two lines of quails from a long-term selection with the help of the REML method. For the body weight of 42-day-old females (BW42f) and males (BW42m), a total of 7,934 records for line 1 and 7,214 records for line 2 from 21 generations were used in our analyses. Additionally, 1,717 records of females from line 1 and 1,671 records of females from line 2 contained information on their egg production at an age of 42 to 200 days (EN200), on the average egg weight for the first 11 weeks of their laying season (EW1), on the average egg weight from weeks 12 to 23 (EW2), and on their body weight at an age of 200 days (BW200f). A multivariate additive animal model and one-trait dominance models, which include the inbreeding coefficients as covariates, were fitted to the data. The estimates of the heritability gained from our dominance models were smaller than those from the additive model. For line 1, the heritability values decreased for EN200 from 0.35 to 0.32, for EW1 from 0.66 to 0.56, for BW200f from 0.42 to 0.38, and for BW200m from 0.51 to 0.49, respectively. For the first line, the respective ratio (d2) of the dominance variance to the phenotypic variance for EN200, EW1, BW200f and BW200m was
0.08, 0.22, 0.09 and 0.21, and the values for the second line were 0.12, 0.06, 0.001 and 0.23.
Key Words: dominance, Japanese quails, variance components
Zusammenfassung
Titel der Arbeit: Schätzung von additiver und nicht-additiver genetischer Varianz für Körpergewicht, Eigewicht und Eiproduktion der Wachtel (Coturnix coturnix japonica) mit Tiermodellen
In dieser Studie werden additive und nicht-additive Varianzen für die Eiproduktion und das Körpergewicht an zwei Selektionslinien der Wachtel mit Hilfe der REML-Methode geschätzt. Für das Körpergewicht der weiblichen (BW42f) und männlichen (BW42m) Tiere am 42. Lebenstag standen in Linie 1 bzw. 2 insgesamt 7934 bzw. 7214 Datensätze aus 21 Generationen für die Auswertungen zur Verfügung. Zusätzlich waren für die Eiproduktion zwischen Lebenstag 42 und 200 (EN200), für das mittlere Eigewicht der ersten 11 Wochen der Legeperiode (EW1), für das mittlere Eigewicht innerhalb Woche 12 und 23 (EW2) sowie für das Körpergewicht am 200. Lebenstag (BW200f) in Linie 1 bzw. 2 Leistungen von 1717 bzw. 1671 weiblichen Tieren vorhanden. Zur genetischen Auswertung wurden ein additives Mehrmerkmalsmodell und Einmerkmals-Dominanzmodelle, welche die Inzuchtkoeffizienten als Kovariable enthielten, angepasst. Die Schätzungen der Heritabilität aus den Dominanzmodellen waren geringer als jene geschätzt mit dem additiven Modell. Innerhalb Linie 1 verringerten sich die Schätzwerte für EN200 von 0.35 auf 0.32, für EW1 von 0.66 auf 0.56, für EW2 von 0.42 auf 0.38, für BW200f von 0.42 auf 0.38 und für BW200m von 0.51 auf 0.49. In Linie 1 wurden für das Verhältnis (d2) der
Dominanzvarianz zur phänotypischen Varianz für die Merkmale EN200, EW1, BW200f und BW200m Werte von 0.08, 0.22, 0.09 und 0.21 geschätzt während sich für Linie 2 Schätzungen von 0.12, 0.06, 0.001 und 0.23 ergaben.
1. Introduction
Non-additive genetic variation (dominance and epistasy) is an important source of heterosis for traits associated with growth and reproduction in crosses between animals from different populations and lines. Positive heterosis in crosses between divergent selected lines of Japanese quails has been observed not only for egg production but also for body weight and egg weight (MORITSU et al., 1997). Non-additive variation is mainly caused by dominance. There are several reasons why the dominance variance needs to be estimated; these include an unbiased estimation of heritability in a narrow sense, a more precise prediction of additive effects, and the usage of dominance effects through a crossbreeding or special mating strategy. Dominance influences all genetic parameters related to crossbreeding (WEI et al., 1991a, b; RÖHE et al., 2000). Based on HOESCHELE and VanRADEN’s algorithm (1991) for the direct generation of the inverse of the dominance relationship matrix, the estimation of dominance variance with REML methodology is now possible for large populations. The estimation of dominance variance has already been done for chickens, dairy cattle, beef cattle and swines (see WEI and VAN der WERF, 1993; MISZTAL et al., 1998). Some research results indicate that poultry egg production is influenced by dominance (FAIRFULL and GOWE, 1986). However, no such estimations have been reported yet for quails (Coturnix coturnix japonica).
The objective of this study is to estimate additive and dominance variances for egg production, egg weight and body weight of two lines of quails by using an animal model analysis.
2. Materials
From a base population of Japanese quails, we created two selection lines. The selection criterion for the first line was high body weight and small egg weight over 21 generations, while the criterion for the second line was high egg weight only. For each generation, 50% of the pairs were selected. For line 1, the selection was mainly based on an index that included the body weight of females at an age of 42 days (BW42f), the average egg weight for the first 11 weeks of the laying season (EW1), and the average egg weight from week 12 to week 23 (EW2). For line 2, the selection process was only based on the average of EW1 and EW2. The selected animals were mated and full and half-sib mating was avoided. From each selected parent pair, more than one female and male was generated.
From the first to the tenth generation, the lines consisted of 110 pairs (single paired mating), and for generations 11 to 20, the number of pairs was 80. The quails were kept in battery cages with three floors.
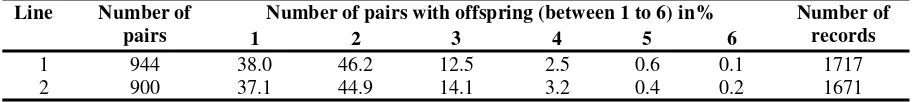
Table 1
Population structure of lines 1 and 2 (for all hens with an egg production of more than 30 eggs between an age of 42 to 200 days) (Populationsstruktur der beiden Linien)
Number of pairs with offspring (between 1 to 6) in% Line Number of
pairs 1 2 3 4 5 6
Number of records
1 944 38.0 46.2 12.5 2.5 0.6 0.1 1717 2 900 37.1 44.9 14.1 3.2 0.4 0.2 1671
structure of the parent pairs kept in cages. The number of pairs with offspring ranges from 1 to 6 in our lines. In total, 38.0% of the females in line 1 and 37.1% of the females in line 2 do not have any full-sisters with records in other cages. Since we included an average of two females per parent pair in our analysis, the estimation of the dominance variance is possible. Table 2 shows the descriptive statistics for all of our eight investigated traits. For the traits egg weight and egg number, table 2 contains only records for all those females that reached the end of the analysis period. The body weight of females and males at an age of 42 days and of 200 days was considered a different trait for the respective cases.
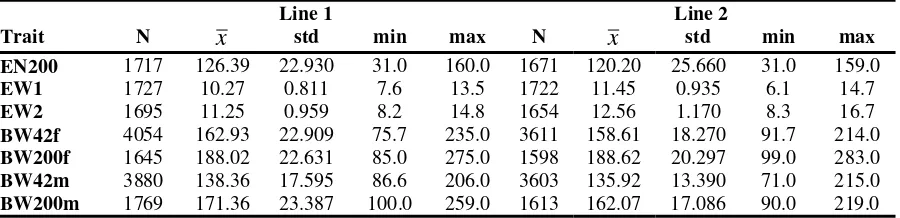
Table 2
Number of records (N), mean values (x), standard deviation (std), minimum and maximum value of traits measured for females and of body weight measured for females (f) and males (m) at the beginning and at the end of the laying period (Beschreibende Statistik)
Line 1 Line 2 BW200m 1769 171.36 23.387 100.0 259.0 1613 162.07 17.086 90.0 219.0
3. Models and Methods
The additive genetic parameters of all eight traits were estimated simultaneously, based on the following animal model for an individual record:
(1) yij = xij′βj +aij +eij
Here, yij is the record (trait) j of animal i; βj represents the vector of fixed effects with
xij relating the record on animal i to this vector; aij is the additive genetic; and eij is the
environmental effect of animal i. For the traits observed in cages, vector βj contains the
block (combined) effect of generation, floor and battery. On the other hand, vector βj
includes only the environmental effect of a generation for the body weight at an age of 42 days. The matrix representation of model (1) is:
(2) y= Xß+Za+e
In this formula, β is the vector of fixed effects (defined in model (1)), a is the vector of additive genetic animal effects, e is the vector of residual effects, and X and Z are matrices that relate records to their respective effects. The variance-covariance matrix associated with model (2) is given by:
(3) ⎟⎟
, with ⊗ as indication of the direct (Kronecker) product.
In (3), A is the additive genetic relationship matrix, Ga is the additive genetic and Re is
The dominance variances were estimated by using one-trait models for all seven traits. Since the inbreeding cannot be ignored in our data analysis, the following dominance model was used:
(4) y= Xß+Za+ZWf +Zb∆+e
Here, ∆ represents the coefficient of inbreeding depression, b is the vector of
inbreeding coefficients, and W is the incidence matrix in relation to the vector f of parental dominance effects. The variance-covariance matrices of the random effects in model (4) are:
F is the parental-dominance relationship matrix, andσa2,
2 additive, the parental-dominance, the dominance, and the residual variances, respectively (HÖSCHELE and VAN RADEN, 1991). The estimated variances and covariances in models (2) and (4) were obtained by using the REML-method of the VCE5.0 program (KOVAC et al., 2002).
Table 3
Additive genetic variance (σa2), environmental variance (
2
e
σ ) and heritability (h2) for lines 1 and 2, estimated with a multi-trait additive model (Additive Varianz, Umweltvarianz und Heritabilität geschätzt mit einem additiven Mehrmerkmalsmodell)
data from 9 generations of two selected quail lines. They found heritability estimates of 4-week body weight between 0.35 and 0.56 using pooled estimates from sire and dam components. Using animal model analysis and the REML-method, SAATCI et al. (2003) examined the heritability of weights during the hatching period and from week 1 to week 6, and reported values between 0.14 and 0.32. RESENDE et al. (2005) estimated the heritability of body weight based on a multi-trait animal model with additive genetic and maternal effects implementing Gibbs sampling methodology. The posterior means for the heritability were 0.33, 0.35, 0.36, 0.43 and 0.47 for the hatching day and an age of 7 days, of 14 days, of 21 days and of 28 days, respectively. The differences in heritability estimates might be attributed to our method of estimation, strains, environmental effects or a sampling error due to small data sets or sample sizes. For genetic evaluations in the studies of RESENDE et al. (2005), SAATCI et al. (2003) and VALI et al. (2005), records of 650, 1,108 and 3,520 animals were used, respectively.
In order to meet the requirements for the sample size, we used records of animals from 21 generations in our study and analyzed them simultaneously. For the body weight at an age of 42 days, a total of 7,934 records for line 1 and 7,214 records for line 2 were used in our analysis. The lines were under moderate pressure of selection over the generations. Therefore, we used the REML method for our estimation of the variance components. From a statistical point of view, this method can handle selected data and provide unbiased estimations of the genetic parameters of the unselected base population. REML yields unbiased estimators of the variances in the base population under the following ideal conditions: (a) the assumptions of the infinitesimal additive genetic model are valid, (b) there are complete pedigrees back to a base population of non-selected, non-related, and non-inbred animals, (c) and data on all candidates for selection are available (SCHAEFFER, et al., 1998). For a long-term selection, the standard assumptions of the infinitesimal model are no longer valid. Parental selection over 20 generations led to changes of allele frequencies, mainly for traits facing special pressure for selection. Thus, the smaller heritability estimates of EW1 and EW2 in line 1 (0.58 and 0. 41), compared to those from line 2 (0.66 and 0.53), result from the direct selection of egg weight in line 2. In contrast, the selection of high body weight in line 1 decreased the heritability of all body weight traits in this line in comparison to the values from line 2. The influence of the different selection criteria can be seen in the estimated genetic correlations of the two lines (Table 4). For certain combinations of traits, we found clear order relations between the genetic correlations of the lines. The genetic correlations between egg production and egg weight are negative in line 1 (-0.36 and -0.44) and near zero in line 2 (0.10 and 0.07). On the other hand, the genetic correlations between egg weight and body weight are positive and moderately high.
Consequently, the body weight of females and males at an age of 42 days should be treated differently in the genetic evaluation.
Table 4
Genetic correlations and their standard error for traits of line 1 (above the diagonal) and line 2 (below the diagonal), estimated with an additive model (Genetische Korrelationen und zugehörige Standardfehler für Linie1 oberhalb und für Linie 2 unterhalb der Diagonalen)
Trait EN200 EW1 EW2 BW42f BW200f BW42m BW200m
EN200 * -0.36±0.06 -0.44±0.07 0.07±0.04 -0.20±0.05 0.07±0.04 0.14±0.04 EW1 0.10±0.04 * 0.94±0.01 0.52±0.03 0.48±0.04 0.49±0.03 0.45±0.03
EW2 0.07±0.05 0.95±0.01 * 0.59±0.03 0.59±0.04 0.54±0.03 0.49±0.03
BW42f 0.39±0.04 0.21±0.03 0.30±0.04 * 0.74±0.04 0.84±0.02 0.71±0.04
BW200f 0.10±0.05 0.29±0.04 0.37±0.04 0.70±0.03 * 0.73±0.03 0.67±0.02 BW42m 0.12±0.04 0.28±0.03 0.35±0.04 0.76±0.02 0.71±0.03 * 0.79±0.02
BW200m -0.02±0.04 0.31±0.03 0.44±0.04 0.56±0.03 0.67±0.04 0.85±0.02 *
4.2 Non-Additive Genetic Parameters
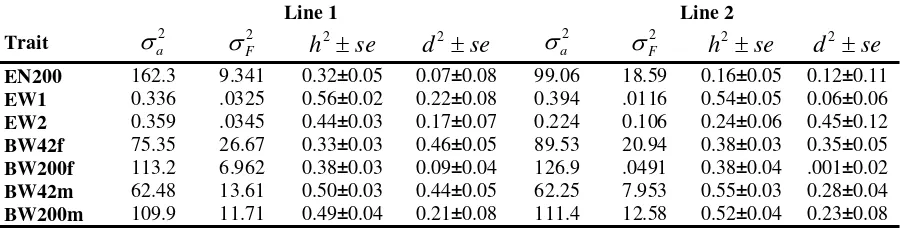
As expected, the estimated h2 values for lines 1 and 2 from dominance models were smaller than those from the additive model. The differences between the h2 estimates from additive and dominance models were higher for a larger parental dominance variance (Table 5). For example, in line 1, the estimates of the heritability decreased (0.35 to 0.32, 0.66 to 0.56, 0.53 to 0.44 and 0.47 to 0.33 for EN220, EW1, EW2 and BW42f, respectively). The results were in accordance with reports for the egg production trait for chickens (WEI and VAN der WERF, 1993; MIELENZ et al., 2003). The estimated additive variances and heritability values obtained with the dominance model are lower than those gained with the additive model (Tables 3 and 5). This is due to the extraction of the parental dominance variance from environmental and additive variances, which resulted in a decrease of these two estimates and kept the total variance almost unchanged in the dominance model. Larger parental dominance variance estimates were accompanied by larger differences between h2 estimates from additive and dominance models. According to WEI and VAN der WERF (1993), any resemblance between relatives is partly due to dominance effects. In an additive model, part of the resemblance between related animals due to dominance is contained in the estimated additive effects, resulting in an overestimation of additive variances.
Table 5
Additive genetic variance (σa2), parental dominance variance (
2
F
σ ), heritability (h2) and dominance ratio (d2), estimated with one-trait models (Additive Varianz, elterliche Dominanzvarianz, Heritabilität und Dominanz-verhältnisse, geschätzt mit Einmerkmalsmodellen)
Line 1 Line 2
Trait σa2 σF2 h2 ±se d2 ±se σa2 σF2 h2±se d2±se EN200 162.3 9.341 0.32±0.05 0.07±0.08 99.06 18.59 0.16±0.05 0.12±0.11 EW1 0.336 .0325 0.56±0.02 0.22±0.08 0.394 .0116 0.54±0.05 0.06±0.06 EW2 0.359 .0345 0.44±0.03 0.17±0.07 0.224 0.106 0.24±0.06 0.45±0.12
BW42f 75.35 26.67 0.33±0.03 0.46±0.05 89.53 20.94 0.38±0.03 0.35±0.05
BW200f 113.2 6.962 0.38±0.03 0.09±0.04 126.9 .0491 0.38±0.04 .001±0.02 BW42m 62.48 13.61 0.50±0.03 0.44±0.05 62.25 7.953 0.55±0.03 0.28±0.04 BW200m 109.9 11.71 0.49±0.04 0.21±0.08 111.4 12.58 0.52±0.04 0.23±0.08
the estimated d2 values varied from 0.17 to 0.22 in line 1 and from 0.06 to 0.45 in line 2. In comparison to similar studies with chickens, these values are strongly overestimated. The d2 value of 0.45 found for EW1 seems to be less likely. Since the highest standard error was calculated for this estimated value, the small sample size might be one explanation for the partial overestimation of dominance ratios of the egg weight trait. However, positive heterosis was observed in crosses between divergently selected lines of quails both for egg production and egg weight (MORITSU et al., 1997). Thus, it is reasonable to expect the existence of dominance variance for the egg weight as well.
Surprisingly, high estimates of d2 values were obtained for the body weight at an age of 42 days for both lines. The estimates of BW42f and BW42m were above 0.44 in line 1 and above 0.28 in line 2. This may be due to the fact that unknown environmental effects had an influence on the early growth rate of the quails. We have no knowledge of the exact circumstances and if all sibs were raised under the same environmental conditions and exposed to the same pathogens. The parental dominance effects might include uncorrelated full-sib or similar effects for traits measured before the quails were kept in cages (MISZTAL and BESBES, 2000). At an age of 42 days, pairs of quails were put into cages in a controlled environment. Since these quails were randomly distributed across cages, possible common environmental effects for full-sibs were ignored for traits measured at later stages in the life of these quails. A second explanation for the overestimation mentioned above may be the fact that the parental dominance variance includes maternal, common environmental and epistatic variances. Maternal effects for chickens have been shown to be important for their early body weight but not for their egg production (FAIRFULL and GROWE, 1986). And last but not least, a third reason might be the insufficient amount of data. Any estimation of the dominance variance requires much larger data sets than an estimation of the additive variance (MISZTAL et. al., 1995; MIELENZ and SCHÜLER, 2004). Additionally, the high d2 estimates for EW and BW may be due to the change of the allele frequencies caused by the selection of the egg weight over more than 20 generations. For our study, this leads to the conclusion that the dominance model should be used mainly to get a more precise estimation of heritability in a narrow sense. Due to missing information for the period of early growth, the genetic interpretation of the results for the body weight at an age of 42 days is less meaningful.
References
BRAH, G.S.; CHAUDHARY, M.L.; SANDHU, J.S.:
Direct and correlated responses to selection for 4-week body weight in two lines of Japanese quails. Arch. Tierz., Dummerstorf 44 (2001), 99-108
FAIRFULL, R.W.; GOWE, R.S.:
Use of breed resources for poultry egg and meat production. Proceedings of 3rd World Congr. Gent.
Appl. Livest. Prod. 10 (1986), 242-256
HOESCHELE, I.; VAN RADEN, P.M.:
Rapid inversion of dominance relationship matrices for noninbred populations by including sire by dam subclasses effects. J. Dairy Sci. 74 (1991), 557-569
KOVAC, M.; GROENEVELD, E.; GARCIA-CORTES, L.A.:
VCE-5 Package for the estimation of dispersion parameters. Proc. 7th WCGALP, Montpellier (2002) MIELENZ, N.; KOVAC, M.; GROENEVELD, E.; PREISINGER, R.; SCHMUTZ, M.; SCHÜLER, L.:
MIELENZ, N.; SCHÜLER, L.:
Stichprobenplanung zur Schätzung der Dominanzvarianz bei hierarchischer Halb- und Vollgeschwisterstruktur. Arch. Tierz., Dummerstorf. 47 (2004), 491-499
MISZTAL, I.; BESBES, B.:
Estimates of parental-dominance and full-sib permanent environment variances in laying hens. Animal Science 71 (2000), 421-426
MISZTAL, I.; VARONA, L.; CULBERTSON, M.; GENGLER, N.; BERTRAND, J.K.; MABRY, J.; LAWLOR, T.J.; VAN TASSELL, C.P.:
Studies on the value of incorporating effect of dominance in genetic evaluations of dairy cattle, beef cattle and swine. Proc. 6th WCGALP (1998) Armidale
MORITSU, Y.; NESTOR, K.E; NOBLE, D.O.; ANTHONY, N.B.; BACON, W.L.:
Divergent selection for body weight and yolk precursor in Coturnix coturnix japonica . 12. Heterosis in reciprocal crosses between divergently selected lines. Poultry. Sci. 76 (1997), 437-444
RESENDE, R.O.; MARTINS, E.N. ; GEORG, P.C.et al.:
Variance components for body weight in Japanese quails (Coturnix japonica). Rev. Bras. Cienc. Avic. 7
(2005), 23-25
RÖHE; R.; KRIETER, J.; PREISINGER, R.:
Bedeutung der Varianzkomponentenschätzung für die Zucht von landwirtschaftlichen Zuchttieren – Eine Übersicht. Arch. Tierz., Dummerstorf. 43 (2000), 523-534
SCHAEFFER, L.R.; SCHENKEL, F.S.; FRIES, L.A.:
Selection bias on animal model evaluation. Proc. 6th World Congr. Genet. Appl. Livest. Prod. 25
(1998), 501-508
STAACI, M.; DEWI, A.P.; AKSOY, A.R.:
Application of REML procedure to estimate the genetic parameters of weekly live weights in one-to-one sire and dam pedigree recorded Japanese quails. J. Anim. Breed.Genet. 129 (2003), 23-28
STRONG. C.F; NESTOR, K.E.; BACON, W.L.:
Inheritance of egg production, egg weight, body weight and certain plasma constituents in Coturnix. Poultry Sci. 57 (1978), 1-9
TOELLE, V.D.; HAVENSTEIN, G.B.; NESTOR, K.E.; HARVEY, W.R.:
Genetic and phenotypic relationships in Japanese quail. 1. Body weight, carcass and organ measurements. Poult. Sci. 70 (1991), 1679-1688
VALI, N.; EDRISS, M.A.; RAHMANI, H.R.:
Genetic Parameters of Body and Some Carcass Traits in Two Quail Strains. International Journal of Poultry Science 4 (2005), 296-300
WEI, M.; VAN der WERF, J.H.:
Animal model estimation of additive and dominance variances in egg production traits of poultry. J. Anim. Sci. 71 (1993), 57-65
WEI, M.; VAN der STEEN, H.A.M.; VAN der WEF, J.H.J.; BRASCAMP, E.W.:
Relationship between purebred and crossbred parameters. I. Variances and covariances under the one-locus model. J. Anim. Breed. Genet. 108 (1991a), 253-261
WEI, M.; VAN der WERF, J.H.J.; BRASCAMP, E.W.:
Relationship between purebred and crossbred parameters II. Genetic correlation between purebred and crossbred performance under the model with two loci. J. Anim. Breed. Genet. 108 (1991b), 262-269
Received: 2005-11-22
Accepted: 2006-02-21
Corresponding Author
Dr. NORBERT MIELENZ
Institut für Tierzucht und Tierhaltung mit Tierklinik der Martin-Luther-Universität Halle-Wittenberg Adam-Kuckhoff-Straße 35
06108 HALLE GERMANY
1Institute of Animal Breeding and Husbandry with Veterinary Clinic, Martin-Luther-University, Halle-Wittenberg,
Germany, 2Faculty of Animal Science, Bogor Agriculture University, Indonesia
NORBERT MIELENZ, RONNY R. NOOR and LUTZ SCHÜLER
Estimation of Additive and Non-Additive Genetic Variances of Body Weight, Egg Weight and Egg Production for Quails (Coturnix coturnix japonica) with an Animal Model Analysis
Dedicated to Professor Dr. Gerhard Seeland on the occasion of his 65th birthday
Abstract
This study estimates the additive and non-additive variances for egg production and body weight traits of two lines of quails from a long-term selection with the help of the REML method. For the body weight of 42-day-old females (BW42f) and males (BW42m), a total of 7,934 records for line 1 and 7,214 records for line 2 from 21 generations were used in our analyses. Additionally, 1,717 records of females from line 1 and 1,671 records of females from line 2 contained information on their egg production at an age of 42 to 200 days (EN200), on the average egg weight for the first 11 weeks of their laying season (EW1), on the average egg weight from weeks 12 to 23 (EW2), and on their body weight at an age of 200 days (BW200f). A multivariate additive animal model and one-trait dominance models, which include the inbreeding coefficients as covariates, were fitted to the data. The estimates of the heritability gained from our dominance models were smaller than those from the additive model. For line 1, the heritability values decreased for EN200 from 0.35 to 0.32, for EW1 from 0.66 to 0.56, for BW200f from 0.42 to 0.38, and for BW200m from 0.51 to 0.49, respectively. For the first line, the respective ratio (d2) of the dominance variance to the phenotypic variance for EN200, EW1, BW200f and BW200m was
0.08, 0.22, 0.09 and 0.21, and the values for the second line were 0.12, 0.06, 0.001 and 0.23.
Key Words: dominance, Japanese quails, variance components
Zusammenfassung
Titel der Arbeit: Schätzung von additiver und nicht-additiver genetischer Varianz für Körpergewicht, Eigewicht und Eiproduktion der Wachtel (Coturnix coturnix japonica) mit Tiermodellen
In dieser Studie werden additive und nicht-additive Varianzen für die Eiproduktion und das Körpergewicht an zwei Selektionslinien der Wachtel mit Hilfe der REML-Methode geschätzt. Für das Körpergewicht der weiblichen (BW42f) und männlichen (BW42m) Tiere am 42. Lebenstag standen in Linie 1 bzw. 2 insgesamt 7934 bzw. 7214 Datensätze aus 21 Generationen für die Auswertungen zur Verfügung. Zusätzlich waren für die Eiproduktion zwischen Lebenstag 42 und 200 (EN200), für das mittlere Eigewicht der ersten 11 Wochen der Legeperiode (EW1), für das mittlere Eigewicht innerhalb Woche 12 und 23 (EW2) sowie für das Körpergewicht am 200. Lebenstag (BW200f) in Linie 1 bzw. 2 Leistungen von 1717 bzw. 1671 weiblichen Tieren vorhanden. Zur genetischen Auswertung wurden ein additives Mehrmerkmalsmodell und Einmerkmals-Dominanzmodelle, welche die Inzuchtkoeffizienten als Kovariable enthielten, angepasst. Die Schätzungen der Heritabilität aus den Dominanzmodellen waren geringer als jene geschätzt mit dem additiven Modell. Innerhalb Linie 1 verringerten sich die Schätzwerte für EN200 von 0.35 auf 0.32, für EW1 von 0.66 auf 0.56, für EW2 von 0.42 auf 0.38, für BW200f von 0.42 auf 0.38 und für BW200m von 0.51 auf 0.49. In Linie 1 wurden für das Verhältnis (d2) der
Dominanzvarianz zur phänotypischen Varianz für die Merkmale EN200, EW1, BW200f und BW200m Werte von 0.08, 0.22, 0.09 und 0.21 geschätzt während sich für Linie 2 Schätzungen von 0.12, 0.06, 0.001 und 0.23 ergaben.