STUDY OF LA
IN EX
BOGOR
LAND SUITABILITY FOR PADDY F
X – MEGA RICE PROJECT (EMRP)
CENTRAL KALIMANTAN
(ZONE A, ZONE B, ZONE D)
INDA MERLIANA
GRADUATE SCHOOL
OR AGRICULTURAL UNIVERSITY
BOGOR
2011
Y FIELD
P),
STATEMENT
I, Inda Merliana hereby states that this thesis entitled :
STUDY OF LAND SUITABILITY FOR PADDY FIELD IN EX MEGA RICE PROJECT, (EMRP), CENTRAL KALIMANTAN (ZONE A, ZONE B, ZONE D)
Is a result of my own work under the supervision of advisory board during the period of February 2009 until March 2011 and that it has not been published ever. The content of this thesis has been examined by the advisory board and external examiner
Bogor, June 2011
ABSTRACT
Inda Merliana (2011). “Study of Land Suitability For Paddy Field In Ex – Mega Rice Project (EMRP), Central Kalimantan (Zone A, Zone B, Zone D)”. Under the supervision of YULI SUHARNOTO and SETIAHADI.
Land suitability are adaptability of land for the type of certain land use (crop type and crop management). It tends to emphasise the positive value of land. Mega Rice Project Area manifested from the desire to answer the challenges of an increasingly several agricultural development. The challenge are Rice self-sufficiency that we have achieved success in 1984 has ended in about 1993, to meet the needs of the national rice is needed 2 million tons imported a year (at the time). Otherwise, Rice fields in Java are either gradually decrease due to land conversion to non-agricultural areas are considered more favorable for development and economic growth. The objective of this research is to determine the development possibility of peatland for paddy field in research area by using Remote Sensing and Geographic Information System (GIS). Remote sensing used to classify landcover that used to determine land availability refers to Undang Undang No 26/2007 and Instruksi Presiden No 2/2007. Spatial analysis GIS used as the method which provide the spatial information on suitability and availability of land in research area. According to Spatial analysis GIS, most of the area that suitable and available for class “N1” followed by class “S1” and class “S3”.
ABSTRAK
Inda Merliana (2011). “Kesesuaian Lahan Untuk Pengembangan Padi sawah di Lahan Bekas Proyek Sejuta Lahan Gambut (Eks PLG), Kalimantan Tengah (Zona A, Zona B, Zona D)”. Dibawah bimbingan dari YULI SUHARNOTO and SETIAHADI.
Kesesuaian lahan adalah adaptasi lahan untuk tipe penggunaan lahan tertentu (jenis dan manajemen tanaman pangan). Kesesuaian lahan cenderung menekankan nilai lebih dari lahan. Lahan Bekas Proyek Sejuta Lahan Gambut diwujudkan dari keinginan untuk menjawab tantangan peningkatan pengembangan pertanian. Tantangannya adalah swasembada beras yang telah berhasil dicapai Pemerintah Indonesia pada tahun 1984 telah berakhir pada sekitar tahun 1993, untuk memenuhi kebutuhan beras nasional pada saat itu diperkirakan harus mengimpor sejumlah 2 ton beras setiap tahunnya. Sebaliknya, sawah di Pulau Jawa secara bertahap luasannya semakin berkurang karena alih fungsi lahan menjadi penggunaan non pertanian yang dianggap lebih menguntungkan bagi perkembangan dan pertumbuhan ekonomi. Tujuan dari penelitian ini adalah untuk menentukan kemungkinan pengembangan lahan gambut untuk sawah di lahan bekas proyek lahan sejuta hektar dengan menggunakan Remote Sensing dan Sistem Informasi Geografis (SIG). Penginderaan jauh digunakan untuk mengklasifikasikan tutupan lahan yang digunakan untuk menentukan ketersediaan lahan mengacu pada Undang Undang No 26 Tahun 2007 dan Instruksi Presiden No 2 Tahun 2007. Analisis spasial SIG digunakan sebagai metode yang berguna menyediakan informasi spasial tentang kesesuaian dan ketersediaan lahan di daerah penelitian. Berdasarkan hasil analisis spasial, sebagian besar kawasan yang sesuai dan tersedia adalah kelas kesesuaian "N1" diikuti dengan kelas kesesuaian "S1" dan "S3".
SUMMARY
Inda Merliana (2011). “Kesesuaian Lahan Untuk Pengembangan Padi sawah di Lahan Bekas Proyek Sejuta Lahan Gambut (Eks PLG), Kalimantan Tengah (Zona A, Zona B, Zona D)”. Under the supervision of YULI SUHARNOTO and SETIAHADI.
Land suitability are adaptability of land for the type of certain land use (crop type and crop management). Mega Rice Project Area manifested from the desire to answer the challenges of an increasingly several agricultural development. The challenge are Rice self-sufficiency that we have achieved success in 1984 has ended in about 1993, to meet the needs of the national rice is needed 2 million tons imported a year (at the time). Otherwise, Rice fields in Java are either gradually decrease due to land conversion to non-agricultural areas are considered more favorable for development and economic growth. To answer the challenges mentioned above, then the Government of Indonesia has established Central Kalimantan to developed as agricultural area, called Mega Rice Project. It was chosen with consideration of the land is still widely available, and the population are very rarely. Another reason that mades peatland in Central Kalimantan Province has choosen for this project is to save the cost of procurement of irrigation and printing fields, where peatlands have many naturally supply of water. To strengthen the determination of Central Kalimantan as Mega Rice Projects Area then they has released The Presidential Decree No. 82 of 1995 then completed with the Presidential Decree No. 83/1995 and Presidential Decree No. 74/1998.
Geographic Information System) in this research, expected to obtained an worthwhile result in approximating land suitability and land availability
The objective of this research is to determine the development possibility of peatland for paddy field in research area by using Remote Sensing and Geographic Information System (GIS). The results expected able to give the information concerning land suitability of peatland for possibility of development agricultural activity in research area and become the input for government in developing agricultural activities especially on developing paddy field commodity. Study area as a boundary of system in this research is Ex Mega Rice Project Area, which covered of three zone, there are Zone A, Zone B, and Zone D. The scope of this research was to determine the land that suitable for paddy field and also available according to the landcover map deliniated by UU No 26 Year 2007.
The data used in this research are Landsat TM Central Kalimantan image with path/row = 118/62), Topographic maps from BAKOSURTANAL, Geologic maps from “Bappeda of Central Kalimantan “, Soil maps from “Balai Besar Sumber Daya Lahan Pertanian”, Climate data and rainfall map from “Badan Meteorologi dan Geofisika (BMG)”.
From the landsat classification, to determine the availability of land, we have deliniated Cultivated and Protected Area. Cultivated areas such as agriculture, livestock, mixed garden, residential areas, and so on, while the protected areas included conservation areas are protected forest area, peatland areas, water catchment areas, the area around the lake or reservoir, the area around the springs, nature reserves, marine natural reserves and other wetlands, coastal mangrove forest, national park, forest, natural park, the area of cultural heritage and science, and areas prone to natural disasters. According to the Law No. 26 Year 2007, the protected area widely spread on Kahayan Hilir and Dusun Hilir sub district, its approximately 320.827,62 Hectares (52,78 %), and cultivated area is approximately 286.978,42 Hectares (47,22 %).
Copy right @ 2011, Bogor Agricultural University Copy right are protected by law,
1. It is prohibited to cite all or part of this thesis without referring to and mentioning the source:
a. Citation only permitted for the sake of education, research, scientific writing, report writing, critical writing, or reviewing scientific problems.
b. Citation does not inflict the name and honor of Bogor Agricultural University.
STUDY OF LAND SUITABILITY FOR PADDY FIELD
IN EX – MEGA RICE PROJECT (EMRP), CENTRAL KALIMANTAN (ZONE A, ZONE B, ZONE D)
INDA MERLIANA
A Thesis submitted for the Degree of Master of Science in Information Technology for Natural Resources Management Program Study
GRADUATE SCHOOL
BOGOR AGRICULTURAL UNIVERSITY
BOGOR
Research Title : Study of Land SuitabilityFor Paddy Field In Ex Mega Rice Project (EMRP), Central Kalimantan (Zone A, Zone B, Zone D)
Name : Inda Merliana
Student ID : G051060081
Study Program : Master of Science in Information Technology for Natural Resource Management
Approved by,
Advisory Board
Dr.Ir. Yuli Suharnoto M.Eng Dr. Ir Setia Hadi
Supervisor Co-Supervisor
Endorsed by,
Program Coordinator Dean of the Graduate School
Dr. Ir. Hartrisari Hardjomidjojo, DEA Dr. Ir. Dahrul Syah, M.Agr.Sc
Date of examination: Date of Graduation: 4 July, 2011
Praise and Gratitude the author pray toward the presence of God Almighty who has bestow His mercy and grace, so that she can completing this thesis. This thesis is one of the requirements to finish the study at the MIT Study Program in Bogor Agricultural University. This final settlement can not be separated from the support and encouragement and guidance from many parties. Therefore, in this occasion, the author would like to thank Mr. Yuli Suharnoto as supervisor who was pleased to his encouragement, valuable comment, suggestion in completing this research thesis and directing the author in this final task. The author also would like to express her special gratitude to her co-supervisor Dr. Ir. Setia Hadi for his encouragement, valuable comment and suggestion in completing this research thesis.
The special appreciation to author’s family; my father, Muhammad Engkos Kosasih, my mother, Lili Normasari (alm), my sister, Meta Sagita Arianda, and my brothers, Andhika Nanda Hudaya, Algi Ikhsan Falaqi and Eri Gustamal for their continued support, love, and encouragement throughout the period of study. Gratitude also goes to all MIT Lectures, all staff at MIT study program, and friends who have helped and encouraged the author in finishing her study in Bogor Agricultural University.
Last but not least, my best friend in Media Moderat, Bowo, Ulil, Apan, Opan, and Ojan, thanks for your support and cares during my study.
freelancer consultant, a University. At early 2 Bappeda of Banten Pr Master in Information T
CURRICULUM VITAE
Inda Merliana was born in Pandeglang, Bant on February, 2, 1984. She finished her Elem and High School in Government School, P received her bachelor degree from Pakua Major in Urban and Regional Planning, Facu in 2006. At 2007 – 2010 she has been t, and lecture assistant at Faculty of Techni y 2010 she have been worked as governm
Province until right now. In 2011 she finishe n Technology for Natural Resources Managem
anten, Indonesia ementary, Junior,
Pandeglang. She kuan University, culty of Technic n worked as a chnic in Pakuan nment officer in
i
II. LITERATURE REVIEW... 5
2.1 The Importance of Peatland ... 5
2.2 Why we have to exploit the Peatland for Agriculture ... 7
2.3 Potential and Management of Peatlands For Food Crops ... 9
2.4 Remote Sensing for Peatland ... 10
2.5 GIS for land suitability for agriculture ... 11
2.5.1 Geograpgic Information System(GIS) ... 11
2.5.2 Land Suitability ... 11
III. RESEARCH METHODOLOGY ... 17
3.1 Time and Location ... 17
IV. RESULTS AND DISCUSSION ... 27
4.1 Existing Land Cover ... 27
4.2 Landcover Deliniation ... 31
4.3 Feasibility Study For Paddy Field Based On Physical Aspect Criterion ... 34
ii V. CONCLUSIONS ... 53
iii
LIST OF TABLE
Page
1 Land Suitability Class For Paddy Field ... 12
2 Data Requirement... 19
3 Land Cover of Research Area ... 28
4 Land Class Suitability Based on Geologic Factor ... 36
5 Suitability Class Based on Landsystem in Research Area ... 39
6 Agricultural Activities Description in Research Area Based On Oldeman Classification ... 44
7 Land Suitability Based on Climate Classification on Several Rainfall Station in Research Area ... 45
iv
LIST OF FIGURE
Page
1 Research Area (EMRP Zone A, Zone B, Zone D) ... 17
2 Methodology. ... 22
3 Supervised Classification Procedure Diagram. ... 23
4 Percentage of Landcover Type in Research Area ... 30
5 Existing Landcover in Research Area ... 31
6 Landcover Deliniation Map in Research Area ... 32
7 Landcover Deliniation in Research Area ... 33
8 Land Available Map in Research Area ... 34
9 Geologic Map in Research Area ... 36
10 Land System Map in Research Area ... 38
11 Elevation Map in Research Area... 43
12 Rainfall Map in Research Area ... 46
13 Peat Depth Map in Research Area ... 48
14 Land Suitability Class Map in Research Area ... 50
v
LIST OF APPENDICES
1
I. INTRODUCTION
1.1 Background
Peatland are wetland ecosystem distinguished by height accumulate of the organic substance with low decomposition. Tropical peatland covered area about
40 million hectare and 50 percent of them are located in Indonesia. According to Radjagukguk (1993), the spread of peatland estimated equal to 20.1 million hectare. While other source mention the wide of peatland area in Indonesia is about 20.6 million hectare or about 10.8 percentage of wide Indonesia continent. Peatland area in Indonesia are widely spread in Sumatera (4,6 million hectare), Kalimantan (3,5 million hectare), and Papua (8,7 million hectare).
In Central Kalimantan , peatland area about 3,010,640 Hectare are found in alongside coastal between regional boundary of West Kotawaringin Regency until estuary of River Barito which extend up at hinterland, as long as great river Mentaya, Katingan, Sebangau, Kahayan And Kapuas until region of Hulu Sungai Utara Regency, South Kalimantan.
Ex Mega Rice Project Area is located in Central Kalimantan, covering a stretch of the west side of the border with Sebangau River, on the east by Barito River, on the south side adjacent to Java Sea and bounded north side of the demarcation line of the north line of primary channel master (SPI) which connects the rivers Sebangau, Kahayan, Kapuas, and Barito.
2
services, hinterland, etc.); Irrigation infrastructure development and printing fields in upland area in the conventional to the expansion of rice area is very expensive; and Rice cultivation no longer provides a strong appeal to farmers who prefer to cultivate other crops that provide higher profit (Notohadiprawiro, 1998)
To answer the challenges mentioned above, then the Government of Indonesia has established Central Kalimantan to developed as agricultural area, called Mega Rice Project. It was chosen with consideration of the land is still widely available, and the population are very rarely. As a comparison, the average population density of Central Kalimantan is 11 persons per square kilometers, Java Island reached 900 per square kilometers (BPS, 1996) with the assumption that within two years the land is ready to produce paddy rice equivalent to 2 tons per hectare per years, the land area required is a million acres to replace imported as many as 2 million tons a year.
Another reason that mades peatland in Central Kalimantan Province has choosen for this project is to save the cost of procurement of irrigation and printing fields, where peatlands have many naturally supply of water. To strengthen the determination of Central Kalimantan as Mega Rice Projects Area then they has released The Presidential Decree No. 82 of 1995 then completed with the Presidential Decree No. 83/1995 and Presidential Decree No. 74/1998.
Mega Rice Project starting in 1996 and in the period 1996-1997 has been made the primary channel master (SPI) along the 187 kilometers that connects Kahayan and Barito River. In addition it has also made the Main Line Primary (SPU) along 958.18 kilometers in Block A, B, C, and D. In Block A secondary channel creation, the collector channels, the primary channel and tertiary channel was completed, so that in Block A scored approximately 30,000 hectares of wetland, before it finally stopped in 1999 under Presidential Decree No 80 of 1998.
3 characteristic is needed. As we know, the physical aspect is the factor that most affects the land suitability in the study area. In this research, land suitability analysis for peatland according characteristic has its own are done with combine the Remote Sensing Technology and Geographic Information System (GIS). Remote Sensing Technology are very useful in obtain the information about an object or several objects on earth within require the direct contact to the object or study area. Information yielded from the use of this technology in land suitability at research area (Ex-Mega Rice Project which administratively located in some area of Kapuas Regency, and some area of South Barito Regency) are information such as deliniation area which area contain of peatland and which is not a peatland (to limited the study area), peat deepness, nature of land physical and rock which has one of the other criteria in accessed the land suitability for agriculture especially for paddy field. While Geographic Information System are system organized from hardware, software, geographical data and personnel designed efficiently to obtain, stored, updating, manipulation, analyzing, and presenting all information form which has geographical references. According to its function, applying GIS in this research will be easier and faster in analyze the potency and constraint from physical aspect of peatland to develop as agricultural farm in Ex Mega Rice Project. Data analysis presented with this GIS conducted by overlaying several aspect of physical base becoming criterion in determining land suitability for agriculture especially for paddy field. With combined two kind of technology (Remote Sensing and Geographic Information System) in this research, expected to obtained an worthwhile result in approximating land suitability of peatland.
1.2 Objectives
4
developing agricultural activities especially on developing paddy field commodity.
1.3 Scope and Limitation
The scopes and limitation of this research are:
a. Study area as a boundary of system in this research is Ex Mega Rice Project Area, which covered of three zone, there are Zone A, Zone B, and Zone D. The scope of this research was to determine the land that suitable for paddy field and also available according to the landcover map deliniated by UU No 26 Year 2007.
5 II. LITERATURE REVIEW
2.1 The Importance of Peatland
Peat deposits are formed from the remains of plants that have died, either
has been weathered or not. Pile continues to grow because the process
decomposition inhibited by anaerobic conditions or other environmental
conditions. The low level of development of decomposing biota. Peat soil
formation is a process of soil formation that geogenic caused by the deposition
process and transport, in contrast to the process formation of mineral soil which is
generally a pedogenic process (Hardjowigeno, 1986 in Subiksa, 2008). In general,
the classification of soil, peat soils are known as Organosol or Histosols are soils
having a layer of organic material with density (BD) in humid conditions < 0.1 g
cm-3 with a thickness > 60 cm or organic layer with BD > 0.1 g cm-3 with a
thickness > 40 cm (Subiksa, 2008). Peat is classified according to various
different points of view; level of maturity, depth, fertility and the position
formation. Based on the maturity level grade is divided into:
• Peat Sapric (mature peat) is decaying peat that has been further decay and native materials are not recognizable, coloured dark brown to black, and
when crushed, the fiber content reached < 15 %.
• Peat hemic (half mature peat) is a peat half rotted, some original material is still recognizable, coloured brown, and when crushed fiber materials
reached 15 – 75 %.
• Fibric Peat (raw peat) is the peat that has not decay, the material is still recognizable origin, coloured brown, and when crushed > 75% fiber content
remaining.
Based on the level of fertility grade is divided into three categories. There
are :
• Eutrophic peat is a fertile peat rich material minerals and bases as well as other nutrients. Peat is relatively fertile peat are usually thin and are
6
• Mesotrophic peat is have less fertile because it has content minerals and moderate bases.
• Oligotrophic peat is peat infertile because of poor mineral and bases. The dome of peat and peat thickness which far from
influence of rivers mud is usually classified as oligotrophic.
Peat in Indonesia is largely classified as peat mesotrophic and oligotrophic
(Radjagukguk, 1997 in Subiksa, 2008). Peat eutrofik in Indonesia just a few and
generally spread in coastal areas and along the river flow. Based on its formation
environment, peat is distinguished by :
• Ombrogen peat is peat formed in an environment only influenced by rain water.
• Topogen peat is peat formed in an environment that has enrichment tide. Thus the peat topogen will be more rich in minerals and more fertile than
the peat ombrogen.
While according to the depth of peat can be divided into shallow peat
(50-100 cm), medium peat ((50-100-200 cm), deep peat (200-300 cm), and very deep peat
(> 300 cm).
Peatland on Indonesia estimated approximately 20,6 million hectare. Widely
spread of peatland give the meaning necessary for global custody ecosystem
because about 50 percent from world tropical peatland, about 40 million hectare
reside in the Indonesia area. But, in this time condition of forest and peatland in
Sumatra and Kalimantan are continuously decrease.
That its true, peatland has some important value both for having the
character of extractive and also non extractive. As extractive material, peatland
can be exploited as the resource, peat ash serve the purpose of fertilize, taken by
humat acid, media plant, substance for the reclamation of dry farming. Upon
which the non extractive, peat function as habitat of supporter of involving
variety, that is as forestry farm, plantation and agriculture. Beside that, because
its ability to store the water are very big which can reach 90 percent and its
volume hence the peatland function as hidrologycal system for its surrounding
area which is prevent floods in the rains, supply the water in dry season and
7 important in its utilization foragriculture include water content, volume capacity
(bulk density, BD), the bearing capacity, subsidence, and irriversible drying.
Peat soil water content ranged from 100 – 1300 % of dry weight
(Muttalib et al., 1991 in Subiksa, 2008). This means that the peat can absorb water
up to 13 times weight. Thus, to some extent, peat dome could drain water to the
area around it. High water content cause BD to be low, peat becomes flabby and
low holding power. Bulk density the top layer of peat varies between 0.1 to 0.2 g
cm-3 depending on the level decomposition. Peat fibrik are generally located on the bottom layer has a bulk density lower than 0.1 g/cm3, but coastal peat and peat
in the path of the river flow can have bulk density > 0.2 g cm-3 (Tie and Lim, 1991 in Subiksa, 2008) because of the influence of soil minerals.
Forest peatland in Indonesia has huge value in socio economic aspect. As
food source, construction material and drinking water, peatland give the living for
society. Otherwise, Naturally peatlands have a low fertility rate because low of
hara materials and contain some organic acids which can be toxic to plants.
However, those acids is an active part of the soil that determines the ability of peat
to hold nutrients. Characteristics of organic acids will determine the
chemical characteristic of peat.
To reduce the adverse effect of organic acids that toxicity to the plants, can
be performed by adding ingredients that contain a lot of cations polyvalent such as
Fe, Al, Cu and Zn. Cations form the bond coordination with the organic ligands
form a complex compound / chelate. Therefore the materials containing
polyvalent cations can be used as an ingredient amelioran peat (Sabiham et al.,
1997 in Subiksa, 2008).
2.2 Why we have to Exploit the Peatland area for Agriculture?
. Peatland with its largely wide has a big potency to support food requirement
and to overcome the population density which continously growth. As mention
above, peatland can substitute the agricultural farm in Java Island which has been
decrease because has experiencing in land conversion to the industrial or
8
Land use change on Java, Bali and Madura from agricultural use to
non-agricultural use (industrial, residential, infrastructure, recreation) have reached
40.000 hectare per year. There are also land degradation, reduction in quantity and
quality of water for life, besides the occurrence of floods and droughts. The other
side, growth population in Indonesia are quite high, above 1,6 percent or about
three million people per year. Those situation make the development of peatland
become an important to overcome the insufficiently of food. However, the
developing peatland for agriculture has face many constraint because its
characteristic own by peatland itself. Mostly, tropical peatland have the character
of very acid by pH between 3,5 - 4 (Suhardjo and Adhi, 1976 in Adhi, 1986).
Peatland also have element of hara NPK which relatively low and deficiency
micro element such as Cu, Bo, Mn, dan Zn.
Peatland also can be decrease in surface ground after drainage, having low
endurance and nature of dwindle unreturn causing downhill water retention
energy and make sensitive to erosion. Another facts which must be considered are
there are potential different on each peatland. For example, peatland in ebb area
by the sea having natural fertility better relatively than land of peat hinterland,
because basa influence which implied contain on sea water. Water various quality
from major river which take sedimentation from hinterland also caused the land
quality fertilitation of peatland in many area are different. Peatland can be
productive if the soil are not too acid or thick attenuate (<50 cm), or if its peatland
have a great current of basa.
Peatland owning best potency for the development of agriculture farm is "
valley peats". This peat have the better potency in comparison with " basin peats"
because valley peat generally in the form of topogen organic peat which mouldy
substance and classified as Troposaprists or Tropohemists. Thick progressively
peat, less progressively its potency for the agriculture. Deeply peat > 3m)
generally less of hara. But generally, deeply peat not opened or not exploited for
the agriculture, because it will cause serious problems which enough heavily in
9 2.3 Potential and Management of Peatlands For Food Crops
According to Subiksa (2008) peatlands which can be used for food crops
recommended on shallow peat (<100 cm). Primary consideration is shallow peat
has a relatively higher fertility rates and have lower environmental risk than deep
peat. Peatlands with a depth of 1,4 to 2 m classified as marginal (suitability class
S3) for various kinds of crops.
Marginal land in Indonesia found in both wetlands and dry land. The form
of peat wetlands, land acid sulfate and the tidal area of 24 million ha, while upland
dry included ultisol reached 47.5 million ha of land and oxisol reached 18 million
ha (Suprapto, 2003 in Yuwono, 2009). Millions of hectares marginal lands are
scattered in several island, the prospect was good for development in agriculture
but it has not managed well. These lands has low fertility, so it necessary
innovation in technology to fix the productivity.
Food crop cultivation in peatlands have to implement water management
technology, match with the characteristics of peat and plant species. The function
of drainage is to remove excess water, creating conditions for respiratory
unsaturated plant roots, and wash some organic acids. The shorter the interval /
distance between the drainage ditch the higher crop yields. Although drainage is
important for plant growth, but increasingly in the drainage channel will
increasing the rate of subsidence and peat decomposition.
The management waterworks in the area of peat faces two conflicting
desires. First, desire to get rid of water (drainage) to lower the water level for the
process of maturation and soil leaching and the desire to keep the water level in
order to maintain soil moisture and provide water supply (irrigation). Fluctuation
of water level in rivers and channels due to tidal movement, as well as fluctuations
in rainfall, the process of managing the water system in a swamp area becomes
very complicated.
Water managements in peatland area influenced also by the hydraulic
conditions boundary, such as the movement of rivers include tidal fluctuations,
water level fluctuation due to the influence of season (rainy season and dry
10
Tidal elevation compare with the elevation of land (hidrotopography) will
largely determine the spatial pattern of the water. Water level movement on the
coast is strongly influenced by tides. In areas near the estuary, changes in water
surface elevation was determined by the tides . In the area in the upper estuary, the
transition area between the regions tidal and non tidal area, water surface
elevation changes not only affected by the tides but also affected by discharge
coming from upstream. On the upstream side of the river which is not influenced
by tides, changes in water elevation is determined by the upstream river discharge.
As we know, there are four categories hydrotopography, there are swamps
overflow type A, B, C and D. Viewed from the aspect of irrigation, the overflow
swamp type A and B is the swamp with the potential to be developed for the
purpose of cultivating rice that requires drainage, but this area has a limitation in
the process of disposal of drainage due to limited time during a low tide only.
While from the aspect of drainage, peatland type C and D will be easier to
get rid of stagnant water, simplifying the process of land development. However,
if there excessive, will decrease the nutrients that eventually the land will become
unproductive.
2.4 Remote Sensing for Peatland
Remote sensing is the science and art of obtaining information about an
object, area, or phenomenon through the analysis of data required by a device that
is not in contact with the object, area or phenomenon under investigation. Satellite
based system can now measure phenomenon that change continously over time
and cover large, often inaccesible areas (Aronoff, 1991). System of data
acquirement in remote sensing consisted of (1) energy, (2) object, (3) process, and
(4) output. Energy which is mostly used is electromagnetic energy steming from
solar energy and from radiation object on the global coverage of earth resources.
The data as a result of recording the earth surface called with image. Landsat
(Land Satellite) image is one of the resource satellite which obtain multispectral
image. This satellite belongs to United States which is first time launched in 1972
called ERST-1. Then it is continue to launched the second satellite named
Landsat-11 5). Landsat TM ( Land Satellite Thematic Mapper) is earth resource satellite of
second generation representing completion from first satellite Landsat generation.
this Satellite excellence lay in channel amount used as much 7 channel (band)
ranging from the visible blue to the thermal infrared. The TM Sensor also
provides a higher spatial resolution; each pixel represents a 30 m by 30 m ground
area (except in the case of band 6 which uses a larger 120 m by 120 m in pixel).
Landsat imagery are now widely used for many applications. In this research, the
landsat image was used to obtain the land cover and land use accurately which is
used in analyze the land suitability for paddy field area in Ex Mega Rice Project.
2.5 GIS in Land Suitability for Agriculture 2.5.1Geographic Information System
Geographic Information System (GIS) is a computer-assisted system for the
acquisition, storage, analysis and display of geographic data. It gives information
about what kind of object and where is the object placed on the earth’s surface.
Therefore, GIS need input data to develop or generate the information. According
to Aronoff (1991), there are five types of data entry system commonly used in
GIS; keyboard entry, coordinate geometry, manual digitizing, scanning and the
input of existing digital files. To get spatial data, it can use three methods :
digitizing, scanning and importing satellite imagery. The data in GIS divided into
two types : spatial data and attribute (non spatial data). The spatial data represent
geographic location of features. Point, line and areas were used to represent
geographic location like a street, a lake, and a forest stand. Non spatial data
provide descriptive information like name of an area, wide of an area, etc.
2.5.2Land Suitability
One of the other factor in managing or labouring land for the agriculture is
land suitability. Considering that peatland represent the fragile land, then to
exploit the peatland to the effort agriculture, then its need the research about land
suitability. Land suitability are adaptability of land for the type of certain land use
12
Land quality represent the nature or complex attribute from a land. Each
land quality have the certain performance having an effect to its suitability for
certain use. According to Adhi (1988), factors influencing peat potency for the
agriculture are thickness of peat geology, composition of crop peat compiler,
mount the maturity, circumstance of coat mineral substance below/under
measurable peat existing. Land quality can be measure directly in the field, but
generally specified from congeniality of land characteristic. While land
characteristic is the nature of land which can be measured, like ramp, rainfall, and
land texture. Quality and Land Characteristic used in criterion according to land
suitability for paddy field can be seen on this following tables (Table 1)
Table 1
Land Suitability Class for Paddy Field
No Parameter Symbol Suitability Class
S1 S2 S3 N1 N2 Phyrit deepness 75-100cm 50-75cm 25-50cm < 25cm
5 Slope T < 3% < 3% 3-5% 5-8% 6 Elevation
H <500 m 500-750 m 750-1000
13
No Parameter Symbol Suitability Class
S1 S2 S3 N1 N2 7 Agroclimate
Zone (Oldeman) C A1,A2,B1 ,B2
decomposition K Saprik, hemik Source : Hardjowigeno in Hardjowigeno and Widiatmaka (2007)
• Climate
There are two component of climate affected to land suitability : temperature
and rainfall. For land suitability purposed, the rainfall usually expressed in
number annual rainfall, amount the dry season and wet season. Oldeman
(1975) grouping region base on amount of wet and dry season succesively.
Wet season having rainfall > 200 mm, while the dry season have the rainfall
< 100 mm. This criterion more suited for food crop, especially for the
paddy. Base on the criterion, Oldeman (1975) dividing agroclimate zone into
14
• Ground deepness
Ground effective deepness is ground deepness which is both for growth
grow on the crop, that is come up with the coat which cannot be penetrated
by crop root. The coat can be in the form of the contact lithik, ledge coat
ossify the, hard ledge, brittle ledge. Ground effective deepness classified as :
K0 = deep (50-75 cm)
K1 = moderate (25 – 50 cm)
K2 = shallow (10 – 25 cm)
K3 = very shallow (<10 cm)
• Land Texture
Land texture represent the smooth ground particle composition (2 mm
diameter) that is sand, dust and clay. Land texture influence the land
capacities to detain the water and land permeability and also various nature
of physical and other land chemistry.
• Drainage
Drainage can be classified as following :
D0 = abundant ( excessively drained); abundant water immediately go out
from land/ground and land/ground will only detain a few/little water
so that crop will immediately experience of the insuffiency irrigate.
D1 = good; land own the air circulation (good aeration). From top to
bottom land/ground profile > 150 uniform bold cm chromatic and
there are not rustiness ( pock yellow, chocolate or grey)
D2 = rather good; land have aeration either in root area. There are not pock
of yellow, grey or brown at flake and substratum tabletop ( until
about 60 cm from land/ground surface)
D3 = rather bad; underside of good land; There are not pock of chromatic
yellow, grey or brown. Pock of entire/all undercarriage coat ( about
15 D4 = bad; flake underside ( near by surface) there are pock of brown, grey
and yellow.
D5 = very bad; entire/all coat until grey chromatic land/ground surface and
grey chromatic substratum land or there are blue chromatic pock, or
there are water suffusing on the surface of land during old ones so
that pursue the crop growth.
• Flood danger
Flood danger can be classified as following :
O0 = never been flooded (land never been flooded at one year period during
> 24 hour)
O1 = sometimes flooded happened during > 24 hour and it happen
unregularly in less than two month period
O3 = during < 7 month in a year land have been flooded for > 24 hour
O4 = during < 7 month land always be flooded for > 24 hour
• Salinity
Land salinity expressed in dissolve salt content or resistance of electrics of
land/ground.
• Acidity
17 III. RESEARCH METHODOLOGY
3.1 Time and Location
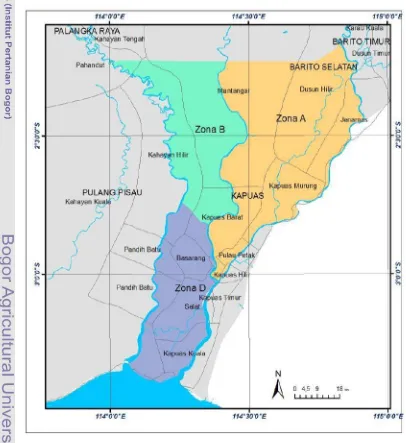
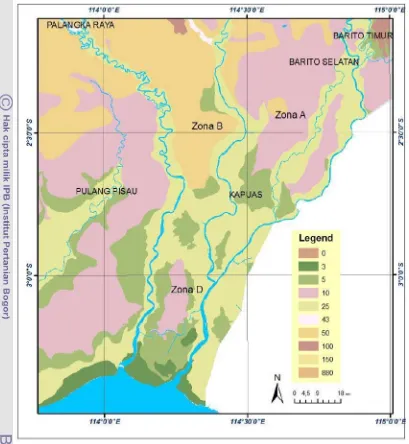
This research is conducted at MIT (Master of Science in Information Technology) research laboratory, SEAMEO BIOTROP, Bogor Agricultural University, Bogor. For the purpose of this research, the area of interest located at Ex-Mega Rice Project Area (covered 3 zone : zone A, zone B, and zone D) which is administratively inclusive into South of Kapuas District and South Barito District, Central Kalimantan.
18
3.2 Research Area
The research is focused on land suitability for agricultural purpose especially
for paddy field in peatland area in Ex – Mega Rice Project at South Kapuas Regency, and South Barito Regency, Central Kalimantan using some remotely sensed data and GIS spatial analysis methods. As mention above, research area covered three zone : Zone A (309.946,51 hectares) consist of 8 sub district there are Mantangai, Jenamas, Pulau Petak, Kapuas Murung, Kapuas Barat, Kapuas Hilir, Dusun Timur, and Dusun Hilir; Zone B (158.031,09 hectares) consist of 4 sub district, there are Pahandut, Kapuas Barat, Mantangai and Kahayan Hilir; and Zone D (139.865,55 hectares) consist of 10 sub district, there are Kahayan Hilir, Kapuas Barat, Pulau Petak, Basarang, Kapuas Hilir, Kapuas Timur, Maliku, Pandih Batu, Selat and Kapuas Kuala.
3.3 Required Tools
Some supporting hardware and software will be employed to accomplish this research are :
• Windows 7, 32-bit Operating System run on Personal Computer and Notebook 2 GB RAM on AMD Athlon (tm) Neo X2 Dual Core Processor
1,60 GHz with discrete graphics 512 MB and Color Printer
• ER Mapper 6.4
This software is used for image data collecting, capturing, processing and analyzing the satellite image.
• ArcGIS 9.2
This software is used for spatial data collecting, capturing, processing and analyzing the spatial data.
3.4 Data Sources
The data used in this research are Landsat TM Central Kalimantan image
19 Meteorologi dan Geofisika (BMG)”. The requirement data has been used in this
research, consist of three kind of data, there are :
Table 2. Data Requirement
Raster Data
Resolution Source of Data
1 Landsat TM October, 2005 Vis 30 m BAKOSURTANAL
Vector Data
1 Base Map 1:50.000 Bappeda of Central
Kalimantan
3 Geologic Map 1: 50.000 Bappeda of Central
Kalimantan Province 4 RePPProT
Map
1: 250.000 Balai Besar Sumber Daya Lahan
Pertanian, Bogor
Non Spatial Data
No Data Type Date Production Source of Data
20
3.5 Methods
The first thing to determine the suitability of land in research area is deal
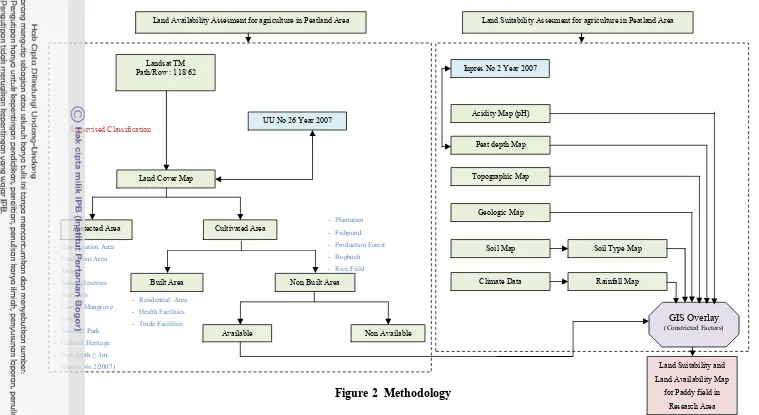
with data preparation and processing. To limitation the boundary area that avalilable to develop as paddy field, we have to obtain landcover map which show the protected area and non protected area (cultivated area), we have to classified the land cover classification from the landsat data. This process was done using supervised classification technique to transform multisppectral image data into thematic information classes/several types of land cover. In this research, types of land cover are classified into 11 classes. After done with the classification, the next step is deliniated land cover map based on UU No. 26 Year 2007 where divided into two area, protected area and cultivated area.
The protected area is the region with the primary function of protecting the environmental sustainability covering natural resources and man-made resources. Protected areas can be protected forest area, peatland areas, water catchment areas, the area around the lake or reservoir, the area around the springs, nature reserves, marine natural reserves and other wetlands, coastal mangrove forest, national park, forest, natural park, the area of cultural heritage and science, and areas prone to natural disasters. While the cultivated area is the area defined by the main function to be cultivated on the basis of the condition and potential of natural resources, human and artificial resources in order to make it more useful and provide the results to human needs. Cultivated area divided into two zone or area, built area (residential area, health facilities, trade facilities, industries, etc) and non built area (farm, plantation, fishpond, production forest, bog bush,
bareland, etc). To assesment the availability area to developed as paddy field and more action in the next overlay process, then the second area is subdivided into
two other areas are available and non available area. The area which available for developed was the area that not used for any purpose or idle area, such as bareland, groove or bog bush. And not available ones was the area that has been used for certain purpose and legally licensed. The available area will be next used in overlay process to get the suitability of paddy field.
21 in spatial analysis process. In this study, the interpolation result has been obtained from EMRP Master Plan Study (Bappeda Central Kalimantan Province). Rainfall
map was generated from GIS process using thiessen polygon on climate data in nine rainfall station of research area taken from “Badan Meteorologi dan Geofisika”.
Geologic map of research area was generated from digitized process which was obtain from Bappeda of Central Kalimantan Province. Digitizing process was done using ArcGIS 9.2 and the result was used for next spatial analysis process. Soil type data was obtained from “Balai Besar Sumberdaya Lahan Pertanian” was a paper map. This paper map has to be digitized to obtain the digital format type of data. This vector data can be used in spatial analysis process.
22 Land Suitability Assesment for agriculture in Peatland Area
Peat depth Map UU No 26 Year 2007
Inpres No 2 Year 2007
Acidity Map (pH)
Land Availability Assesment for agriculture in Peatland Area
23 3.5.1 Land Cover Map
In order to deliniate the research area related to which area are used for
conservation and non conservation (development area), then the land cover data is needed. To obtain this data, we have to classified the land cover classification from the landsat data. This process was done using supervised classification technique to transform multisppectral image data into thematic information classes/several types of land cover. In this research, types of land cover are classified into 11 classes.
Supervised classification is one of two methods used to transform multispectral image data into thematic information classes. In supervised classification, the identity and location of feature classes or cover types are known beforehand through field work, analysis of aerial photographs or other means. A simplified procedure for performing a supervised classification is as follows (Figure 3) :
Figure 3 Supervised Classification Procedure Diagram
24
To delineate which regions including cultivation and non-cultivated areas (conservation areas), then the classification of research area which we have
before, has to be overlay with Law Number 26 of 2007 concerning Spatial Planning.
3.5.2 GIS Operation
• Peatdepth Map
To obtain the spread of peatdepth in research area, peat depth data have to be interpolated to obtain peatdepth map. This peat depth map, can be used in spatial analysis process. In this study, the interpolation result has been obtained from EMRP Master Plan Study (Bappeda Central Kalimantan Province). Then to classify the peatdepth, we have to compare with Presidential Instruction Number 2 Year 2007 concerning Acceleration of Rehabilitation and Revitalization Peat Land Development Area.
• Generate Rainfall Map
25
• Digitize Soil Map
Soil type data that was obtained from “Balai Besar Sumber Daya Lahan Pertanian” was a paper map. This paper map has to be digitized to obtain the digital format type of data. This vector data can be used in spatial analysis process.
• Digitized Geologic/Lithologic Map
27 IV. RESULT AND DISCUSSION
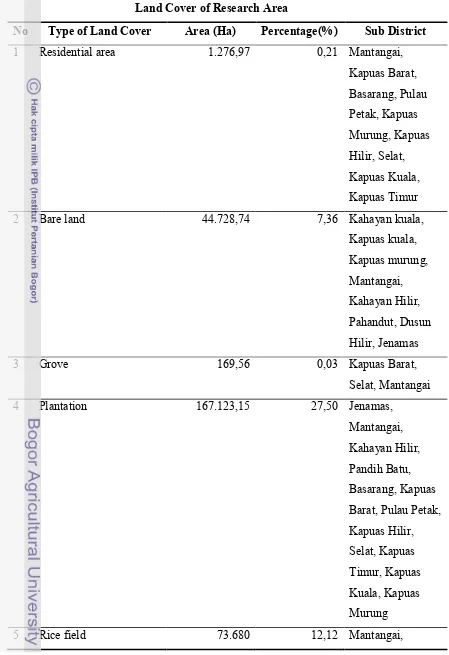
4.1 Existing Land Cover
Land cover map was obtained by interpretation Landsat imagery of 2005
using supervised classification method. The land cover research area (Zone A,
Zone B, and Zone D) consist of 11 classes, there are residential area, grove,
plantation, rice field, bog bush, bare land, primary mangrove forest, primary
swamp forest, secondary swamp forest, swamp, and water body.
According to Table 4.1, land cover in research area are mostly covered by
plantation, it is approximately 167.123,15 hectare (27,50%) followed by bog bush
that have an area about 155.310,50 hectare (25,55%), secondary swamp forest
(12,29%), rice field (12,12%), waterbody (8,96%), bareland (7,36%), primary
swamp forest (4,25%), swamp (1,16%), primary mangrove forest (0,58%),
residential area (0,21%) and bush (0,03%).
Residential area are spread on Mantangai, Kapuas Barat, Basarang, Pulau
Petak, Kapuas Murung, Kapuas Hilir, Selat, Kapuas Kuala, Kapuas Timur;
Bareland are spread on Kahayan kuala, Kapuas kuala, Kapuas murung,
Mantangai, Kahayan Hilir, Pahandut, Dusun Hilir, Jenamas; Grove are spread on
Kapuas Barat, Selat, Mantangai; Plantation are spread on Jenamas, Mantangai,
Kahayan Hilir, Pandih Batu, Basarang, Kapuas Barat, Pulau Petak, Kapuas Hilir,
Selat, Kapuas Timur, Kapuas Kuala, Kapuas Murung; Rice field are spread on
Mantangai, Kapuas Barat, Kapuas Murung, Jenamas, Dusun Hilir; Bog Bush are
spread on Pahandut, Kahayan Hilir, Pandih Batu, Kapuas Kuala, Selat, Basarang,
Pulau Petak, Kapuas Murung, Kapuas Barat, Mantangai, Dusun Hilir, Jenamas
and so on.
For more detail, existing land cover of research area are show on Table 3,
28
Table 3
Land Cover of Research Area
No Type of Land Cover Area (Ha) Percentage(%) Sub District
1 Residential area 1.276,97 0,21 Mantangai,
Kapuas Barat,
2 Bare land 44.728,74 7,36 Kahayan kuala,
Kapuas kuala,
3 Grove 169,56 0,03 Kapuas Barat,
Selat, Mantangai
4 Plantation 167.123,15 27,50 Jenamas,
Mantangai,
29
No Type of Land Cover Area (Ha) Percentage(%) Sub District
Kapuas Barat,
Kapuas Murung,
Jenamas, Dusun
Hilir
6 Bog bush 155.310,50 25,55 Pahandut,
Kahayan Hilir,
7 Primary mangrove forest 3.522,04 0,58 Kapuas Kuala,
Kahayan Kuala
8 Primary swamp forest 25.803,58 4,25 Pahandut,
Kahayan Hilir,
Mantangai
9 Secondary swamp forest 74.686,24 12,29 Pahandut,
Kahayan Hilir,
Mantangai, Dusun
Hilir, Kapuas
Murung
10 Swamp 7.055,26 1,16 Mantangai, Dusun
Hilir, Jenamas
11 Water body 54.450 8,96 Pahandut,
Kahayan Hilir,
Basarang,
Kahayan Kuala,
30
No Type of Land Cover Area (Ha) Percentage(%) Sub District
Selat, Kapuas
Hilir, Pulau Petak,
Kapuas Murung,
Kapuas Barat,
Mantangai,
Jenamas, and
Dusun Hilir
Total 607.806,04 100.000
Source : Landsat Imagery Year 2005
Figure 4. Percentage of Land Cover Type in Research Area
bareland; 7,36
bog bush; 25,55
bush; 0,03
plantation; 27,50
PMF; 0,58 PSF; 4,25 Residential ; 0,21
Rice Field; 12,12 SSF; 12,29 Swamp; 1,16
31 Figure 5. Existing Land Cover in Research Area
4.2 Land Cover Deliniation
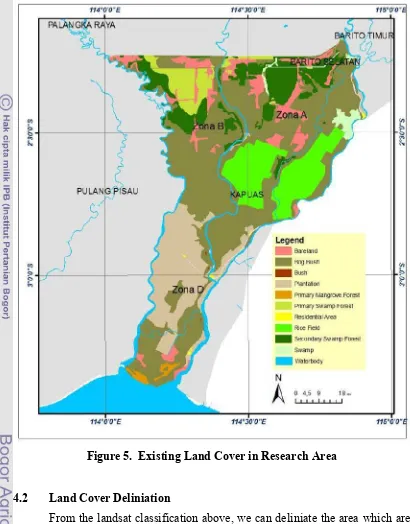
From the landsat classification above, we can deliniate the area which are
conservation and which are not conservation area. This research area are
deliniated based on the Law No.26 Year 2007 concerning spatial planning. The
law divides the two areas into protected areas and cultivated areas. Cultivated
areas such as agriculture, livestock, mixed garden, residential areas, and so on,
while the protected areas included conservation areas are protected forest area,
32
area around the springs, nature reserves, marine natural reserves and other
wetlands, coastal mangrove forest, national park, forest, natural park, the area of
cultural heritage and science, and areas prone to natural disasters.
According to the Law No. 26 Year 2007, the protected area widely spread
on Kahayan Hilir and Dusun Hilir sub district, its approximately 320.827,62
Hectares (52,78 %), and cultivated area is approximately 286.978,42 Hectares
(47,22 %). For more detail, deliniation land cover map are show on Figure 6 and
Figure 7.
Figure
In this research
are primary swamp fo
swamp, bog bush, and
398.150,68 hectares
spatial planning and P
rehabilitation of peatla
then it had to be delete
Cultivated area
field, bush or groove, a
classified again into tw
the land that available f
used for residential, p
and other functional
research area, the area
we can separated the
remained non built ar
which has potentially
and rice field was alre
270.000,00
e 7. Landcover Deliniation in Research Area
ch area the protected area based on landcove
forest, secondary swamp forest, primary ma
nd waterbody. The protected area which have
from the total area, according to UU No 26/200
Presidential Instruction No 82/2007 concerni
tland can not be developed as paddy field (cu
ted also from the availability land for assesmen
ea based on the land cover classification are p
, and bare land which covered 209.655,36 hec
two class, built area and non built area in orde
e for paddy field development. Built area defi
public facilities and infrastructure, trades, ind
l areas that directly relate to life in a settl
ea that categorically as built area are residentia
he residential area from available category
area (plantation, rice field, groove or bush, a
y available for developed as paddy field, but
lready used for agricultural land, and we onl
concervation non concervation
320.827,62
286.978,42
Protected area Cultivated area
34
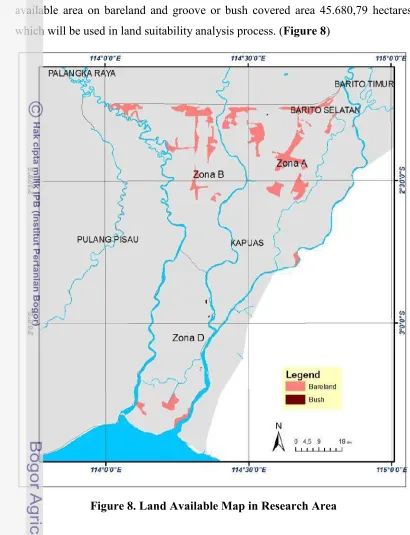
available area on bareland and groove or bush covered area 45.680,79 hectares
which will be used in land suitability analysis process. (Figure 8)
Figure 8. Land Available Map in Research Area
4.3 Feasibility Study For Paddy Field Based on Physical Aspect Criterion
Based on literature study explained on the previous chapter, to determine
suitability land for agriculture purposes in research area, we need several criteria
that can be pull down from several map, there are soil type map, topographic map,
35 determine the impact each criteria to the feasibility for land suitability crop farm
in peat land area, the explanation can be seen below.
4.3.1 Geologic Map
Geologic condition of EMRP area in one sheet of map, there is
Palangkaraya sheet map. Research area are located between Barito River and
Kapuas River, so the soil condition affected by those rivers. According to
compilation data, EMRP area are made of sedimentation rock at age miosen to
pleistosen, and surface sedimentation at holosen age.
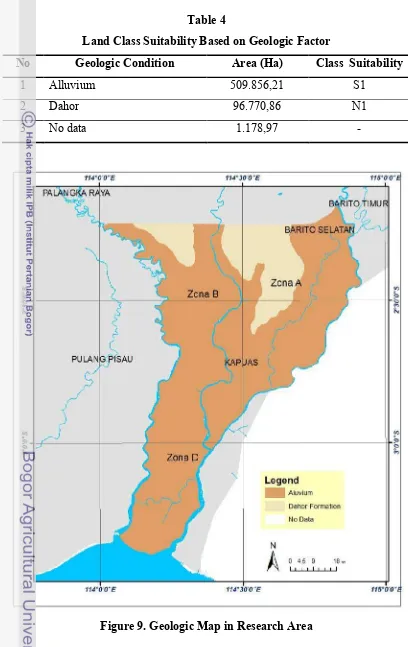
Geologic formation in research area consist of two type. There are Dahor
formation (Tqd) and Alluvium (Qa). Generally, most of geologic condition in
research study are alluvium. Alluvium is free material sedimentation consist of
kerakal, kerikil, sand and clay at holosen age. This condition can be proved from
it’s widely, it is approximately 509.856,21 hectares and spread on 4 district,
Palangkaraya City, Kapuas District, Pulang Pisau District and South Barito
District. Another ones is Dahor Formation. Dahor formations are formed by
tectonic movements which preceded the old lead Pre-Tertiary rocks and Tertiary
uplifted forming Meratus heights. In line with the folding and section (sesar) old
rock then followed by the deposition of dahor formations. Formation of Dahor
estimated at aged Plio Plistosen paralis deposited in the environment. Dahor
Formation rocks consist of soft quartz sandstone and a bit of fine-grained clastic
sedimentary rocks, as well as lignite layers, conglomerate, mudstone, and inserts
lignite, kaolin and limonite. In this research area, it has wide approximately
96.770,86 hectares and spread on Kapuas district, South Barito district and Pulang
Pisau district. The rest one, approximately 1.178,97 hectares have no data. Further
more about geologic condition in research area can be seen on Table 4 and
36
Table 4
Land Class Suitability Based on Geologic Factor
No Geologic Condition Area (Ha) Class Suitability
1 Alluvium 509.856,21 S1
2 Dahor 96.770,86 N1
3 No data 1.178,97 -
37
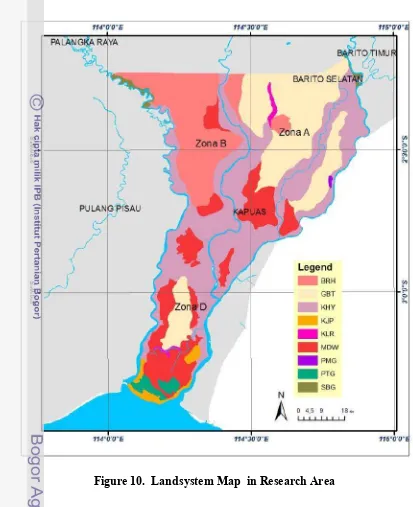
4.3.2 Land System Map
Land system is a group of land that have the nature of the elements of a
homogeneous field at once is a unit of land for commodity zoning. The system of
land used for the analysis of land suitability for wetland food crops (Tanaman
Pertanian Lahan Basah), dry land crops (Tanaman Pertanian Lahan Kering), and
plantation crops / tree crops.
As a basic information of the geomorphology of research study, we need
land system map. This map was obtained from land system collected from
RePPProT map made by “Balai Besar Sumber Daya Lahan Pertanian”. According
to this landsystem map, we can determine some information related to
morphology, slope, rock, soil taxonomi, land texture, and rainfall which can be
used as criteria to classified land suitability. Based on RePPProT map, we can see
that the research area are divided into nine landsystem, there are BRH (Barah),
GBT (Gambut), KHY (Kahayan), KJP (Kajapah), KLR (Klaru), MDW
(Mendawai), PMG (Paminggir), PTG (Putting), dan SBG (Sebangau). For more
detail, can be seen on Table 5, and Figure 10.
Based on landsystem table, some information related to landsystem are
38
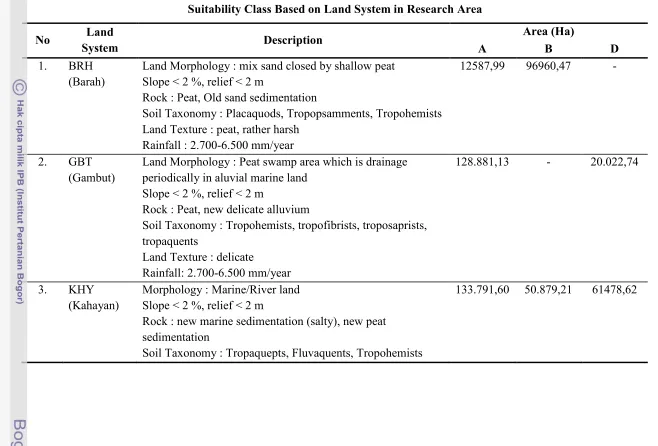
39 Table 5
Suitability Class Based on Land System in Research Area
No Land
Land Morphology : mix sand closed by shallow peat Slope < 2 %, relief < 2 m
Rock : Peat, Old sand sedimentation
Soil Taxonomy : Placaquods, Tropopsamments, Tropohemists Land Texture : peat, rather harsh
Rainfall : 2.700-6.500 mm/year
12587,99 96960,47
-2. GBT
(Gambut)
Land Morphology : Peat swamp area which is drainage periodically in aluvial marine land
Slope < 2 %, relief < 2 m
Rock : Peat, new delicate alluvium
Soil Taxonomy : Tropohemists, tropofibrists, troposaprists, tropaquents
Rock : new marine sedimentation (salty), new peat sedimentation
Soil Taxonomy : Tropaquepts, Fluvaquents, Tropohemists
40
No Land
System Description
Area (Ha)
A B D
Land Texture : peat, delicate Rainfall: 2.000-3.600 mm/year
4. KJP
(Kajapah)
Morphology : mangrove forest in tidal area Slope : < 2%, relief < 2 m
Rock : Peat, new alluvium
Soil Taxonomy : Sulfaquents, sulfaquepts, sulfihemists Land Texture : delicate, peat
Rainfall: 1.400-6.500 mm/year
- - 2.723,71
5. KLR
(Klaru)
Morphology : Flood area that always drainage Slope < 2 %, relief < 2 m
Rock : River Sedimentation
Soil Taxonomy : Fluvaquents, Tropaquents, Tropohemists Land Texture : peat, delicate
Rainfall: 2.100-4.100 mm/year
Soil Taxonomy : Tropohemists, Troposaprists, Tropaquents Land Texture : peat, delicate
Rainfall: 2.000-4.000 mm/year
41
Soil Taxonomy : Fluvaquents, Tropaquepts Land Texture : delicate
Rainfall: 2.200-4.000 mm/year
598,47 -
-8. PTG
(Puting)
Morphology : Beetween coastal area Slope < 2 %, relief < 2 m
Rock : Marine sedimentation
Soil Taxonomy : Psammaquents, Tropaquents, Tropopsamments
Land Texture : delicate, harsh Rainfall: 1.400-4.000 mm/year
- - 3545,7
9. SBG
(Sebangau)
Morphology : Big river area with wide canal Slope < 2 %, relief < 2 m
Rock : Aluvium, come from river sedimentation Soil Taxonomy : Psammaquents, Tropaquents, Land Texture : delicate, moderate
Rainfall: 2.000-2.800 mm/year
- 2878,85
42
4.3.3 Soil Acidity (pH)
Degree of soil acidity represent one of element soil fertility and represent
the constrictor influenced the absorbtion of hara element. Soil acidity in research area have pH between 3,9 – 4,8. Most of the area having pH less than 4.
4.3.4 Phyrit Concentration
Phyrit (FeS2) concentration on potencial acid sulfat soil became a problem
if they has oxydated because incorrect process on land management. Phyrit
became depend on phyrit deepness, concentration, and commodity. Mineral
substance having concentration FeS2 > 0,75% have earned referred as phyrit.
Amount of phyrit in research location on mineral soil range from 0,24 - 1,45%.
Mineral soil with phyrit 0,81 - 1,45% having widest spreading and only a little
one have phyrit concentration between 0,21 - 0,51%. On the other hand, peatland
high than 2 meter does not have concentration of phyrit.
4.3.5 Elevation Map
Elevation in research area are flat relatively with maximum elevation 50 m
above sea level and minimum elevation 1 m above sea level. Based on the
elevation data and type of landsystem in research area, slope condition are
relatively flat with average slope less than two percent. In order to determine land
suitability for paddy field in research area, these factor are not really influenced
because in research area these factor is quite flat. For more detail about elevation
43 Figure 11. Elevation Map in Research Area
4.3.6 Climate Classification Map
In research area, climate classification based on Oldeman classification are
classified into 5 climate type along with ratio between wet month and dry month
from 19 rainfall station in research area. Based on result analysis using Oldeman
criteria, we can obtain that climate type in research area are consist of five type.
There are C2, C3, D1, D3 and E2. For more details, climate type classification
44
Table 6
Agricultural Activities Description in Research Area
Based on Oldeman Classification
Climate
Type Sub District Agricultural Activities
C2
C3
C4
Kapuas Barat, Basarang, Pulau Petak,
Pandih Batu, Kapuas Hilir dan Dusun Hilir
Kapuas Barat, Kapuas Murung
-Paddy planting once,
secondly crops not plant in
dry season
D1 Jenamas dan Kapuas Murung Short age paddy once,
high production and
palawija
D2
D3
-Kahayan Hilir, Mantangai, -Kahayan
Kuala, Kapuas Kuala, Selat, Pandih Batu,
Only possible once paddy
45 Climate
Type Sub District Agricultural Activities
D4
Kapuas Hilir
-E Mantangai, Dusun Hilir, Jenamas,
Kahayan Hilir, Kapuas Barat, Kapuas
Murung
Too dry, only possible
once palawija
Source : Analysis Result, 2008
According to Oldeman Classification, the area which categorized as
Climate Type C2, C3 and C4 are quite suitable for agricultural activities and it
was possible for paddy planting once and crops. The area which have climate type
of C2 and C3 are spread along Kapuas Barat, Basarang, Pulau Petak, Pandih Batu,
Kapuas Hilir dan Dusun Hilir, Kapuas Barat, and Kapuas Murung District. Class
of D1 in Climate type zone in research area are spread on Jenamas and Kapuas
Murung district. It was possible for planting paddy once at short age and crops.
While D3 climate type are spread on Kahayan Hilir, Mantangai, Kahayan Kuala,
Kapuas Kuala, Selat, Pandih Batu, Kapuas Hilir District. In terms of agriculture,
this kind of climate type is less suitable for development as paddy field, but with
some management in soil treatment, it is still possible to grow paddy field and
crops once a year. For more details, land suitability based on Oldeman
Classification in research area are show on Table 7
Table 7.
Land Suitability Based on Climate Classification
on Several Rainfall Station in Research Area
46
No Rainfall Station
Wet
Month
Dry
Month
Climate
Type
Suitability
Class
5 Basarang 6 3 C2 S3
6 Tangkiling 3 3 D3 N1
7 Anjir Sarapat 3 3 D3 N1
8 Tamban Catur 2 2 E2 N2
9 Palingkau 4 1 D1 N1
Source : Analysis Result, 2008
47
4.3.7 Peat depth Map
As mention before, peat depth map is obtained by interpolating peat depth
in research area. Based on interpolating result, we obtain that peat depth in
research area are variated between 0 up to 12 meter. Based on characteristic of
peatdepth itself, which is peat depth more than three meter are not suitable for
plantation, it must be conserve. This is aimed for not collide Presidential
Instruction No. 2 Year 2007 which is regulated about acceleration of rehabilitation
and revitalization peatland development zone in Central Kalimantan. For further
analysis, this peat depth range are reclassify according to Hardjowigeno criteria in
determine the land suitability map for paddy field. For more details, peath depth
map are show on Figure 13. From above figure, we can see that peat having depth
value less than 3 meter are spread along Zone A and D precisely can be seen on
this following table (Table 8)
Table 8
Land Suitability Based on Peat Depth Factor
and Their Spread in Research Area
No Peat Depth Total (Ha) Percentage
(%)
5 Mineral Soil 306.589,60 50,44 S1
Total 607.806,04 100.00
Source : Figure 4.9
Based on landform and landsystem data, we can determine decomposition
of peat in research area. It is divided into three categories. There are Fibrist,
Hemist and Saprist. Where fibrist is peat with early corrosion and more than ¾ of
48
corrosion, half of its volume had weathered and the others half is fiber (half
mature). And Saprist is peat decomposition have already weathered (mature).
Figure 13. Peat depth Map in Research Area
4.3.8 Overlay Process Analysis
Spatial analysis in this study is overlaying the spatial data based on
criteria. Those criteria are taken from literatures. In this research we use weighting
method to identify the land suitability using parameters which already mention
before such as ground deppness, land texture, land fertility, pH, phyrit deepness,
49 and elevation parameter obtained from Bakosurtanal and derivation from DEM
SRTM, peat depth parameters taken from Bappeda Central Kalimantan Province.
Each of parameter has criteria to determine where is the suitable area for paddy
field and where is the area are not suitable to develop paddy field in research area.
According to Harjowigeno’s criteria have mentioned in chapter II, we can
determined the suitability area which is divided into 5 suitability class High
Suitable (S1), Moderate Suitable (S2), Suitable (S3) , Less Suitable (N1) , and Not
Suitable (N2). As the result, almost all of research area are not suitable for paddy
field development ( 605.538,61 ha), and only small area are suitable to develop as
paddy field area (2.267,43 ha). The suitable area which have only has a tiny part
of research study are spread along the river and tidal area. It has been proved from
the result that peatland area are not suitable for paddy field as almost people had
argued. For more detail about suitability map as the result of this overlay process
can be seen on following figure (See Figure 14)
4.3.9 Suitability and Availability Land for Paddy Field
Based on overlay analysis, the suitable land of research area are 2.267,43
hectares. After we has an suitable area, to determine the land that suitable and
available, the suitable land from previous analysis, we have to clip with available
land according to landcover deliniation. The area that suitable and available
reached 14930,91 hectares. N1 is 14.926,2 hectares and S1 reaches 4,71 hectares.
For more detail about suitability and availability map as the result of this overlay
50
51 Figure 15. Land Suitability and Land Availability Map